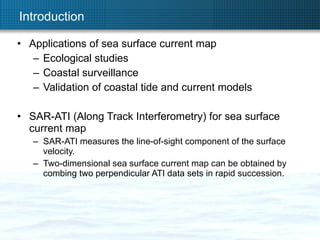
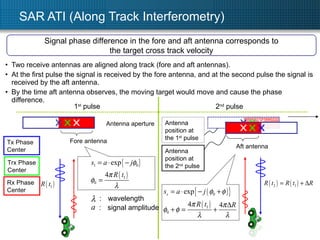
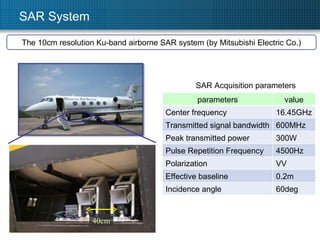
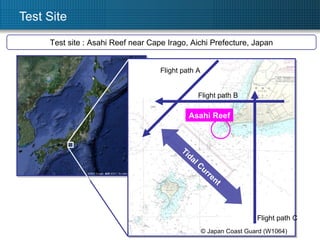
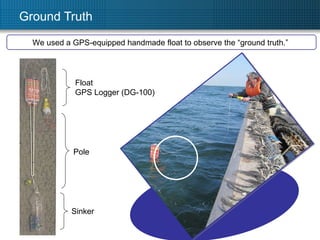
1. The document describes using Ku-band SAR along-track interferometry (ATI) to measure sea surface currents from an airborne SAR system. 2. Flight tests were conducted over Asahi Reef in Japan, where tidal currents ranged from 0.7-0.9 m/s. 3. Analysis of perpendicular flight lines using ATI yielded a two-dimensional surface current map with velocities matching ground truths of 0.7-0.9 m/s within 10m resolution cells.

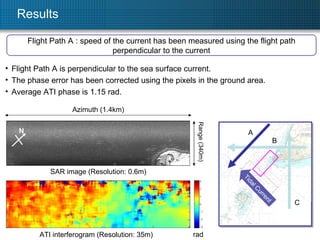
![Results Flight Path A : average cross range velocity was estimated to be 0.95m/s Radial velocity map (Resolution: 35m) SAR image (Resolution: 0.6m) m/s Azimuth (1.4km) Range (340m) v GND = 0.95[m/s] N A B C Tidal Current ATI phase off-nadir angle wavelength Effective baseline platform velocity 0.018 m 60° 0.2 m 100 m/s parameters value 1.15 rad](https://image.slidesharecdn.com/tu3-110726160436-phpapp01/85/TU3-T10-3-ppt-11-320.jpg)
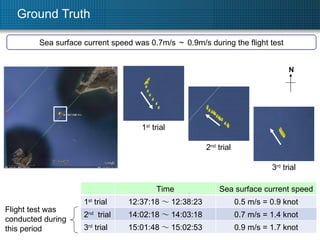
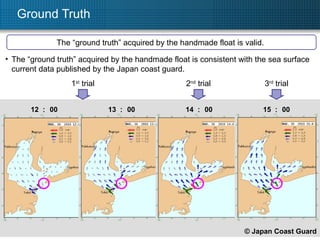
![Results V_N = 0 . 51 [m/s] V_E = -0 . 64m/s] Mean velocity Estimated sea surface current speed : 0.82m/s Matches well with the ground truth (0.7m/s ~ 0.9m/s ). Spatial resolution : 10m x 10m Flight Path B & C : Two-dimensional sea surface current map can be obtained by combing two perpendicular ATI data sets in rapid succession. N](https://image.slidesharecdn.com/tu3-110726160436-phpapp01/85/TU3-T10-3-ppt-14-320.jpg)