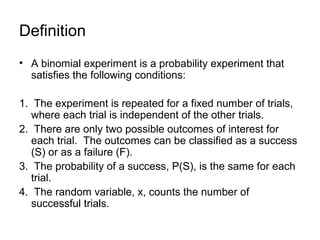
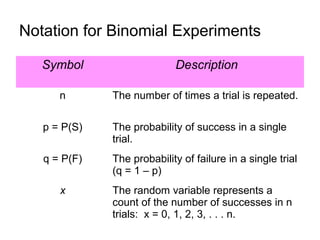
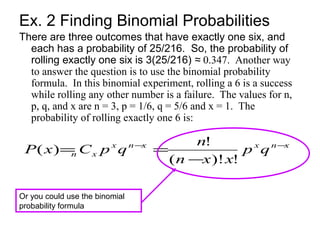
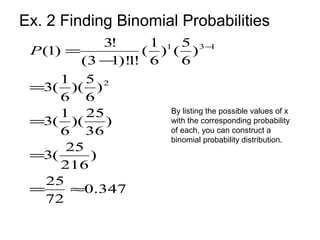
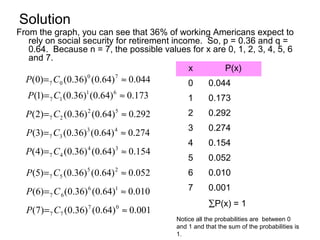
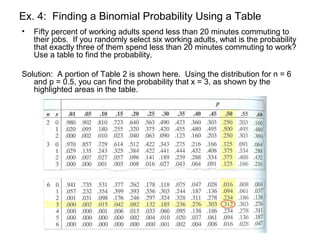
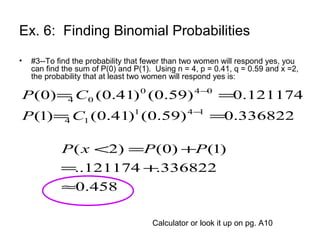
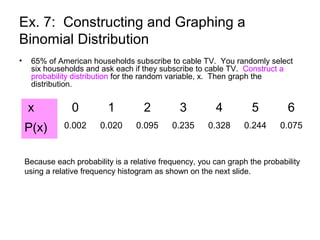
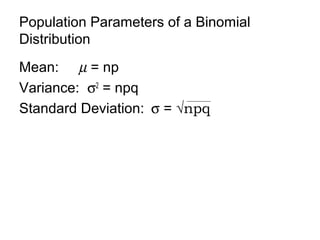
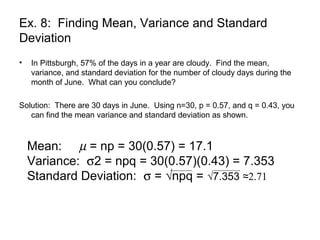
SlideShare a Scribd company logo
4.2 Binomial Distributions
Statistics
Mrs. Spitz
Fall 2008
Objectives/Assignment
• How to determine if a probability experiment is a
binomial experiment
• How to find binomial probabilities using the
binomial probability table and technology
• How to construct a binomial distribution and its
graph
• How to find the mean, variance and standard
deviation of a binomial probability distribution
Assignment: pp. 173-175 #1-18 all
Binomial Experiments
• There are many probability experiments
for which the results of each trial can be
reduced to two outcomes: success and
failure. For instance, when a basketball
player attempts a free throw, he or she
either makes the basket or does not.
Probability experiments such as these are
called binomial experiments.
Definition
• A binomial experiment is a probability experiment that
satisfies the following conditions:
1. The experiment is repeated for a fixed number of trials,
where each trial is independent of the other trials.
2. There are only two possible outcomes of interest for
each trial. The outcomes can be classified as a success
(S) or as a failure (F).
3. The probability of a success, P(S), is the same for each
trial.
4. The random variable, x, counts the number of
successful trials.
Notation for Binomial Experiments
Symbol Description
n The number of times a trial is repeated.
p = P(S) The probability of success in a single
trial.
q = P(F) The probability of failure in a single trial
(q = 1 – p)
x The random variable represents a
count of the number of successes in n
trials: x = 0, 1, 2, 3, . . . n.
Note:
• Here is a simple example of binomial experiment. From
a standard deck of cards, you pick a card, note whether
it is a club or not, and replace the card. You repeat the
experiment 5 times, so n = 5. The outcomes for each
trial can be classified in two categories: S = selecting a
club and F = selecting another suit. The probabilities of
success and failure are:
p = P(S) = ¼ and q = P(F) = ¾.
The random variable x represents the number of clubs
selected in the 5 trials. So, the possible values of the
random variable are 0, 1, 2, 3, 4, and 5. Note that x is a
discrete random variable because its possible values can
be listed.
Ex. 1: Binomial Experiments
• Decide whether the experiment is a
binomial experiment. If it is, specify the
values of n, p and q and list the possible
values of the random variable, x. If it is
not, explain why.
1. A certain surgical procedure has an 85%
chance of success. A doctor performs the
procedure on eight patients. The random
variable represents the number of
successful surgeries.
Ex. 1: Binomial Experiments
Solution: the experiment is a binomial experiment
because it satisfies the four conditions of a
binomial experiment. In the experiment, each
surgery represents one trial. There are eight
surgeries, and each surgery is independent of
the others. Also, there are only two possible
outcomes for each surgery—either the surgery is
a success or it is a failure. Finally, the
probability of success for each surgery is 0.85.
n = 8
p = 0.85
q = 1 – 0.85 = 0.15
x = 0, 1, 2, 3, 4, 5, 6, 7, 8
Ex. 1: Binomial Experiments
• Decide whether the experiment is a
binomial experiment. If it is, specify the
values of n, p and q and list the possible
values of the random variable, x. If it is
not, explain why.
2. A jar contains five red marbles, nine blue
marbles and six green marbles. You
randomly select three marbles from the
jar, without replacement. The random
variable represents the number of red
marbles.
Ex. 1: Binomial Experiments
Solution: The experiment is not a binomial
experiment because it does not satisfy all
four conditions of a binomial experiment.
In the experiment, each marble selection
represents one trial and selecting a red
marble is a success. When selecting the
first marble, the probability of success is
5/20. However because the marble is not
replaced, the probability is no longer 5/20.
So the trials are not independent, and the
probability of a success is not the same for
each trial.
Binomial Probabilities
There are several ways to find the probability of x
successes in n trials of a binomial experiment. One way
is to use the binomial probability formula.
Binomial Probability Formula
In a binomial experiment, the probability of exactly x
successes in n trials is:
xnxxnx
xn qp
xxn
n
qpCxP −−
−
==
!)!(
!
)(
Ex. 2 Finding Binomial Probabilities
A six sided die is rolled 3 times. Find the probability of
rolling exactly one 6.
Roll 1 Roll 2 Roll 3 Frequency # of 6’s Probability
(1)(1)(1) = 1 3 1/216
(1)(1)(5) = 5 2 5/216
(1)(5)(1) = 5 2 5/216
(1)(5)(5) = 25 1 25/216
(5)(1)(1) = 5 2 5/216
(5)(1)(5) = 25 1 25/216
(5)(5)(1) = 25 1 25/216
(5)(5)(5) = 125 0 125/216
You could use
a tree diagram
Ex. 2 Finding Binomial Probabilities
There are three outcomes that have exactly one six, and
each has a probability of 25/216. So, the probability of
rolling exactly one six is 3(25/216) 0.347. Another way≈
to answer the question is to use the binomial probability
formula. In this binomial experiment, rolling a 6 is a success
while rolling any other number is a failure. The values for n,
p, q, and x are n = 3, p = 1/6, q = 5/6 and x = 1. The
probability of rolling exactly one 6 is:
xnxxnx
xn qp
xxn
n
qpCxP −−
−
==
!)!(
!
)(
Or you could use the binomial
probability formula
Ex. 2 Finding Binomial Probabilities
347.0
72
25
)
216
25
(3
)
36
25
)(
6
1
(3
)
6
5
)(
6
1
(3
)
6
5
()
6
1
(
!1)!13(
!3
)1(
2
131
≈=
=
=
=
−
= −
P
By listing the possible values of x
with the corresponding probability
of each, you can construct a
binomial probability distribution.
Ex. 3: Constructing a Binomial Distribution
In a survey, American workers and retirees
are asked to name their expected sources
of retirement income. The results are
shown in the graph. Seven workers who
participated in the survey are asked
whether they expect to rely on social
security for retirement income. Create a
binomial probability distribution for the
number of workers who respond yes. (pg.
167)
Solution
From the graph, you can see that 36% of working Americans expect to
rely on social security for retirement income. So, p = 0.36 and q =
0.64. Because n = 7, the possible values for x are 0, 1, 2, 3, 4, 5, 6
and 7.
044.0)64.0()36.0()0( 70
07 ≈= CP
173.0)64.0()36.0()1( 61
17 ≈= CP
292.0)64.0()36.0()2( 52
27 ≈= CP
274.0)64.0()36.0()3( 43
37 ≈= CP
154.0)64.0()36.0()4( 34
47 ≈= CP
052.0)64.0()36.0()5( 25
57 ≈= CP
010.0)64.0()36.0()6( 16
67 ≈= CP
001.0)64.0()36.0()7( 07
77 ≈= CP
x P(x)
0 0.044
1 0.173
2 0.292
3 0.274
4 0.154
5 0.052
6 0.010
7 0.001
∑P(x) = 1
Notice all the probabilities are between 0
and 1 and that the sum of the probabilities is
1.
Note:
• Finding binomial probabilities with the
binomial formula can be a tedious and
mistake prone process. To make this
process easier, you can use a binomial
probability. Table 2 in Appendix B lists the
binomial probability for selected values of
n and p.
Ex. 4: Finding a Binomial Probability Using a Table
• Fifty percent of working adults spend less than 20 minutes commuting to
their jobs. If you randomly select six working adults, what is the probability
that exactly three of them spend less than 20 minutes commuting to work?
Use a table to find the probability.
Solution: A portion of Table 2 is shown here. Using the distribution for n = 6
and p = 0.5, you can find the probability that x = 3, as shown by the
highlighted areas in the table.
Ex. 4: Finding a Binomial Probability Using a Table
The probability if you look at n = 6 and x = 3 over to 0.50 is .312. So the
probability that exactly 3 out of the six workers spend less than 20 minutes
commuting to work is 0.312
Ex. 5 Using Technology to find a Binomial Probability
An even more efficient way to find binomial probability is to use a calculator or
a computer. For instance, you can find binomial probabilities by using your
TI-83, TI-84 or Excel on the computer.
Go to 2nd
VARS on your calculator. Arrow down to binompdf which is choice A.
Click Enter. This will give the command. Enter 100, .58, 65. The comma
button is located above the 7 on your calculator.
You should get .0299216472. Please practice this now because you will need
to know it for the Chapter 4 test and for homework.
Ex. 6: Finding Binomial Probabilities
• A survey indicates that 41% of American
women consider reading as their favorite
leisure time activity. You randomly select
four women and ask them if reading is
their favorite leisure-time activity. Find the
probability that (1) exactly two of them
respond yes, (2) at least two of them
respond yes, and (3) fewer than two of
them respond yes.
Ex. 6: Finding Binomial Probabilities
• #1--Using n = 4, p = 0.41, q = 0.59 and x =2, the
probability that exactly two women will respond yes is:
35109366.)3481)(.1681(.6
)3481)(.1681(.
4
24
)59.0()41.0(
!2)!24(
!4
)59.0()41.0()2(
242
242
24
=
=
=
−
==
−
−
CP
Calculator or look it up on pg. A10
Ex. 6: Finding Binomial Probabilities
• #2--To find the probability that at least two women will respond yes, you can
find the sum of P(2), P(3), and P(4). Using n = 4, p = 0.41, q = 0.59 and x
=2, the probability that at least two women will respond yes is:
028258.0)59.0()41.0()4(
162653.0)59.0()41.0()3(
351093.)59.0()41.0()2(
444
44
343
34
242
24
==
==
==
−
−
−
CP
CP
CP
542.0
028258162653.351093.
)4()3()2()2(
≈
++=
++=≥ PPPxP
Calculator or look it up on pg. A10
Ex. 6: Finding Binomial Probabilities
• #3--To find the probability that fewer than two women will respond yes, you
can find the sum of P(0) and P(1). Using n = 4, p = 0.41, q = 0.59 and x =2,
the probability that at least two women will respond yes is:
336822.0)59.0()41.0()1(
121174.0)59.0()41.0()0(
141
14
040
04
==
==
−
−
CP
CP
458.0
336822.121174..
)1()0()2(
≈
+=
+=< PPxP
Calculator or look it up on pg. A10
Ex. 7: Constructing and Graphing a
Binomial Distribution
• 65% of American households subscribe to cable TV. You randomly select
six households and ask each if they subscribe to cable TV. Construct a
probability distribution for the random variable, x. Then graph the
distribution.
Calculator or look it up on pg. A10
075.0)35.0()65.0()6(
244.0)35.0()65.0()5(
328.0)35.0()65.0()4(
235.0)35.0()65.0()3(
095.0)35.0()65.0()2(
020.0)35.0()65.0()1(
002.0)35.0()65.0()0(
666
66
565
56
464
46
363
36
262
26
161
16
060
06
==
==
==
==
==
==
==
−
−
−
−
−
−
−
CP
CP
CP
CP
CP
CP
CP
Ex. 7: Constructing and Graphing a
Binomial Distribution
• 65% of American households subscribe to cable TV. You randomly select
six households and ask each if they subscribe to cable TV. Construct a
probability distribution for the random variable, x. Then graph the
distribution.
Because each probability is a relative frequency, you can graph the probability
using a relative frequency histogram as shown on the next slide.
x 0 1 2 3 4 5 6
P(x) 0.002 0.020 0.095 0.235 0.328 0.244 0.075
Ex. 7: Constructing and Graphing a
Binomial Distribution
• Then graph the distribution.
x 0 1 2 3 4 5 6
P(x) 0.002 0.020 0.095 0.235 0.328 0.244 0.075
0
0.05
0.1
0.15
0.2
0.25
0.3
0.35
0 1 2 3 4 5 6
P(x)
R
e
l
a
t
i
v
e
F
r
e
q
u
e
n
c
y
Households
NOTE: that the
histogram is
skewed left. The
graph of a binomial
distribution with p >
.05 is skewed left,
while the graph of a
binomial
distribution with p <
.05 is skewed right.
The graph of a
binomial
distribution with p =
.05 is symmetric.
Mean, Variance and Standard Deviation
• Although you can use the formulas
learned in 4.1 for mean, variance and
standard deviation of a probability
distribution, the properties of a binomial
distribution enable you to use much
simpler formulas. They are on the next
slide.
Population Parameters of a Binomial
Distribution
Mean: µ = np
Variance: σ2
= npq
Standard Deviation: σ = √npq
Ex. 8: Finding Mean, Variance and Standard
Deviation
• In Pittsburgh, 57% of the days in a year are cloudy. Find the mean,
variance, and standard deviation for the number of cloudy days during the
month of June. What can you conclude?
Solution: There are 30 days in June. Using n=30, p = 0.57, and q = 0.43, you
can find the mean variance and standard deviation as shown.
Mean: µ = np = 30(0.57) = 17.1
Variance: σ2 = npq = 30(0.57)(0.43) = 7.353
Standard Deviation: σ = √npq = √7.353 2.71≈

More Related Content

What's hot

Probability
ProbabilityProbability
Probability
ScholarsPoint1
 
Binomial probability distribution
Binomial probability distributionBinomial probability distribution
Binomial probability distribution
Nadeem Uddin
 
probability
probabilityprobability
probability
Dr.Muhammad Omer
 
Discrete distributions: Binomial, Poisson & Hypergeometric distributions
Discrete distributions:  Binomial, Poisson & Hypergeometric distributionsDiscrete distributions:  Binomial, Poisson & Hypergeometric distributions
Discrete distributions: Binomial, Poisson & Hypergeometric distributions
ScholarsPoint1
 
Hypothesis testing chi square test for independence
Hypothesis testing chi square test for independenceHypothesis testing chi square test for independence
Hypothesis testing chi square test for independence
Nadeem Uddin
 
Unit 1-probability
Unit 1-probabilityUnit 1-probability
Unit 1-probability
Rai University
 
Testing of hypotheses
Testing of hypothesesTesting of hypotheses
Testing of hypotheses
RajThakuri
 
Hypothesis testing
Hypothesis testingHypothesis testing
Hypothesis testing
Muhammadasif909
 
4 1 probability and discrete probability distributions
4 1 probability and discrete    probability distributions4 1 probability and discrete    probability distributions
4 1 probability and discrete probability distributions
Lama K Banna
 
Geometric probability distribution
Geometric probability distributionGeometric probability distribution
Geometric probability distribution
Nadeem Uddin
 
Binomial distribution
Binomial distributionBinomial distribution
Binomial distribution
Dr. Satyanarayan Pandey
 
Basic concepts of probability
Basic concepts of probabilityBasic concepts of probability
Basic concepts of probability
Avjinder (Avi) Kaler
 
Sampling distribution
Sampling distributionSampling distribution
Sampling distribution
Nilanjan Bhaumik
 
Parametric Statistical tests
Parametric Statistical testsParametric Statistical tests
Parametric Statistical tests
Sundar B N
 
Nonparametric tests
Nonparametric testsNonparametric tests
Nonparametric testsArun Kumar
 
Discrete probability distribution (complete)
Discrete probability distribution (complete)Discrete probability distribution (complete)
Discrete probability distribution (complete)
ISYousafzai
 
introduction to probability
introduction to probabilityintroduction to probability
introduction to probability
lovemucheca
 
Binomial and Poission Probablity distribution
Binomial and Poission Probablity distributionBinomial and Poission Probablity distribution
Binomial and Poission Probablity distribution
Prateek Singla
 
Probability distribution
Probability distributionProbability distribution
Probability distribution
Rohit kumar
 
Probability distribution
Probability distributionProbability distribution
Probability distributionRanjan Kumar
 

What's hot (20)

Probability
ProbabilityProbability
Probability
 
Binomial probability distribution
Binomial probability distributionBinomial probability distribution
Binomial probability distribution
 
probability
probabilityprobability
probability
 
Discrete distributions: Binomial, Poisson & Hypergeometric distributions
Discrete distributions:  Binomial, Poisson & Hypergeometric distributionsDiscrete distributions:  Binomial, Poisson & Hypergeometric distributions
Discrete distributions: Binomial, Poisson & Hypergeometric distributions
 
Hypothesis testing chi square test for independence
Hypothesis testing chi square test for independenceHypothesis testing chi square test for independence
Hypothesis testing chi square test for independence
 
Unit 1-probability
Unit 1-probabilityUnit 1-probability
Unit 1-probability
 
Testing of hypotheses
Testing of hypothesesTesting of hypotheses
Testing of hypotheses
 
Hypothesis testing
Hypothesis testingHypothesis testing
Hypothesis testing
 
4 1 probability and discrete probability distributions
4 1 probability and discrete    probability distributions4 1 probability and discrete    probability distributions
4 1 probability and discrete probability distributions
 
Geometric probability distribution
Geometric probability distributionGeometric probability distribution
Geometric probability distribution
 
Binomial distribution
Binomial distributionBinomial distribution
Binomial distribution
 
Basic concepts of probability
Basic concepts of probabilityBasic concepts of probability
Basic concepts of probability
 
Sampling distribution
Sampling distributionSampling distribution
Sampling distribution
 
Parametric Statistical tests
Parametric Statistical testsParametric Statistical tests
Parametric Statistical tests
 
Nonparametric tests
Nonparametric testsNonparametric tests
Nonparametric tests
 
Discrete probability distribution (complete)
Discrete probability distribution (complete)Discrete probability distribution (complete)
Discrete probability distribution (complete)
 
introduction to probability
introduction to probabilityintroduction to probability
introduction to probability
 
Binomial and Poission Probablity distribution
Binomial and Poission Probablity distributionBinomial and Poission Probablity distribution
Binomial and Poission Probablity distribution
 
Probability distribution
Probability distributionProbability distribution
Probability distribution
 
Probability distribution
Probability distributionProbability distribution
Probability distribution
 

Similar to 4.2 binomial distributions

Binomial distribution good
Binomial distribution goodBinomial distribution good
Binomial distribution goodZahida Pervaiz
 
Probability 4.2
Probability 4.2Probability 4.2
Probability 4.2herbison
 
binomialprobabilitydistribution-200508182110 (1).pdf
binomialprobabilitydistribution-200508182110 (1).pdfbinomialprobabilitydistribution-200508182110 (1).pdf
binomialprobabilitydistribution-200508182110 (1).pdf
Hafizsamiullah1791
 
powerpoints probability.pptx
powerpoints probability.pptxpowerpoints probability.pptx
powerpoints probability.pptx
carrie mixto
 
Sqqs1013 ch5-a122
Sqqs1013 ch5-a122Sqqs1013 ch5-a122
Sqqs1013 ch5-a122
kim rae KI
 
Statistik Chapter 5 (1)
Statistik Chapter 5 (1)Statistik Chapter 5 (1)
Statistik Chapter 5 (1)WanBK Leo
 
statiscs and probability math college to help student
statiscs and probability math college  to help studentstatiscs and probability math college  to help student
statiscs and probability math college to help student
charlezeannprodonram
 
Statistik Chapter 5
Statistik Chapter 5Statistik Chapter 5
Statistik Chapter 5WanBK Leo
 
x13.pdf
x13.pdfx13.pdf
x13.pdf
TarikuArega1
 
Practice Quiz Week 4
Practice Quiz Week 4Practice Quiz Week 4
Practice Quiz Week 4tjvmetric
 
vdocuments.mx_chapter-5-probability-distributions-56a36d9fddc1e.ppt
vdocuments.mx_chapter-5-probability-distributions-56a36d9fddc1e.pptvdocuments.mx_chapter-5-probability-distributions-56a36d9fddc1e.ppt
vdocuments.mx_chapter-5-probability-distributions-56a36d9fddc1e.ppt
CharlesElquimeGalapo
 
Negative binomial distribution
Negative binomial distributionNegative binomial distribution
Negative binomial distribution
Nadeem Uddin
 
Discrete probability distributions
Discrete probability distributionsDiscrete probability distributions
Discrete probability distributions
Nadeem Uddin
 
(7) Lesson 9.2
(7) Lesson 9.2(7) Lesson 9.2
(7) Lesson 9.2
wzuri
 
BINOMIAL DISTRIBUTION.pptx
BINOMIAL DISTRIBUTION.pptxBINOMIAL DISTRIBUTION.pptx
BINOMIAL DISTRIBUTION.pptx
CHIRANTANMONDAL2
 
lesson4-intrduction to probability grade10
lesson4-intrduction to probability grade10lesson4-intrduction to probability grade10
lesson4-intrduction to probability grade10
CharlesIanVArnado
 
Intro to probability
Intro to probabilityIntro to probability
Intro to probability
getyourcheaton
 
probability.pptx
probability.pptxprobability.pptx
probability.pptx
AqeelRahman9
 
Simple probability
Simple probabilitySimple probability
Simple probability
06426345
 
Probability definitions and properties
Probability definitions and propertiesProbability definitions and properties
Probability definitions and properties
Hamza Qureshi
 

Similar to 4.2 binomial distributions (20)

Binomial distribution good
Binomial distribution goodBinomial distribution good
Binomial distribution good
 
Probability 4.2
Probability 4.2Probability 4.2
Probability 4.2
 
binomialprobabilitydistribution-200508182110 (1).pdf
binomialprobabilitydistribution-200508182110 (1).pdfbinomialprobabilitydistribution-200508182110 (1).pdf
binomialprobabilitydistribution-200508182110 (1).pdf
 
powerpoints probability.pptx
powerpoints probability.pptxpowerpoints probability.pptx
powerpoints probability.pptx
 
Sqqs1013 ch5-a122
Sqqs1013 ch5-a122Sqqs1013 ch5-a122
Sqqs1013 ch5-a122
 
Statistik Chapter 5 (1)
Statistik Chapter 5 (1)Statistik Chapter 5 (1)
Statistik Chapter 5 (1)
 
statiscs and probability math college to help student
statiscs and probability math college  to help studentstatiscs and probability math college  to help student
statiscs and probability math college to help student
 
Statistik Chapter 5
Statistik Chapter 5Statistik Chapter 5
Statistik Chapter 5
 
x13.pdf
x13.pdfx13.pdf
x13.pdf
 
Practice Quiz Week 4
Practice Quiz Week 4Practice Quiz Week 4
Practice Quiz Week 4
 
vdocuments.mx_chapter-5-probability-distributions-56a36d9fddc1e.ppt
vdocuments.mx_chapter-5-probability-distributions-56a36d9fddc1e.pptvdocuments.mx_chapter-5-probability-distributions-56a36d9fddc1e.ppt
vdocuments.mx_chapter-5-probability-distributions-56a36d9fddc1e.ppt
 
Negative binomial distribution
Negative binomial distributionNegative binomial distribution
Negative binomial distribution
 
Discrete probability distributions
Discrete probability distributionsDiscrete probability distributions
Discrete probability distributions
 
(7) Lesson 9.2
(7) Lesson 9.2(7) Lesson 9.2
(7) Lesson 9.2
 
BINOMIAL DISTRIBUTION.pptx
BINOMIAL DISTRIBUTION.pptxBINOMIAL DISTRIBUTION.pptx
BINOMIAL DISTRIBUTION.pptx
 
lesson4-intrduction to probability grade10
lesson4-intrduction to probability grade10lesson4-intrduction to probability grade10
lesson4-intrduction to probability grade10
 
Intro to probability
Intro to probabilityIntro to probability
Intro to probability
 
probability.pptx
probability.pptxprobability.pptx
probability.pptx
 
Simple probability
Simple probabilitySimple probability
Simple probability
 
Probability definitions and properties
Probability definitions and propertiesProbability definitions and properties
Probability definitions and properties
 

Recently uploaded

Epistemic Interaction - tuning interfaces to provide information for AI support
Epistemic Interaction - tuning interfaces to provide information for AI supportEpistemic Interaction - tuning interfaces to provide information for AI support
Epistemic Interaction - tuning interfaces to provide information for AI support
Alan Dix
 
Transcript: Selling digital books in 2024: Insights from industry leaders - T...
Transcript: Selling digital books in 2024: Insights from industry leaders - T...Transcript: Selling digital books in 2024: Insights from industry leaders - T...
Transcript: Selling digital books in 2024: Insights from industry leaders - T...
BookNet Canada
 
JMeter webinar - integration with InfluxDB and Grafana
JMeter webinar - integration with InfluxDB and GrafanaJMeter webinar - integration with InfluxDB and Grafana
JMeter webinar - integration with InfluxDB and Grafana
RTTS
 
Unsubscribed: Combat Subscription Fatigue With a Membership Mentality by Head...
Unsubscribed: Combat Subscription Fatigue With a Membership Mentality by Head...Unsubscribed: Combat Subscription Fatigue With a Membership Mentality by Head...
Unsubscribed: Combat Subscription Fatigue With a Membership Mentality by Head...
Product School
 
Neuro-symbolic is not enough, we need neuro-*semantic*
Neuro-symbolic is not enough, we need neuro-*semantic*Neuro-symbolic is not enough, we need neuro-*semantic*
Neuro-symbolic is not enough, we need neuro-*semantic*
Frank van Harmelen
 
FIDO Alliance Osaka Seminar: Overview.pdf
FIDO Alliance Osaka Seminar: Overview.pdfFIDO Alliance Osaka Seminar: Overview.pdf
FIDO Alliance Osaka Seminar: Overview.pdf
FIDO Alliance
 
Builder.ai Founder Sachin Dev Duggal's Strategic Approach to Create an Innova...
Builder.ai Founder Sachin Dev Duggal's Strategic Approach to Create an Innova...Builder.ai Founder Sachin Dev Duggal's Strategic Approach to Create an Innova...
Builder.ai Founder Sachin Dev Duggal's Strategic Approach to Create an Innova...
Ramesh Iyer
 
UiPath Test Automation using UiPath Test Suite series, part 4
UiPath Test Automation using UiPath Test Suite series, part 4UiPath Test Automation using UiPath Test Suite series, part 4
UiPath Test Automation using UiPath Test Suite series, part 4
DianaGray10
 
Empowering NextGen Mobility via Large Action Model Infrastructure (LAMI): pav...
Empowering NextGen Mobility via Large Action Model Infrastructure (LAMI): pav...Empowering NextGen Mobility via Large Action Model Infrastructure (LAMI): pav...
Empowering NextGen Mobility via Large Action Model Infrastructure (LAMI): pav...
Thierry Lestable
 
PHP Frameworks: I want to break free (IPC Berlin 2024)
PHP Frameworks: I want to break free (IPC Berlin 2024)PHP Frameworks: I want to break free (IPC Berlin 2024)
PHP Frameworks: I want to break free (IPC Berlin 2024)
Ralf Eggert
 
AI for Every Business: Unlocking Your Product's Universal Potential by VP of ...
AI for Every Business: Unlocking Your Product's Universal Potential by VP of ...AI for Every Business: Unlocking Your Product's Universal Potential by VP of ...
AI for Every Business: Unlocking Your Product's Universal Potential by VP of ...
Product School
 
Slack (or Teams) Automation for Bonterra Impact Management (fka Social Soluti...
Slack (or Teams) Automation for Bonterra Impact Management (fka Social Soluti...Slack (or Teams) Automation for Bonterra Impact Management (fka Social Soluti...
Slack (or Teams) Automation for Bonterra Impact Management (fka Social Soluti...
Jeffrey Haguewood
 
Essentials of Automations: Optimizing FME Workflows with Parameters
Essentials of Automations: Optimizing FME Workflows with ParametersEssentials of Automations: Optimizing FME Workflows with Parameters
Essentials of Automations: Optimizing FME Workflows with Parameters
Safe Software
 
Dev Dives: Train smarter, not harder – active learning and UiPath LLMs for do...
Dev Dives: Train smarter, not harder – active learning and UiPath LLMs for do...Dev Dives: Train smarter, not harder – active learning and UiPath LLMs for do...
Dev Dives: Train smarter, not harder – active learning and UiPath LLMs for do...
UiPathCommunity
 
GDG Cloud Southlake #33: Boule & Rebala: Effective AppSec in SDLC using Deplo...
GDG Cloud Southlake #33: Boule & Rebala: Effective AppSec in SDLC using Deplo...GDG Cloud Southlake #33: Boule & Rebala: Effective AppSec in SDLC using Deplo...
GDG Cloud Southlake #33: Boule & Rebala: Effective AppSec in SDLC using Deplo...
James Anderson
 
How world-class product teams are winning in the AI era by CEO and Founder, P...
How world-class product teams are winning in the AI era by CEO and Founder, P...How world-class product teams are winning in the AI era by CEO and Founder, P...
How world-class product teams are winning in the AI era by CEO and Founder, P...
Product School
 
GenAISummit 2024 May 28 Sri Ambati Keynote: AGI Belongs to The Community in O...
GenAISummit 2024 May 28 Sri Ambati Keynote: AGI Belongs to The Community in O...GenAISummit 2024 May 28 Sri Ambati Keynote: AGI Belongs to The Community in O...
GenAISummit 2024 May 28 Sri Ambati Keynote: AGI Belongs to The Community in O...
Sri Ambati
 
The Art of the Pitch: WordPress Relationships and Sales
The Art of the Pitch: WordPress Relationships and SalesThe Art of the Pitch: WordPress Relationships and Sales
The Art of the Pitch: WordPress Relationships and Sales
Laura Byrne
 
Knowledge engineering: from people to machines and back
Knowledge engineering: from people to machines and backKnowledge engineering: from people to machines and back
Knowledge engineering: from people to machines and back
Elena Simperl
 
FIDO Alliance Osaka Seminar: Passkeys and the Road Ahead.pdf
FIDO Alliance Osaka Seminar: Passkeys and the Road Ahead.pdfFIDO Alliance Osaka Seminar: Passkeys and the Road Ahead.pdf
FIDO Alliance Osaka Seminar: Passkeys and the Road Ahead.pdf
FIDO Alliance
 

Recently uploaded (20)

Epistemic Interaction - tuning interfaces to provide information for AI support
Epistemic Interaction - tuning interfaces to provide information for AI supportEpistemic Interaction - tuning interfaces to provide information for AI support
Epistemic Interaction - tuning interfaces to provide information for AI support
 
Transcript: Selling digital books in 2024: Insights from industry leaders - T...
Transcript: Selling digital books in 2024: Insights from industry leaders - T...Transcript: Selling digital books in 2024: Insights from industry leaders - T...
Transcript: Selling digital books in 2024: Insights from industry leaders - T...
 
JMeter webinar - integration with InfluxDB and Grafana
JMeter webinar - integration with InfluxDB and GrafanaJMeter webinar - integration with InfluxDB and Grafana
JMeter webinar - integration with InfluxDB and Grafana
 
Unsubscribed: Combat Subscription Fatigue With a Membership Mentality by Head...
Unsubscribed: Combat Subscription Fatigue With a Membership Mentality by Head...Unsubscribed: Combat Subscription Fatigue With a Membership Mentality by Head...
Unsubscribed: Combat Subscription Fatigue With a Membership Mentality by Head...
 
Neuro-symbolic is not enough, we need neuro-*semantic*
Neuro-symbolic is not enough, we need neuro-*semantic*Neuro-symbolic is not enough, we need neuro-*semantic*
Neuro-symbolic is not enough, we need neuro-*semantic*
 
FIDO Alliance Osaka Seminar: Overview.pdf
FIDO Alliance Osaka Seminar: Overview.pdfFIDO Alliance Osaka Seminar: Overview.pdf
FIDO Alliance Osaka Seminar: Overview.pdf
 
Builder.ai Founder Sachin Dev Duggal's Strategic Approach to Create an Innova...
Builder.ai Founder Sachin Dev Duggal's Strategic Approach to Create an Innova...Builder.ai Founder Sachin Dev Duggal's Strategic Approach to Create an Innova...
Builder.ai Founder Sachin Dev Duggal's Strategic Approach to Create an Innova...
 
UiPath Test Automation using UiPath Test Suite series, part 4
UiPath Test Automation using UiPath Test Suite series, part 4UiPath Test Automation using UiPath Test Suite series, part 4
UiPath Test Automation using UiPath Test Suite series, part 4
 
Empowering NextGen Mobility via Large Action Model Infrastructure (LAMI): pav...
Empowering NextGen Mobility via Large Action Model Infrastructure (LAMI): pav...Empowering NextGen Mobility via Large Action Model Infrastructure (LAMI): pav...
Empowering NextGen Mobility via Large Action Model Infrastructure (LAMI): pav...
 
PHP Frameworks: I want to break free (IPC Berlin 2024)
PHP Frameworks: I want to break free (IPC Berlin 2024)PHP Frameworks: I want to break free (IPC Berlin 2024)
PHP Frameworks: I want to break free (IPC Berlin 2024)
 
AI for Every Business: Unlocking Your Product's Universal Potential by VP of ...
AI for Every Business: Unlocking Your Product's Universal Potential by VP of ...AI for Every Business: Unlocking Your Product's Universal Potential by VP of ...
AI for Every Business: Unlocking Your Product's Universal Potential by VP of ...
 
Slack (or Teams) Automation for Bonterra Impact Management (fka Social Soluti...
Slack (or Teams) Automation for Bonterra Impact Management (fka Social Soluti...Slack (or Teams) Automation for Bonterra Impact Management (fka Social Soluti...
Slack (or Teams) Automation for Bonterra Impact Management (fka Social Soluti...
 
Essentials of Automations: Optimizing FME Workflows with Parameters
Essentials of Automations: Optimizing FME Workflows with ParametersEssentials of Automations: Optimizing FME Workflows with Parameters
Essentials of Automations: Optimizing FME Workflows with Parameters
 
Dev Dives: Train smarter, not harder – active learning and UiPath LLMs for do...
Dev Dives: Train smarter, not harder – active learning and UiPath LLMs for do...Dev Dives: Train smarter, not harder – active learning and UiPath LLMs for do...
Dev Dives: Train smarter, not harder – active learning and UiPath LLMs for do...
 
GDG Cloud Southlake #33: Boule & Rebala: Effective AppSec in SDLC using Deplo...
GDG Cloud Southlake #33: Boule & Rebala: Effective AppSec in SDLC using Deplo...GDG Cloud Southlake #33: Boule & Rebala: Effective AppSec in SDLC using Deplo...
GDG Cloud Southlake #33: Boule & Rebala: Effective AppSec in SDLC using Deplo...
 
How world-class product teams are winning in the AI era by CEO and Founder, P...
How world-class product teams are winning in the AI era by CEO and Founder, P...How world-class product teams are winning in the AI era by CEO and Founder, P...
How world-class product teams are winning in the AI era by CEO and Founder, P...
 
GenAISummit 2024 May 28 Sri Ambati Keynote: AGI Belongs to The Community in O...
GenAISummit 2024 May 28 Sri Ambati Keynote: AGI Belongs to The Community in O...GenAISummit 2024 May 28 Sri Ambati Keynote: AGI Belongs to The Community in O...
GenAISummit 2024 May 28 Sri Ambati Keynote: AGI Belongs to The Community in O...
 
The Art of the Pitch: WordPress Relationships and Sales
The Art of the Pitch: WordPress Relationships and SalesThe Art of the Pitch: WordPress Relationships and Sales
The Art of the Pitch: WordPress Relationships and Sales
 
Knowledge engineering: from people to machines and back
Knowledge engineering: from people to machines and backKnowledge engineering: from people to machines and back
Knowledge engineering: from people to machines and back
 
FIDO Alliance Osaka Seminar: Passkeys and the Road Ahead.pdf
FIDO Alliance Osaka Seminar: Passkeys and the Road Ahead.pdfFIDO Alliance Osaka Seminar: Passkeys and the Road Ahead.pdf
FIDO Alliance Osaka Seminar: Passkeys and the Road Ahead.pdf
 

4.2 binomial distributions

  • 2. Objectives/Assignment • How to determine if a probability experiment is a binomial experiment • How to find binomial probabilities using the binomial probability table and technology • How to construct a binomial distribution and its graph • How to find the mean, variance and standard deviation of a binomial probability distribution Assignment: pp. 173-175 #1-18 all
  • 3. Binomial Experiments • There are many probability experiments for which the results of each trial can be reduced to two outcomes: success and failure. For instance, when a basketball player attempts a free throw, he or she either makes the basket or does not. Probability experiments such as these are called binomial experiments.
  • 4. Definition • A binomial experiment is a probability experiment that satisfies the following conditions: 1. The experiment is repeated for a fixed number of trials, where each trial is independent of the other trials. 2. There are only two possible outcomes of interest for each trial. The outcomes can be classified as a success (S) or as a failure (F). 3. The probability of a success, P(S), is the same for each trial. 4. The random variable, x, counts the number of successful trials.
  • 5. Notation for Binomial Experiments Symbol Description n The number of times a trial is repeated. p = P(S) The probability of success in a single trial. q = P(F) The probability of failure in a single trial (q = 1 – p) x The random variable represents a count of the number of successes in n trials: x = 0, 1, 2, 3, . . . n.
  • 6. Note: • Here is a simple example of binomial experiment. From a standard deck of cards, you pick a card, note whether it is a club or not, and replace the card. You repeat the experiment 5 times, so n = 5. The outcomes for each trial can be classified in two categories: S = selecting a club and F = selecting another suit. The probabilities of success and failure are: p = P(S) = ¼ and q = P(F) = ¾. The random variable x represents the number of clubs selected in the 5 trials. So, the possible values of the random variable are 0, 1, 2, 3, 4, and 5. Note that x is a discrete random variable because its possible values can be listed.
  • 7. Ex. 1: Binomial Experiments • Decide whether the experiment is a binomial experiment. If it is, specify the values of n, p and q and list the possible values of the random variable, x. If it is not, explain why. 1. A certain surgical procedure has an 85% chance of success. A doctor performs the procedure on eight patients. The random variable represents the number of successful surgeries.
  • 8. Ex. 1: Binomial Experiments Solution: the experiment is a binomial experiment because it satisfies the four conditions of a binomial experiment. In the experiment, each surgery represents one trial. There are eight surgeries, and each surgery is independent of the others. Also, there are only two possible outcomes for each surgery—either the surgery is a success or it is a failure. Finally, the probability of success for each surgery is 0.85. n = 8 p = 0.85 q = 1 – 0.85 = 0.15 x = 0, 1, 2, 3, 4, 5, 6, 7, 8
  • 9. Ex. 1: Binomial Experiments • Decide whether the experiment is a binomial experiment. If it is, specify the values of n, p and q and list the possible values of the random variable, x. If it is not, explain why. 2. A jar contains five red marbles, nine blue marbles and six green marbles. You randomly select three marbles from the jar, without replacement. The random variable represents the number of red marbles.
  • 10. Ex. 1: Binomial Experiments Solution: The experiment is not a binomial experiment because it does not satisfy all four conditions of a binomial experiment. In the experiment, each marble selection represents one trial and selecting a red marble is a success. When selecting the first marble, the probability of success is 5/20. However because the marble is not replaced, the probability is no longer 5/20. So the trials are not independent, and the probability of a success is not the same for each trial.
  • 11. Binomial Probabilities There are several ways to find the probability of x successes in n trials of a binomial experiment. One way is to use the binomial probability formula. Binomial Probability Formula In a binomial experiment, the probability of exactly x successes in n trials is: xnxxnx xn qp xxn n qpCxP −− − == !)!( ! )(
  • 12. Ex. 2 Finding Binomial Probabilities A six sided die is rolled 3 times. Find the probability of rolling exactly one 6. Roll 1 Roll 2 Roll 3 Frequency # of 6’s Probability (1)(1)(1) = 1 3 1/216 (1)(1)(5) = 5 2 5/216 (1)(5)(1) = 5 2 5/216 (1)(5)(5) = 25 1 25/216 (5)(1)(1) = 5 2 5/216 (5)(1)(5) = 25 1 25/216 (5)(5)(1) = 25 1 25/216 (5)(5)(5) = 125 0 125/216 You could use a tree diagram
  • 13. Ex. 2 Finding Binomial Probabilities There are three outcomes that have exactly one six, and each has a probability of 25/216. So, the probability of rolling exactly one six is 3(25/216) 0.347. Another way≈ to answer the question is to use the binomial probability formula. In this binomial experiment, rolling a 6 is a success while rolling any other number is a failure. The values for n, p, q, and x are n = 3, p = 1/6, q = 5/6 and x = 1. The probability of rolling exactly one 6 is: xnxxnx xn qp xxn n qpCxP −− − == !)!( ! )( Or you could use the binomial probability formula
  • 14. Ex. 2 Finding Binomial Probabilities 347.0 72 25 ) 216 25 (3 ) 36 25 )( 6 1 (3 ) 6 5 )( 6 1 (3 ) 6 5 () 6 1 ( !1)!13( !3 )1( 2 131 ≈= = = = − = − P By listing the possible values of x with the corresponding probability of each, you can construct a binomial probability distribution.
  • 15. Ex. 3: Constructing a Binomial Distribution In a survey, American workers and retirees are asked to name their expected sources of retirement income. The results are shown in the graph. Seven workers who participated in the survey are asked whether they expect to rely on social security for retirement income. Create a binomial probability distribution for the number of workers who respond yes. (pg. 167)
  • 16. Solution From the graph, you can see that 36% of working Americans expect to rely on social security for retirement income. So, p = 0.36 and q = 0.64. Because n = 7, the possible values for x are 0, 1, 2, 3, 4, 5, 6 and 7. 044.0)64.0()36.0()0( 70 07 ≈= CP 173.0)64.0()36.0()1( 61 17 ≈= CP 292.0)64.0()36.0()2( 52 27 ≈= CP 274.0)64.0()36.0()3( 43 37 ≈= CP 154.0)64.0()36.0()4( 34 47 ≈= CP 052.0)64.0()36.0()5( 25 57 ≈= CP 010.0)64.0()36.0()6( 16 67 ≈= CP 001.0)64.0()36.0()7( 07 77 ≈= CP x P(x) 0 0.044 1 0.173 2 0.292 3 0.274 4 0.154 5 0.052 6 0.010 7 0.001 ∑P(x) = 1 Notice all the probabilities are between 0 and 1 and that the sum of the probabilities is 1.
  • 17. Note: • Finding binomial probabilities with the binomial formula can be a tedious and mistake prone process. To make this process easier, you can use a binomial probability. Table 2 in Appendix B lists the binomial probability for selected values of n and p.
  • 18. Ex. 4: Finding a Binomial Probability Using a Table • Fifty percent of working adults spend less than 20 minutes commuting to their jobs. If you randomly select six working adults, what is the probability that exactly three of them spend less than 20 minutes commuting to work? Use a table to find the probability. Solution: A portion of Table 2 is shown here. Using the distribution for n = 6 and p = 0.5, you can find the probability that x = 3, as shown by the highlighted areas in the table.
  • 19. Ex. 4: Finding a Binomial Probability Using a Table The probability if you look at n = 6 and x = 3 over to 0.50 is .312. So the probability that exactly 3 out of the six workers spend less than 20 minutes commuting to work is 0.312 Ex. 5 Using Technology to find a Binomial Probability An even more efficient way to find binomial probability is to use a calculator or a computer. For instance, you can find binomial probabilities by using your TI-83, TI-84 or Excel on the computer. Go to 2nd VARS on your calculator. Arrow down to binompdf which is choice A. Click Enter. This will give the command. Enter 100, .58, 65. The comma button is located above the 7 on your calculator. You should get .0299216472. Please practice this now because you will need to know it for the Chapter 4 test and for homework.
  • 20. Ex. 6: Finding Binomial Probabilities • A survey indicates that 41% of American women consider reading as their favorite leisure time activity. You randomly select four women and ask them if reading is their favorite leisure-time activity. Find the probability that (1) exactly two of them respond yes, (2) at least two of them respond yes, and (3) fewer than two of them respond yes.
  • 21. Ex. 6: Finding Binomial Probabilities • #1--Using n = 4, p = 0.41, q = 0.59 and x =2, the probability that exactly two women will respond yes is: 35109366.)3481)(.1681(.6 )3481)(.1681(. 4 24 )59.0()41.0( !2)!24( !4 )59.0()41.0()2( 242 242 24 = = = − == − − CP Calculator or look it up on pg. A10
  • 22. Ex. 6: Finding Binomial Probabilities • #2--To find the probability that at least two women will respond yes, you can find the sum of P(2), P(3), and P(4). Using n = 4, p = 0.41, q = 0.59 and x =2, the probability that at least two women will respond yes is: 028258.0)59.0()41.0()4( 162653.0)59.0()41.0()3( 351093.)59.0()41.0()2( 444 44 343 34 242 24 == == == − − − CP CP CP 542.0 028258162653.351093. )4()3()2()2( ≈ ++= ++=≥ PPPxP Calculator or look it up on pg. A10
  • 23. Ex. 6: Finding Binomial Probabilities • #3--To find the probability that fewer than two women will respond yes, you can find the sum of P(0) and P(1). Using n = 4, p = 0.41, q = 0.59 and x =2, the probability that at least two women will respond yes is: 336822.0)59.0()41.0()1( 121174.0)59.0()41.0()0( 141 14 040 04 == == − − CP CP 458.0 336822.121174.. )1()0()2( ≈ += +=< PPxP Calculator or look it up on pg. A10
  • 24. Ex. 7: Constructing and Graphing a Binomial Distribution • 65% of American households subscribe to cable TV. You randomly select six households and ask each if they subscribe to cable TV. Construct a probability distribution for the random variable, x. Then graph the distribution. Calculator or look it up on pg. A10 075.0)35.0()65.0()6( 244.0)35.0()65.0()5( 328.0)35.0()65.0()4( 235.0)35.0()65.0()3( 095.0)35.0()65.0()2( 020.0)35.0()65.0()1( 002.0)35.0()65.0()0( 666 66 565 56 464 46 363 36 262 26 161 16 060 06 == == == == == == == − − − − − − − CP CP CP CP CP CP CP
  • 25. Ex. 7: Constructing and Graphing a Binomial Distribution • 65% of American households subscribe to cable TV. You randomly select six households and ask each if they subscribe to cable TV. Construct a probability distribution for the random variable, x. Then graph the distribution. Because each probability is a relative frequency, you can graph the probability using a relative frequency histogram as shown on the next slide. x 0 1 2 3 4 5 6 P(x) 0.002 0.020 0.095 0.235 0.328 0.244 0.075
  • 26. Ex. 7: Constructing and Graphing a Binomial Distribution • Then graph the distribution. x 0 1 2 3 4 5 6 P(x) 0.002 0.020 0.095 0.235 0.328 0.244 0.075 0 0.05 0.1 0.15 0.2 0.25 0.3 0.35 0 1 2 3 4 5 6 P(x) R e l a t i v e F r e q u e n c y Households NOTE: that the histogram is skewed left. The graph of a binomial distribution with p > .05 is skewed left, while the graph of a binomial distribution with p < .05 is skewed right. The graph of a binomial distribution with p = .05 is symmetric.
  • 27. Mean, Variance and Standard Deviation • Although you can use the formulas learned in 4.1 for mean, variance and standard deviation of a probability distribution, the properties of a binomial distribution enable you to use much simpler formulas. They are on the next slide.
  • 28. Population Parameters of a Binomial Distribution Mean: µ = np Variance: σ2 = npq Standard Deviation: σ = √npq
  • 29. Ex. 8: Finding Mean, Variance and Standard Deviation • In Pittsburgh, 57% of the days in a year are cloudy. Find the mean, variance, and standard deviation for the number of cloudy days during the month of June. What can you conclude? Solution: There are 30 days in June. Using n=30, p = 0.57, and q = 0.43, you can find the mean variance and standard deviation as shown. Mean: µ = np = 30(0.57) = 17.1 Variance: σ2 = npq = 30(0.57)(0.43) = 7.353 Standard Deviation: σ = √npq = √7.353 2.71≈