1. ISSN: 2317-0840
A cophenetic correlation coefficient for the modified Tocher’s method
Anderson R. Silva1†, Carlos T. S. Dias2, Paulo R. Cecon3, Jaqueline A. Raminelli1, M´ario
Puiatti4
1Ph.D stundet in Statistics and Agronomic Experimentation, ESALQ/University of S˜ao Paulo, Piracicaba, SP,
Brazil.
2LCE - ESALQ/University of S˜ao Paulo, Piracicaba, SP, Brazil.
3DET/University of Vic¸osa, Vic¸osa, MG, Brazil.
4DFT/University of Vic¸osa, Vic¸osa, MG, Brazil.
Abstract: The cophenetic correlation coefficient has usually been taken as a measure of clustering con-
sistence. However, its use has been restricted for hierarchical methods, at which is possible to obtain a
cophenetic matrix. Nevertheless, Silva and Dias (2013) have proposed a simple algorithm to compute
the cophenetic matrix for the original Tocher’s method. Following the premise at which cophenetic va-
lues can be obtained even by ordination methods, the goal of this work is to extend that algorithm for
computing the cophenetic matrix in cluster analysis performed via modified Tocher’s method and then
to estimate the cophenetic correlation. To illustrate the procedure, we used two measure of distance: the
squared generalized Mahalanobis and the Euclidean distance, based on six morphological characters
of garlic cultivars. We performed comparisons of outcomes obtained with two hierarchical methods:
Ward’s algorithm and the average linkage. As expected, most of our results are according with those
found by Silva and Dias (2013). The clustering consistence of agglomerative methods and the original
and modified Tocher’s can be evaluated by using a criterion in common, the correlation between original
and cophenetic distances.
Keywords: cluster analysis; clustering consistence; optimization methods.
Resumo: A correlac¸˜ao cofen´etica ´e comumente tomada como uma medida da consistˆencia do padr˜ao de
agrupamento. Entretanto, seu uso tem sido restrito aos m´etodos hier´arquicos, dos quais se obt´em uma
matriz cofen´etica. N˜ao obstante, Silva e Dias (2013) propuseram um algoritmo simples para computar
a matriz cofen´etica para o m´etodo original de Tocher. Seguindo a premissa na qual valores cofen´eticos
podem ser obtidos mesmo por m´etodos de ordenac¸˜ao, o objetivo deste trabalho ´e estender esse algo-
ritmo de modo `a obter uma matriz cofen´etica a partir de agrupamento realizado via m´etodo de Tocher
modificado, permitindo assim o c´alculo da correlac¸˜ao cofen´etica. Para ilustrar a obtenc¸˜ao da matriz co-
fen´etica proposta foram utilizadas duas matrizes de dissimilaridade, obtidas com a distˆancia quadr´atica
generalizada de Mahalanobis e com a distˆancia euclidiana entre dezessete cultivares de alho, com base
em seis caracteres morfol´ogicos. Comparac¸˜oes de resultados obtidos com dois m´etodos hier´arquicos
(Ward e ligac¸˜ao m´edia) foram feitas. Como esperado, os resultados obtidos s˜ao concordantes com os
encontrados por Silva e Dias (2013). Comparac¸˜oes entre agrupamentos feitos com m´etodos hier´arquicos
aglomerativos, com o m´etodo de Tocher e Tocher modificado podem ser realizadas utilizando um crit´erio
em comum, a correlac¸˜ao entre distˆancias originais e cofen´eticas.
Palavras-chave: an´alise de agrupamento; consistˆencia do agrupamento; m´etodos de otimizac¸˜ao.
†Corresponding author: ar.silva@usp.br.
Sigmae, Alfenas, v.2, n.3, p. 85-89. 2013.
2. Silva et al. (2013) 86
Introduction
The Tocher optimization clustering method (RAO, 1952) allows one to stablish mutually clusters
by using only one clustering criterion, which minimizes the average distance within and maximizes the
average distance between clusters. Vasconcelos et al. (2007) have proposed modifying the original
method, making it sequential (modified Tocher) instead of simultaneous. This new procedure does not
have only one clustering criterion. Considering the original one, the authors stated that the modified
method has the following advantage: the objects already clustered do not influence the clustering process
anymore.
Evaluations of clustering outcomes obtained with Tocher and modified Tocher have been done based
on the outcomes of other clustering methods, including ordination techniques that, sometimes, became
impratical due to the large number of variables and objects. On the other hand, in hierarchical clustering
algorithms, the correlation between the elements of the original distance matrix and those from the
matrix obtained by the phenogram, the cophenetic matrix, is usually taken as an evaluation measure of
the clustering consistence. Such a measure is known as the cophenetic correlation coefficient, proposed
by Sokal and Rohlf (1962) to be used as a representativeness measurement of the distance matrix by the
corresponding clustering.
Nevertheless, Silva and Dias (2013) have proposed a simple algorithm to compute the cophenetic
matrix for the simultaneous (original) Tocher’s method. Their approach is based on the average distances
within and between the clusters.
Following the Sneath and Sokal (1973) premise at which cophenetic values can be obtained even
by ordination methods, the goals of this work are twofold: a) to determine the cophenetic matrix from
clustering performed via modified Tocher’s method based on the approach presented by Silva and Dias
(2013) and b) to estimate the cophenetic correlation coefficient.
Methods
The modified Tocher’s method operates over a matrix of distances between objects. To illustrate the
obtation of the proposed cophenetic matrix we used two distance matrices, determined with the squared
generalized Mahalanobis and with the Euclidean distances between 17 garlic cultivars, based on six
morphological characters, in a study of genetic divergence carried out by Silva (2012).
We applied the modified Tocher’s method to those distance matrices and the clustering outcomes
(Table 1) were also used for determining the corresponding cophenetic matrices.
Tabela 1: Clusters of 17 garlic cultivars.
Cluster Cultivar(a) Cultivar(b)
1 8, 9, 12, 4, 10, 2, 7, 15 8, 9, 4, 10, 2, 12, 11
2 1, 6, 14 7, 15, 17, 6, 1, 14
3 11, 13 3, 5, 16
4 3, 5, 16 13
5 17 –
Clusters formed based on (a) Mahalanobis distances and (b) Euclidean distances.
Our propose for the modified Tocher’s method is to determine the cophenetic matrix from the average
distances within and between clusters. Thus, the average distance within the k-th cluster is calculated by
averaging the pairwise distances between objects into this cluster, according to the expression (eq. 1):
dk =
2
nk(nk −1)
nk−1
∑
i=1
nk
∑
j>i
di,j, ∀i = j, nk ≥ 2, (1)
where nk is the number of objects into the k-th cluster, di,j is the distance between the i-th and the j-th
objects located at the k-th cluster. Obviously nk = 1 ⇒ dk = 0.
Sigmae, Alfenas, v.2, n.3, p. 85-89. 2013.
3. Silva et al. (2013) 87
The average distance between the k-th and the k -th clusters is calculated by averaging all crossed
pairs of distances between objects of both clusters involved, according to the expression (eq. 2):
dk,k =
1
nk ×nk
nk
∑
i=1
nk
∑
j=1
di,j, ∀k = k , (2)
where nk and nk are, respectively, the number of objects into the k-th and k -th cluster, di,j is the distance
between the i-th object into the k-th cluster and the j-th object into the k -th cluster. Obviously, nk =
nk = 1 ⇒ dk,k = di,j.
For illustrating, we draw cluster diagrams to represent the relationships of the average distances
within and between clustersi (Figure 1). For example, based on Mahalanobis distance, the cophenetic
distance between cultivars 8 and 9 is simply the average distance within cluster 1, i.e., d8,9 = 1,75. On the
other hand, the cophenetic distance between cultivars 8 and 11 is the average distance between clusters
1 and 3, i.e., d8,11 = 3,26.
Figura 1: Diagrams of cluster obtaned by the modified Tocher’s method representing the relationship of
average distances within and between clusters based on (a) the squared generalized Mahalanobis distance
and (b) the Euclidean distance.
After building the cophenetic matrices, we calculated the correlations between the elements of each
original distance matrix and its respective elements of the respective cophenetic matrix.
For comparing results, we also have peformed hirarchical clustering with the following methods:
Ward’s algorithm and average linkage (UPGMA). The cophenetic correlation for these methods were
calculated too.
The analyses were performed by using the softwares Genes version 2009.7.0 (CRUZ, 2006) and R
version 3.0.2 (R CORE TEAM, 2013). The hierarchical clustering were performed with the function
hclust() and the respective cophenetic matrices with the function cophenetic(). The modified Tocher
clustering were performed with the module Multivariate analysis of the software Genes and the proposed
cophenetic matrix was computed by using the function coph.tocher() of the package biotools version 1.1
(SILVA, 2014).
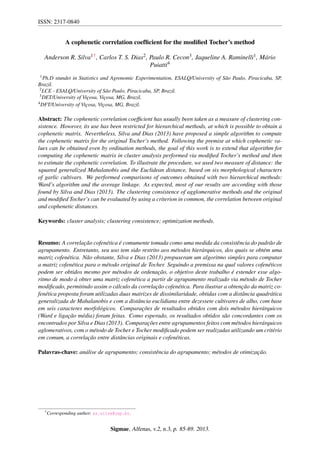
Results and discussion
Figure 2 shows that the cophenetic matrix obtained with the modified Tocher’s method has synthe-
sized reliably the original distances. Besides that, the cophenetic distances tend to keep the original
iThe R package biotools (Silva, 2014) contains a function called distClust() that can be used to compute the average
distances within and between clusters.
Sigmae, Alfenas, v.2, n.3, p. 85-89. 2013.
4. Silva et al. (2013) 88
distance scale, once they use the average values of the original distances.
q
q
q
q
q
qq q q
q
q
q
q
q
q
q
q
q
q
q
qqqq
q
q
q
q
q
q
q
q
q
q
qq qq
q
q
q
q
q
q
q
q
q
qqqq
q
q
q
q
q
q
q
q
qq qq
q
q
q
q
q
q
q
q q qq
q
q
q
q
q
q
q
qqq
q
q
q
q
q
q
q
q q
q
q
q
q
q
q
q
q
q
q
q
q
q
q
q
q
q
q
q
q
q
q
q
q
q
q
q
q
q
q
q
q
q
q
q
q
q
q
q
q
q
q
q
0 2 4 6 8 10 12
2
4
6
8
Modified Tocher (r = 0.88)
Original distances
Copheneticdistances
q
q
q
q
q
qq q q qq q
q
q
q
q
q
q
qq
q
qq
q
q
q
q
qq qq q
q
q
qq qqq q q
q qq q
qq
q
qq
q
q
q
q
qq qq
q
qq qqq q q
q qq q
q q qq qq q
q
q
q
q
qq
q
q
q
q
qq qq
q
q
q
q
q
qq qq
q
q
q
q
qq qq
q
q
q
qq qq
q
q
qq qq
q
qq qq qq qq
q
q
q q
q
q
0 2 4 6 8 10 12
0
5
10
15
20
25
Ward (r = 0.59)
Original distancesCopheneticdistances
q
q
q
q
q
qq q q qq q
q
q
q
q q
q
qq
q
qq
q
q
q
q
q
q
q
q
q
q
q
qq qqq q q
q
q
q
q qq
q
qq
q
q
q
q
q
q
q
q
q
qq qqq q q
q
q
q
qq q qq qq q
q
q
q
q
qqq
q
q
q
q
q
q
q
q
q
q
q
q
q
q
q
q
q
q
q
q
q
q
q
q
q
q
q
q
q
q
q
q
q
q
q
q
qq
q
q
q
q
q
q
q
q
q
q
q q
q
q
0 2 4 6 8 10 12
0
1
2
3
4
5
6
Average linkage (r = 0.73)
Original distances
Copheneticdistances
q
q
q
q
q q
qqq qq
q
qq
q
q
q
q
q qq
qqq qq
q
q qq qq
q
qq
qqqq q
q
q q
q
q
q qq
qqq qq
q
qq qq
qq
qqqq q
q
q q
q
q
q
qqq qq
q
qq
q
q
qqq qq
q
qq
q
q
q q qq
q
qq qq
q qq
q
qq qq
qq
q
qq qq
q
q
q qq q
q
q q q q
q q
q
q
q
q
q
q
q
q
1 2 3 4 5 6 7
2
3
4
5
6
Modified Tocher (r = 0.79)
Original distances
Copheneticdistances
q
q
q
q
q q
qqq qq q
q
q
q
q
q
q
q
qq
qq
q
qq q
q
q
q
q
q
q
qq
qqqq q q
q
q
q
q
q
qq
qq
q
qq q
q
q
q
q qq
qqqq qq
q
q
q
q
q
qqq qq qq
q
q
q
qqq qq qq
q
q
q
q
q
qq q
q
q
q
q
q
qq q
q
q
q
q
qq q
q
q
q
q
q
q
q
q
q
q
q
q
q
q
q
q
q
q
qq
q
q q
q
q
1 2 3 4 5 6 7
2
4
6
8
10
12
Ward (r = 0.63)
Original distances
Copheneticdistances
q qq q
q q
qqq qq q
q
q
q
q
q
q
q
qq
qq
q
qq
q
q q
q
q
q
q
qq
qqqq q q
q q
q
q
q
qq
qq
q
qq
q
qq
q
q qq
qqqq qq
q q
q
q
q
qqq qq q
q
q
q
q
qqq qq q
q
q
q
q
q
q qq
q
qq
q
q
q qq
q
qq
q
q
qq
q
qq
q
q
q
q
q q
q
q
q
q q
q
qq q
q
q
q
q
q
q
q
q
1 2 3 4 5 6 7
1.0
1.5
2.0
2.5
3.0
3.5
4.0
Averege linkage (r = 0.72)
Original distances
Copheneticdistances
(a)
(b)
Figura 2: Shepard diagrams for association of original and cophenetic distances based on (a) the squared
generalized Mahalanobis distance and (b) the Euclidean distance.
Cophenetic correlations obtained by the Tocher (0.88 with Mahalanobis distances and 0.79 with
Euclidean distances) were, even, higher than those obtained by the average linkage method (0.73 with
Mahalanobis and 0.72 with Euclidean), even though the numbers of actual distances involved on the
calculation of the proposed matrix (15 with Mahalanobis and 10 with Euclidean) are less than those used
on the hierarchical methods (16 for both).
Ward’s algorithm has presented weak linear relationship, which is an expected result since this
method itself tends to show high values for the last entities merge levels, and the Pearson’s coeffici-
ent is sensitive to outliers.
Conclusions
Most of our results are according with those found by Silva and Dias (2013), and the main conclusi-
ons are:
1. The construction of the cophenetic matrix for the modified Tocher’s method depends directly on
the number of groups.
2. Comparisons between clustering done with agglomerative hierarchical methods, Tocher and mo-
dified Tocher can be performed by using a single criterion: the correlation between cophenetic and
original distances.
3. The proposed cophenetic matrix can be computed by computational algorithms using the clustering
outcome of the modified Tocher’s method and the matrix of cluster average distances.
Sigmae, Alfenas, v.2, n.3, p. 85-89. 2013.
5. Silva et al. (2013) 89
Acknowledgements
To Coordenac¸˜ao de Aperfeic¸oamento de Pessoal de N´ıvel Superior (CAPES, Brazil) for granting the
scholarship for the first author.
References
CRUZ, C.D. Programa Genes: Biometria. Vic¸osa: Editora UFV, 2006. 382p.
R CORE TEAM. R: A language and environment for statistical computing. R Foundation for Statistical
Computing, Vienna, Austria. 2013. ISBN 3-900051-07-0, URL http://www.R-project.org/.
RAO, R.C. Advanced statistical methods in biometric research. New York: John Wiley and Sons, 1952.
390p.
SILVA, A.R. M´etodos de agrupamento: avaliac¸˜ao e aplicac¸˜ao ao estudo de divergˆencia gen´etica em
acessos de alho. 2012. 67p. Dissertac¸˜ao (Mestrado em Estat´ıstica Aplicada e Biometria), Universidade
Federal de Vic¸osa, Vic¸osa, 2012.
SILVA, A.R. biotools: Tools for Biometry and Applied Statistics in Agricultural Science. R package
version 1.1. 2014. URL http://CRAN.R-project.org/package=biotools.
SILVA, A.R.; DIAS, C.T.S. A cophenetic correlation coefficient for Tocher’s method. Pesquisa
Agropecu´aria Brasileira, v.48, n.6, p.589-596, 2013.
SNEATH, P.H.A.; SOKAL, R.R. Numerical taxonomy: the principles and practice of numerical
classification. San Francisco: W.H. Freeman and Company, 1973. 573p.
SOKAL, R.R.; ROHLF, F.J. The comparison of dendrograms by objective methods. Taxon, v.11, n.2,
p.33-40, 1962.
VASCONCELOS, E.S.; CRUZ, C.D.; BHERING, L.L.; RESENDE J ´UNIOR, M.F.R. M´etodo
alternativo para an´alise de agrupamento. Pesquisa Agropecu´aria Brasileira, v.42, n.10, p.1421-1428,
2007.
Sigmae, Alfenas, v.2, n.3, p. 85-89. 2013.