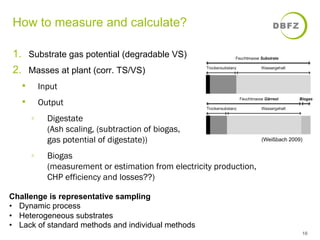
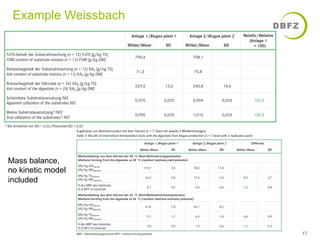
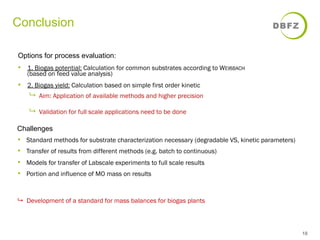
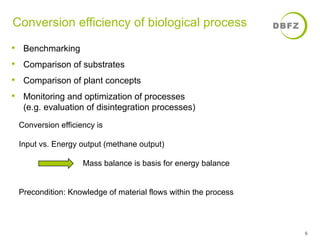
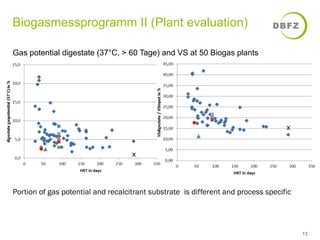
This document discusses methods for measuring the efficiency of biogas production. It presents data on the energy balance of a biogas plant, showing inputs, outputs, and losses at each stage of the process. Mass balance is identified as the basis for calculating conversion efficiency. Challenges include a lack of standardized methods for characterizing substrates and determining biogas potential. The document concludes that developing standard methods and validating approaches for full-scale applications would advance the evaluation of biogas process efficiency.

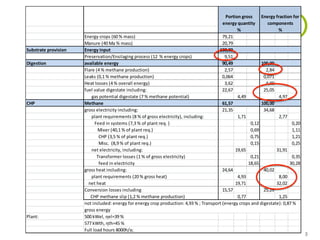
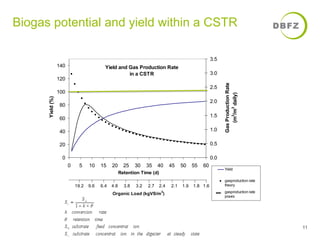
![Calculation of Biogas potential
Calculation of degradable VS according to WEIßBACH
9
Example corn silage (Average of samples at DBFZ)
Ash [g/kgTS] NfE [g/kgTS] Fiber [g/kgTS] Protein [g/kgTS] Lipids [g/kgTS]
44 621 226 79 30
Standardized digestion tests considering metabolic excreta
FoTS = 1000 − Ash − 16 − 0 − ( 0,47 · Fiber + 0,00104 · Fiber² )
Non degradable Carbohydrates (Function of fiber)
Non degradable Lipids (constant)
Non degradable proteiin(constant)
FoTS = 984 − Ash − ( 0,47 · Fiber + 0,00104 · Fiber² ) = 780 [g/kgTS]
Calculation of Biogas potential according to WEIßBACH
Stoichiometric calculation considering 5 % MO Biomass
Biogas = 780 ∙ 800/1000 = 624 [l/kgTS] Methan = 780 ∙ 420/1000 = 327,6 [l/
Gasproduction coefficient fkorg cTorSn] s ilage [l/kg FoTS]](https://image.slidesharecdn.com/3-141007082743-conversion-gate02/85/Efficiency-of-biogas-production-Jan-Liebetrau-9-320.jpg)
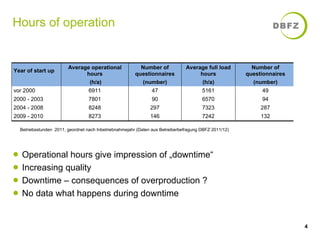
![Evaluation disintegration processes
12
§ Degradation of stillage proteins
§ Two desintegration effects: a) rate increase;
b) increase of biogas potential TS (Enzym B = Effekt a+10%b)
Degree of degradation (%)
[Mauky, 2011]
Increase of gas production(%)
Retention time](https://image.slidesharecdn.com/3-141007082743-conversion-gate02/85/Efficiency-of-biogas-production-Jan-Liebetrau-12-320.jpg)
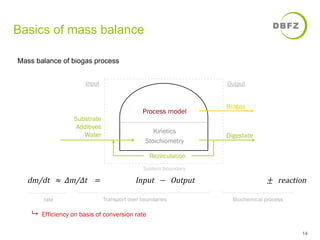
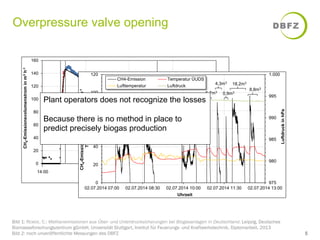
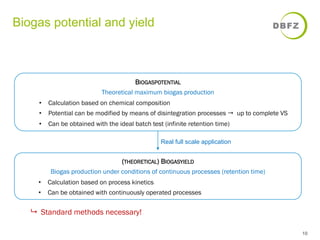
![Mass balance
15
Biogas plant (500 kWel) without recirculation
Fermenter BHKW
k 0.132 [1/d] ηel 38 [%]
Maissilage HRT 75.4 [d] Biogas
ṁS 31.5 [t/d] Uf oTS 90.9 [%] ṁB 7.99 [t/d] PFeu 1315 [kW]
TS 33.47 [% FM]̇VB 6085 [m³ i.N./d] Pel 500 [kWel]
oTS 95.6 [% TS] cCH4 52 [%]
foTS 78 [% TS] Gärrest cCO2 48 [%]
ṁW 20.96 [t/d] ṁG 23.51 [t/d] ρB 1.314 [g/l]
ṁTS 10.54 [t/d] TSG 13.07 [% GR] H 9.97 [kWh/m³]
ṁoTS 10.08 [t/d] foTSG 24.49 [% TSG]
ṁf oTS 8.22 [t/d] ṁW,G 20.43 [t/d]
YB/f oTS 740 [m³ i.N./t foTS] ṁTS,G 3.07 [t/d]
YB/oTS 604 [m³ i.N./t oTS] ṁf oTS,G 0.75 [t/d]
●
Allgemeine
Vorgaben
Inputcharakteris ierung
und
Gas zusammensetzung ●
Vorgabe
Variante
B
Elektris che
BHKW-‐Leistung
Berechnung unter Berücksichtigung des stöchiometrischen Wassereinbaus und unter Vernachlässigung des Biomasseaufbaus
●
Vorgabe
Variante
A
Spezifis cher
Biogasertrag
des
Subs trats
bzw.
der
Anlage ●
Vorgabe
Variante
C
Reaktionskinetik
1.
Ordnung
und
HRT
9 Variation of methods for validation dependent on available data](https://image.slidesharecdn.com/3-141007082743-conversion-gate02/85/Efficiency-of-biogas-production-Jan-Liebetrau-15-320.jpg)