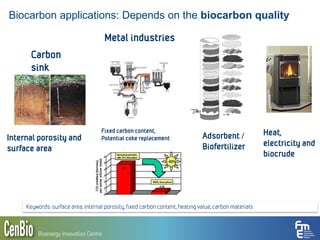
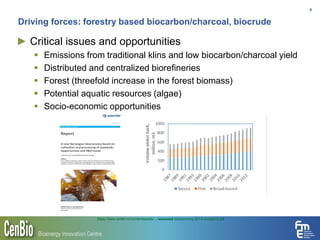
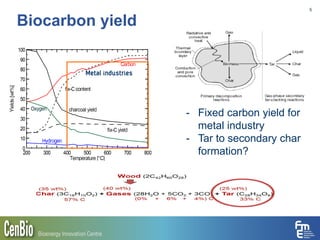
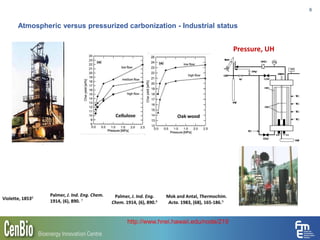
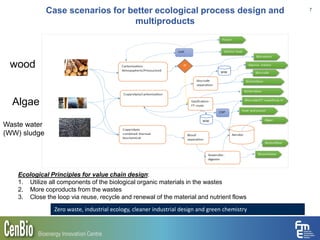
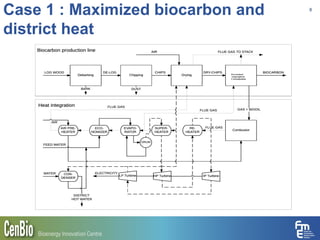
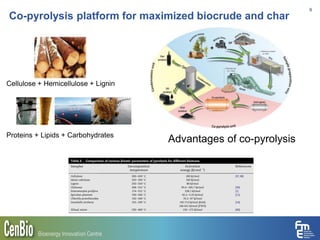
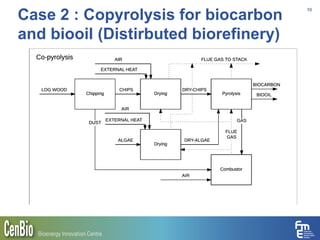
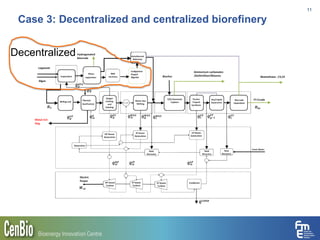
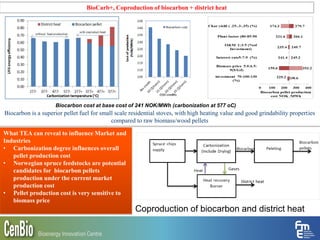
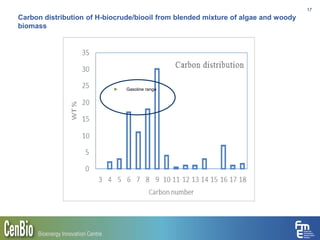
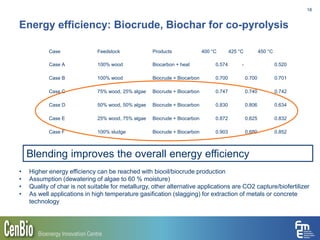
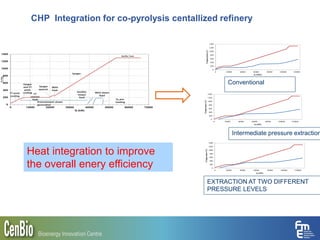
1
Bio-carbonization process integration for high quality energy
carriers: charcoal, biomethane, biocrude, and biofertilizer
Rajesh S. Kempegowda a, Øyvind Skreiberg a, Khanh-Quang Tran b
, Pagandai V. Pannir Selvam c
aSINTEF Energy Research, Trondheim, Norway
bDepartment of Energy & Process Engineering, NTNU, Trondheim, Norway
cGPEC, Universidade Federal do Rio Grande do Norte - UFRN, Caixa Postal 1524 –
Campus Universitário Lagoa Nova, CEP 59078-900 | Natal - RN - Brasil
Corresponding author: rajesh.kempegowda@sintef.no
Historical biocarbon production processes
(atmospheric)
2
►10 to 12 days
►Tar and fumes emissions
►Still practiced in Brazil,
Thailand, Africa
- Indirect or direct heating mode
- In some cases a portion of the
biomass is burnt to sustain the
carbonization temperature
7 to 8 days
World charcoal consumption: 50 million tonnes, at 15 % yield of charcoal, rough estimation:
1 billion m3 wood per year
Need sustainable best practices and technology integration
Biocarbon applications: Depends on the biocarbon quality
3
Keywords: surface area, internal porosity, fixed carbon content, heating value, carbon materials
Internal porosity and
surface area
Fixed carbon content,
Potential coke replacement
Carbon
sink
Metal industries
Adsorbent /
Biofertilizer
Heat,
electricity and
biocrude
►Critical issues and opportunities
 Emissions from traditional klins and low biocarbon/charcoal yield
 Distributed and centralized biorefineries
 Forest (threefold increase in the forest biomass)
 Potential aquatic resources (algae)
 Socio-economic opportunities
4
Driving forces: forestry based biocarbon/charcoal, biocrude
https://www.sintef.no/contentassets/.../seaweed-bioeconomy-2014-revised-2.pdf
Biocarbon yield
5
- Fixed carbon yield for
metal industry
- Tar to secondary char
formation?
Metal industries
Atmospheric versus pressurized carbonization - Industrial status
6
http://www.hnei.hawaii.edu/node/219
Case scenarios for better ecological process design and
multiproducts
7
Ecological Principles for value chain design:
1. Utilize all components of the biological organic materials in the wastes
2. More coproducts from the wastes
3. Close the loop via reuse, recycle and renewal of the material and nutrient flows
wood
Algae
Waste water
(WW) sludge
Zero waste, industrial ecology, cleaner industrial design and green chemistry
Case 1 : Maximized biocarbon and
district heat
8
Co-pyrolysis platform for maximized biocrude and char
9
Advantages of co-pyrolysisProteins + Lipids + Carbohydrates
Cellulose + Hemicellulose + Lignin
Case 2 : Copyrolysis for biocarbon
and biooil (Distirbuted biorefinery)
10
Case 3: Decentralized and centralized biorefinery
11
Decentralized
Approach 12
• Aspen Plus process design and
modelling
• SuperPro (NTNU-UFRN Brazil)
• Value chain alternatives
Empirical modelling
for sub equipments
User defined Fortran
functions and calculators,
data validations with
industrial datas
Customized
Cost modelling, Cost
functions,
CAPEX and OPEX,
Economic viability
(IRR,NPV),
Risk analysis
References
1. Kempegowda, R. S., Ø. Skreiberg and K.-Q. Tran (2012). "Cost modeling approach and economic analysis of biomass gasification integrated solid oxide fuel cell systems." Journal of
Renewable and Sustainable Energy 4(4): 043109.
2. Kempegowda, R. S., G. del Alamo, D. Berstad, M. Bugge, B. Matas Güell and K.-Q. Tran (2015). "CHP-Integrated Fischer-Tropsch Biocrude Production under Norwegian
Conditions: Techno-Economic Analysis." Energy & Fuels 29(2): 808-822.
3. Kempegowda, R. S., P. V. Pannir Selvam, Ø. Skreiberg and K.-Q. Tran (2012). "Process synthesis and economics of combined biomethanol and CHP energy production derived
from biomass wastes." Journal of Chemical Technology & Biotechnology 87(7): 897-902.
Empirical model development: data gathering (patents and literatures for
atmospheric and pressurized carbonization/pyrolysis processes)
13
Adopted from Di Blasi, C., Combustion and gasification rates of lignocellulosic chars. Progress in Energy and Combustion Science, 2009. 35(2): p. 121-140
Antal and others
Algae
Woody
biomass
Key results: Case 1-Maximized biocarbon efficiency
14
Torrefaction
Cofiring
Carbonization
Metal industry
- Pyrolysis operating conditions in the reactor (heating rate, particle size, temperature, pressure,
biomass species)
- Different grade biocarbon for bioenergy and metal industry
- Needs different operating conditions
T, P effect, secondary char
formation, lower reactivity for
carbonization
T effect,
Keyresults : District heating efficiency with influence of moisture content
15
Feedstock moisture content have a significant influence on
district heat production
BioCarb+, Coproduction of biocarbon + district heat
What TEA can reveal to influence Market and
Industries
• Carbonization degree influences overall
pellet production cost
• Norwegian spruce feedstocks are potential
candidates for biocarbon pellets
production under the current market
production cost
• Pellet production cost is very sensitive to
biomass price
Biocarbon is a superior pellet fuel for small scale residential stoves, with high heating value and good grindability properties
compared to raw biomass/wood pellets
Biocarbon cost at base cost of 241 NOK/MWh (carbonization at 577 oC)
Coproduction of biocarbon and district heat
Carbon distribution of H-biocrude/biooil from blended mixture of algae and woody
biomass
17
► Gasoline range
Energy efficiency: Biocrude, Biochar for co-pyrolysis
18
Case Feedstock Products 400 °C 425 °C 450 °C
Case A 100% wood Biocarbon + heat 0.574 - 0.520
Case B 100% wood Biocrude + Biocarbon 0.700 0.700 0.701
Case C 75% wood, 25% algae Biocrude + Biocarbon 0.747 0.740 0.742
Case D 50% wood, 50% algae Biocrude + Biocarbon 0.830 0.806 0.634
Case E 25% wood, 75% algae Biocrude + Biocarbon 0.872 0.625 0.832
Case F 100% sludge Biocrude + Biocarbon 0.903 0.680 0.852
• Higher energy efficiency can be reached with biooil/biocrude production
• Assumption (dewatering of algae to 60 % moisture)
• Quality of char is not suitable for metallurgy, other alternative applications are CO2 capture/biofertilizer
• As well applications in high temperature gasification (slagging) for extraction of metals or concrete
technology
Blending improves the overall energy efficiency
CHP Integration for co-pyrolysis centallized refinery
Figure 4(a) Option A
Figure 4(b) Option B
Figure 4(c) Option C
0
200
400
600
800
1000
1200
1400
0 20000 40000 60000 80000 100000 120000
Temperature(C)
Q (MW)
0
200
400
600
800
1000
1200
1400
0 20000 40000 60000 80000 100000 120000
Temperature(C)
Q (kW)
0
200
400
600
800
1000
1200
1400
0 20000 40000 60000 80000 100000 120000
Temperature(C)
Q (kW)
Conventional
Intermediate pressure extraction
EXTRACTION AT TWO DIFFERENT
PRESSURE LEVELS
Heat integration to improve
the overall enery efficiency
Plant specific cost for centralized refinery
20
No co-processing with CHP
Co-processing without combined
cyle power plant
CHP-Integrated Fischer-Tropsch Biocrude Production under Norwegian Conditions: Techno-
Economic Analysis Rajesh S Kempegowda, Gonzalo del Alamo, David Berstad, Mette Bugge, Berta
Matas Güell, and Khanh-Quang Tran Energy & Fuels 2015 29 (2), 808-822
DOI: 10.1021/ef502326g
With modified PFD
Modified to reduce the overall specific cost (thermal input basis)
Techno-economic viability for Gasification-FT synthesis route
(centralized refinery)
21
10
15
20
25
30
35
150 200 250 300 350 400 450 500 550 600
Costofbiocrude,($/GJ)
Plant capacity , MW
Sludge to logwood (0) Sludge to logwood (.25) Sludge to logwood (.5)
• Increasing sludge to
logwood ratio decrease
the cost of biocrude
• There is an optimal ratio
to be mixed to minimize
the production cost
Pyro-biomethane coupled algae production
22
Slow
pyrolysis
Algae production
Biogas
digester
Joint Brazil and Norway
Case 3 : Co-pyrolysis combined thermal and biochemical (Economic
evaluation report)
23
- 200 tonnes of algae per year (Modular system)
- Closed loop/recycling waste streams suggests that economically viable
due to recycling of waste streams (neutrients)
Conclusions and Future work
► Several case design studies are carried out via techno-economic
approaches for enabling biomass carbonization value chain design
► Small Integrate process system (SIPS)-Combined co-pyrolysis
coupled with biochemical routes favours in terms of economic
viability by using cleaner production approaches.
► Further work is required to enable the biocarbon value chain in the
context of viable market products, e.g. example (ammonium
bicarbonate, biohythane)
► Techno-economic analysis and integral system analysis are effective
tools to assess the feasibility of projects at various TRL levels
24
Key results : BioCarb+, Value chain studies for biocarbon pellet production and stove application
Biocarbon is a superior fuel for small scale residential stove with very high heating
value and very good grindability properties compared to raw biomass/wood pellets
What TEA can reveal to influence Market and
Industries
• carbonization degree influences overall specific
heat production cost
• Norwegian spruce is a potential feedstock to
produce biocarbon pellets under the current
market production cost. Overall specific heat
production cost is minimum for case with co-
production of district heat
• pellet price and stove efficiency have major
impacts on the overall heat production cost for
small scale pellet stove applications
New designs or retrofit need to be studied to reduce the cost of
biocarbon pellets for stoves and pellet boilers
What is Biocarbon/Charcoal ?
• Biocarbon (BC) is solid fuel with supirior handling,
grinding and combustion properties
• Biomass subjected to thermochemical conversion operating
at inert conditions,
• The overall process includes devolatilization,
depolymerisation and carbonization and generates a
solid product as the main output, and tarry vapours and
gases.2,
• When carbonized at moderate temperature (T) (400-500 °C),
about 50% of the initial biomass dry mass is retained as
solid product, the rest becoming gases and vapours (30-
35%).
• The C content of the solid product can reach more than 90
wt% on an ash-free basis, with O content below 6 wt% and H
content near 1 wt%
26
Neves D, Thunman H, Matos A, Tarelho L, Gómez-Barea A (2011). Progress in Energy and Combustion Science
37(5):611-630.
Antal M J, Grønli M (2003). Industrial & Engineering Chemistry Research 42(8):1619-1640.
Brewer C E, Brown R C (2012).5.18 - Biochar. In Comprehensive Renewable Energy, Ed.: Ali S, Elsevier, Oxford, pp.
357-384.
Lehmann J (2007).Frontiers in Ecology and the Environment 5:381-387.
Modified costing method by country specific
installation factor
27
Lang factor (1948) Group/zonal, Hand et al.
Study equipment alternatives
Utilization of slow pyrolysis charcoal in
gasification and F-T
28
CAPEX (Total Permanent Investment)
29
Process Equipment
Scale
Specification
Equipment purchase
cost function (M$)
Referen
ce Year
Installation
Factor
Ref.
Lock hopper 𝑀𝐹
𝐺
, Mass Flow Rate
to Gasification (kg/h)
2009 3.37 Larson et.
al. 2009
Entrained flow gasifier
(quote)
𝐻 𝐹, Input Power
(MW)
45.28(𝐻𝐹 200)
0.7
M€2007
Vogel
2007
Ash/slag collector,
dewatering & handling
𝑀𝑎𝑠ℎ
𝐺
, ash mass flow
rate (kg/h)
46.0(𝑀𝑎𝑠ℎ
𝐺
22)
0.67 2007 NETL,
2007
Air compressor 𝑊𝑎𝑖𝑟
𝐴𝑆𝑈
Compressor
Power (MWe)
6.03(𝑊𝑒
𝑎𝑖𝑟
10)
0.67 2009 1.46 Larson et.
al. 2009
Air Separation Unit 𝑀 𝑂2
𝐴𝑆𝑈
, Mass flow rate
O2 (kg/s)
27.6(𝑀 𝑂2
𝐴𝑆𝑈
21.3)
0.5 2009 1.6 Larson et.
al. 2009
O2 Compressor 𝑊𝑂2
𝐺
Compressor
Power (MWe)
8.07(𝑊𝑒
𝑂2
10)
0.67 2009 1.6 Larson et.
al. 2009

Eubce 2016 presentation - skreiberg 002_rsk_final_3_ao.3.2

  • 1.
    1 Bio-carbonization process integrationfor high quality energy carriers: charcoal, biomethane, biocrude, and biofertilizer Rajesh S. Kempegowda a, Øyvind Skreiberg a, Khanh-Quang Tran b , Pagandai V. Pannir Selvam c aSINTEF Energy Research, Trondheim, Norway bDepartment of Energy & Process Engineering, NTNU, Trondheim, Norway cGPEC, Universidade Federal do Rio Grande do Norte - UFRN, Caixa Postal 1524 – Campus Universitário Lagoa Nova, CEP 59078-900 | Natal - RN - Brasil Corresponding author: rajesh.kempegowda@sintef.no
  • 2.
    Historical biocarbon productionprocesses (atmospheric) 2 ►10 to 12 days ►Tar and fumes emissions ►Still practiced in Brazil, Thailand, Africa - Indirect or direct heating mode - In some cases a portion of the biomass is burnt to sustain the carbonization temperature 7 to 8 days World charcoal consumption: 50 million tonnes, at 15 % yield of charcoal, rough estimation: 1 billion m3 wood per year Need sustainable best practices and technology integration
  • 3.
    Biocarbon applications: Dependson the biocarbon quality 3 Keywords: surface area, internal porosity, fixed carbon content, heating value, carbon materials Internal porosity and surface area Fixed carbon content, Potential coke replacement Carbon sink Metal industries Adsorbent / Biofertilizer Heat, electricity and biocrude
  • 4.
    ►Critical issues andopportunities  Emissions from traditional klins and low biocarbon/charcoal yield  Distributed and centralized biorefineries  Forest (threefold increase in the forest biomass)  Potential aquatic resources (algae)  Socio-economic opportunities 4 Driving forces: forestry based biocarbon/charcoal, biocrude https://www.sintef.no/contentassets/.../seaweed-bioeconomy-2014-revised-2.pdf
  • 5.
    Biocarbon yield 5 - Fixedcarbon yield for metal industry - Tar to secondary char formation? Metal industries
  • 6.
    Atmospheric versus pressurizedcarbonization - Industrial status 6 http://www.hnei.hawaii.edu/node/219
  • 7.
    Case scenarios forbetter ecological process design and multiproducts 7 Ecological Principles for value chain design: 1. Utilize all components of the biological organic materials in the wastes 2. More coproducts from the wastes 3. Close the loop via reuse, recycle and renewal of the material and nutrient flows wood Algae Waste water (WW) sludge Zero waste, industrial ecology, cleaner industrial design and green chemistry
  • 8.
    Case 1 :Maximized biocarbon and district heat 8
  • 9.
    Co-pyrolysis platform formaximized biocrude and char 9 Advantages of co-pyrolysisProteins + Lipids + Carbohydrates Cellulose + Hemicellulose + Lignin
  • 10.
    Case 2 :Copyrolysis for biocarbon and biooil (Distirbuted biorefinery) 10
  • 11.
    Case 3: Decentralizedand centralized biorefinery 11 Decentralized
  • 12.
    Approach 12 • AspenPlus process design and modelling • SuperPro (NTNU-UFRN Brazil) • Value chain alternatives Empirical modelling for sub equipments User defined Fortran functions and calculators, data validations with industrial datas Customized Cost modelling, Cost functions, CAPEX and OPEX, Economic viability (IRR,NPV), Risk analysis References 1. Kempegowda, R. S., Ø. Skreiberg and K.-Q. Tran (2012). "Cost modeling approach and economic analysis of biomass gasification integrated solid oxide fuel cell systems." Journal of Renewable and Sustainable Energy 4(4): 043109. 2. Kempegowda, R. S., G. del Alamo, D. Berstad, M. Bugge, B. Matas Güell and K.-Q. Tran (2015). "CHP-Integrated Fischer-Tropsch Biocrude Production under Norwegian Conditions: Techno-Economic Analysis." Energy & Fuels 29(2): 808-822. 3. Kempegowda, R. S., P. V. Pannir Selvam, Ø. Skreiberg and K.-Q. Tran (2012). "Process synthesis and economics of combined biomethanol and CHP energy production derived from biomass wastes." Journal of Chemical Technology & Biotechnology 87(7): 897-902.
  • 13.
    Empirical model development:data gathering (patents and literatures for atmospheric and pressurized carbonization/pyrolysis processes) 13 Adopted from Di Blasi, C., Combustion and gasification rates of lignocellulosic chars. Progress in Energy and Combustion Science, 2009. 35(2): p. 121-140 Antal and others Algae Woody biomass
  • 14.
    Key results: Case1-Maximized biocarbon efficiency 14 Torrefaction Cofiring Carbonization Metal industry - Pyrolysis operating conditions in the reactor (heating rate, particle size, temperature, pressure, biomass species) - Different grade biocarbon for bioenergy and metal industry - Needs different operating conditions T, P effect, secondary char formation, lower reactivity for carbonization T effect,
  • 15.
    Keyresults : Districtheating efficiency with influence of moisture content 15 Feedstock moisture content have a significant influence on district heat production
  • 16.
    BioCarb+, Coproduction ofbiocarbon + district heat What TEA can reveal to influence Market and Industries • Carbonization degree influences overall pellet production cost • Norwegian spruce feedstocks are potential candidates for biocarbon pellets production under the current market production cost • Pellet production cost is very sensitive to biomass price Biocarbon is a superior pellet fuel for small scale residential stoves, with high heating value and good grindability properties compared to raw biomass/wood pellets Biocarbon cost at base cost of 241 NOK/MWh (carbonization at 577 oC) Coproduction of biocarbon and district heat
  • 17.
    Carbon distribution ofH-biocrude/biooil from blended mixture of algae and woody biomass 17 ► Gasoline range
  • 18.
    Energy efficiency: Biocrude,Biochar for co-pyrolysis 18 Case Feedstock Products 400 °C 425 °C 450 °C Case A 100% wood Biocarbon + heat 0.574 - 0.520 Case B 100% wood Biocrude + Biocarbon 0.700 0.700 0.701 Case C 75% wood, 25% algae Biocrude + Biocarbon 0.747 0.740 0.742 Case D 50% wood, 50% algae Biocrude + Biocarbon 0.830 0.806 0.634 Case E 25% wood, 75% algae Biocrude + Biocarbon 0.872 0.625 0.832 Case F 100% sludge Biocrude + Biocarbon 0.903 0.680 0.852 • Higher energy efficiency can be reached with biooil/biocrude production • Assumption (dewatering of algae to 60 % moisture) • Quality of char is not suitable for metallurgy, other alternative applications are CO2 capture/biofertilizer • As well applications in high temperature gasification (slagging) for extraction of metals or concrete technology Blending improves the overall energy efficiency
  • 19.
    CHP Integration forco-pyrolysis centallized refinery Figure 4(a) Option A Figure 4(b) Option B Figure 4(c) Option C 0 200 400 600 800 1000 1200 1400 0 20000 40000 60000 80000 100000 120000 Temperature(C) Q (MW) 0 200 400 600 800 1000 1200 1400 0 20000 40000 60000 80000 100000 120000 Temperature(C) Q (kW) 0 200 400 600 800 1000 1200 1400 0 20000 40000 60000 80000 100000 120000 Temperature(C) Q (kW) Conventional Intermediate pressure extraction EXTRACTION AT TWO DIFFERENT PRESSURE LEVELS Heat integration to improve the overall enery efficiency
  • 20.
    Plant specific costfor centralized refinery 20 No co-processing with CHP Co-processing without combined cyle power plant CHP-Integrated Fischer-Tropsch Biocrude Production under Norwegian Conditions: Techno- Economic Analysis Rajesh S Kempegowda, Gonzalo del Alamo, David Berstad, Mette Bugge, Berta Matas Güell, and Khanh-Quang Tran Energy & Fuels 2015 29 (2), 808-822 DOI: 10.1021/ef502326g With modified PFD Modified to reduce the overall specific cost (thermal input basis)
  • 21.
    Techno-economic viability forGasification-FT synthesis route (centralized refinery) 21 10 15 20 25 30 35 150 200 250 300 350 400 450 500 550 600 Costofbiocrude,($/GJ) Plant capacity , MW Sludge to logwood (0) Sludge to logwood (.25) Sludge to logwood (.5) • Increasing sludge to logwood ratio decrease the cost of biocrude • There is an optimal ratio to be mixed to minimize the production cost
  • 22.
    Pyro-biomethane coupled algaeproduction 22 Slow pyrolysis Algae production Biogas digester Joint Brazil and Norway
  • 23.
    Case 3 :Co-pyrolysis combined thermal and biochemical (Economic evaluation report) 23 - 200 tonnes of algae per year (Modular system) - Closed loop/recycling waste streams suggests that economically viable due to recycling of waste streams (neutrients)
  • 24.
    Conclusions and Futurework ► Several case design studies are carried out via techno-economic approaches for enabling biomass carbonization value chain design ► Small Integrate process system (SIPS)-Combined co-pyrolysis coupled with biochemical routes favours in terms of economic viability by using cleaner production approaches. ► Further work is required to enable the biocarbon value chain in the context of viable market products, e.g. example (ammonium bicarbonate, biohythane) ► Techno-economic analysis and integral system analysis are effective tools to assess the feasibility of projects at various TRL levels 24
  • 25.
    Key results :BioCarb+, Value chain studies for biocarbon pellet production and stove application Biocarbon is a superior fuel for small scale residential stove with very high heating value and very good grindability properties compared to raw biomass/wood pellets What TEA can reveal to influence Market and Industries • carbonization degree influences overall specific heat production cost • Norwegian spruce is a potential feedstock to produce biocarbon pellets under the current market production cost. Overall specific heat production cost is minimum for case with co- production of district heat • pellet price and stove efficiency have major impacts on the overall heat production cost for small scale pellet stove applications New designs or retrofit need to be studied to reduce the cost of biocarbon pellets for stoves and pellet boilers
  • 26.
    What is Biocarbon/Charcoal? • Biocarbon (BC) is solid fuel with supirior handling, grinding and combustion properties • Biomass subjected to thermochemical conversion operating at inert conditions, • The overall process includes devolatilization, depolymerisation and carbonization and generates a solid product as the main output, and tarry vapours and gases.2, • When carbonized at moderate temperature (T) (400-500 °C), about 50% of the initial biomass dry mass is retained as solid product, the rest becoming gases and vapours (30- 35%). • The C content of the solid product can reach more than 90 wt% on an ash-free basis, with O content below 6 wt% and H content near 1 wt% 26 Neves D, Thunman H, Matos A, Tarelho L, Gómez-Barea A (2011). Progress in Energy and Combustion Science 37(5):611-630. Antal M J, Grønli M (2003). Industrial & Engineering Chemistry Research 42(8):1619-1640. Brewer C E, Brown R C (2012).5.18 - Biochar. In Comprehensive Renewable Energy, Ed.: Ali S, Elsevier, Oxford, pp. 357-384. Lehmann J (2007).Frontiers in Ecology and the Environment 5:381-387.
  • 27.
    Modified costing methodby country specific installation factor 27 Lang factor (1948) Group/zonal, Hand et al. Study equipment alternatives
  • 28.
    Utilization of slowpyrolysis charcoal in gasification and F-T 28
  • 29.
    CAPEX (Total PermanentInvestment) 29 Process Equipment Scale Specification Equipment purchase cost function (M$) Referen ce Year Installation Factor Ref. Lock hopper 𝑀𝐹 𝐺 , Mass Flow Rate to Gasification (kg/h) 2009 3.37 Larson et. al. 2009 Entrained flow gasifier (quote) 𝐻 𝐹, Input Power (MW) 45.28(𝐻𝐹 200) 0.7 M€2007 Vogel 2007 Ash/slag collector, dewatering & handling 𝑀𝑎𝑠ℎ 𝐺 , ash mass flow rate (kg/h) 46.0(𝑀𝑎𝑠ℎ 𝐺 22) 0.67 2007 NETL, 2007 Air compressor 𝑊𝑎𝑖𝑟 𝐴𝑆𝑈 Compressor Power (MWe) 6.03(𝑊𝑒 𝑎𝑖𝑟 10) 0.67 2009 1.46 Larson et. al. 2009 Air Separation Unit 𝑀 𝑂2 𝐴𝑆𝑈 , Mass flow rate O2 (kg/s) 27.6(𝑀 𝑂2 𝐴𝑆𝑈 21.3) 0.5 2009 1.6 Larson et. al. 2009 O2 Compressor 𝑊𝑂2 𝐺 Compressor Power (MWe) 8.07(𝑊𝑒 𝑂2 10) 0.67 2009 1.6 Larson et. al. 2009