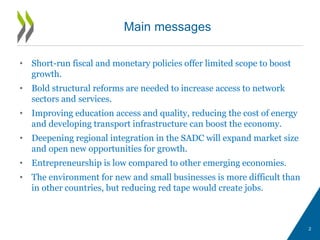
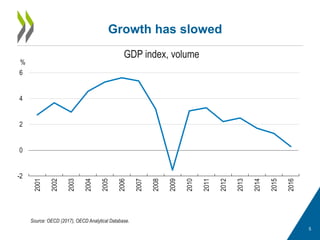
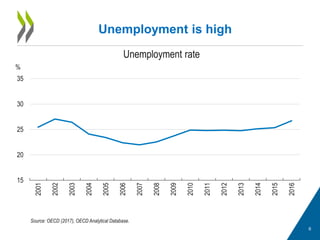
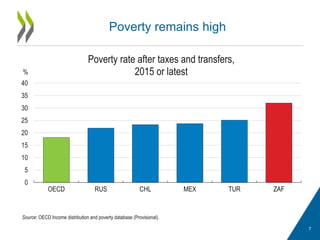
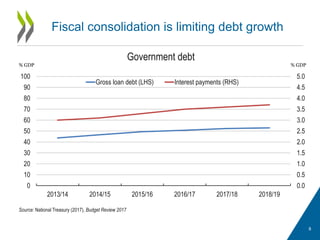
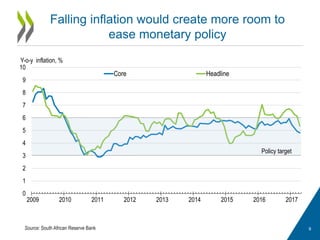
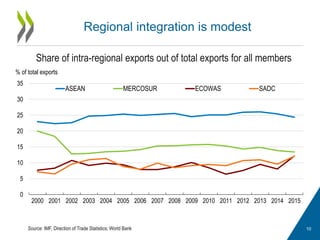
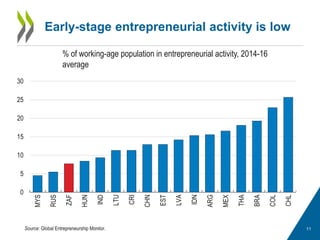
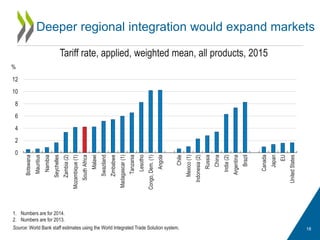
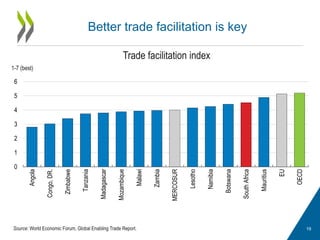
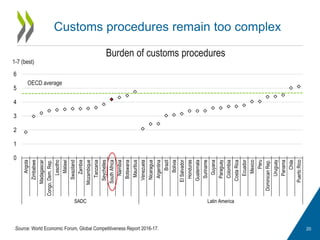
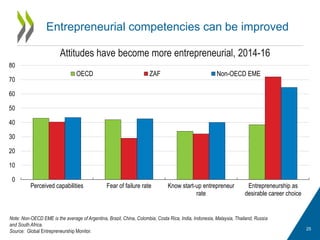
2017 OECD ECONOMIC
SURVEY OF SOUTH AFRICA
Finding new ways to boost growth and job creation
Pretoria, 24 July 2017
@OECD
@OECDeconomy
http://www.oecd.org/eco/surveys/economic-survey-south-africa.htm
• Short-run fiscal and monetary policies offer limited scope to boost
growth.
• Bold structural reforms are needed to increase access to network
sectors and services.
• Improving education access and quality, reducing the cost of energy
and developing transport infrastructure can boost the economy.
• Deepening regional integration in the SADC will expand market size
and open new opportunities for growth.
• Entrepreneurship is low compared to other emerging economies.
• The environment for new and small businesses is more difficult than
in other countries, but reducing red tape would create jobs.
Main messages
2
South Africa performs well on some well-
being dimensions
3
Source: OECD (2016), "Better Life Index 2016", OECD Social and Welfare Statistics (database).
0
2
4
6
8
10
Income and wealth
Jobs and earnings
Housing
Work and life balance
Health status
Education and skillsSocial connections
Civic engagement and governance
Environmental quality
Personal security
Subjective well-being
South Africa OECD emerging market average
Social transfers reduce inequality
4
Source: OECD Income distribution and poverty database (provisional).
0
10
20
30
40
50
60
70
80
Lowest Second Third Fourth Highest
%
Distribution of income and transfers by quintile, entire population,
2015
Share of income Share of transfers
5
Growth has slowed
GDP index, volume
Source: OECD (2017), OECD Analytical Database.
-2
0
2
4
6
2001
2002
2003
2004
2005
2006
2007
2008
2009
2010
2011
2012
2013
2014
2015
2016
%
6
Unemployment is high
Unemployment rate
Source: OECD (2017), OECD Analytical Database.
15
20
25
30
35
2001
2002
2003
2004
2005
2006
2007
2008
2009
2010
2011
2012
2013
2014
2015
2016
%
Poverty remains high
7
Source: OECD Income distribution and poverty database (Provisional).
0
5
10
15
20
25
30
35
40
OECD RUS CHL MEX TUR ZAF
%
Poverty rate after taxes and transfers,
2015 or latest
Fiscal consolidation is limiting debt growth
8
0.0
0.5
1.0
1.5
2.0
2.5
3.0
3.5
4.0
4.5
5.0
0
10
20
30
40
50
60
70
80
90
100
2013/14 2014/15 2015/16 2016/17 2017/18 2018/19
Government debt
Gross loan debt (LHS) Interest payments (RHS)
% GDP % GDP
Source: National Treasury (2017), Budget Review 2017
Falling inflation would create more room to
ease monetary policy
9
0
1
2
3
4
5
6
7
8
9
10
2009 2010 2011 2012 2013 2014 2015 2016 2017
Y-o-y inflation, %
Core Headline
Policy target
Source: South African Reserve Bank
Regional integration is modest
10
Share of intra-regional exports out of total exports for all members
Source: IMF, Direction of Trade Statistics; World Bank
0
5
10
15
20
25
30
35
2000 2001 2002 2003 2004 2005 2006 2007 2008 2009 2010 2011 2012 2013 2014 2015
% of total exports
ASEAN MERCOSUR ECOWAS SADC
Early-stage entrepreneurial activity is low
11
% of working-age population in entrepreneurial activity, 2014-16
average
Source: Global Entrepreneurship Monitor.
0
5
10
15
20
25
30
MYS
RUS
ZAF
HUN
IND
LTU
CRI
CHN
EST
LVA
IDN
ARG
MEX
THA
BRA
COL
CHL
12
Policy reforms to boost inclusive growth
The national minimum wage will reduce in-
work poverty
13
0.0
0.2
0.4
0.6
0.8
1.0
1.2
RUS
VNM
IND
ESP
MEX
CZE
EST
MYS
SVK
GRC
LTU
OECD
POL
LVA
HUN
ROU
PRT
SVN
THA
CHL
ZAF(current)
IDN
CRI
TUR
COL
ZAF(proposed)
Minimum relative to median wages, 2015 or latest
Source: OECD; ILO; World Bank.
More effective public spending will create fiscal space
14
0
2
4
6
8
10
12
14
16
Colombia Indonesia Chile Thailand Turkey Russia OECD Brazil South Africa
% of GDP
Compensation of general government employees, 2015
Source: IMF, Government Finance Statistics.
The cost of higher education has been
increasing
15
0
5
10
15
20
25
30
35
2009 2010 2011 2012 2013 2014
Billion ZAR
Government subsidy and university personnel costs
Personnel costs Government subsidies
Source: Department of Higher Education and Training (2016); OECD calculations.
 Set up an independent commission of experts to advise on minimum
wage adjustments.
 Develop apprenticeship and internship programmes to increase
youth employment.
 Limit annual wage increases in the public sector and redeploy civil
servants to priority areas.
 Deepen implementation of public procurement reform and enforce
sanctions for breaches of the Public Financial Management Act.
 Ensure that state-owned enterprises respect procurement and
expenditure rules.
 Set up a scheme of universal student loans contingent on future
incomes, with participation from banks and government guarantees.
Main recommendations
16
Deepen regional integration
17
Deeper regional integration would expand markets
18
Tariff rate, applied, weighted mean, all products, 2015
1. Numbers are for 2014.
2. Numbers are for 2013.
Source: World Bank staff estimates using the World Integrated Trade Solution system.
0
2
4
6
8
10
12
Botswana
Mauritius
Namibia
Seychelles
Zambia(2)
Mozambique(1)
SouthAfrica
Malawi
Swaziland
Zimbabwe
Madagascar(1)
Tanzania
Lesotho
Congo,Dem.(1)
Angola
Chile
Mexico(1)
Indonesia(2)
Russia
China
India(2)
Argentina
Brazil
Canada
Japan
EU
UnitedStates
%
Better trade facilitation is key
19
Trade facilitation index
0
1
2
3
4
5
6
Angola
Congo,DR.
Zimbabwe
Tanzania
Madagascar
Mozambique
Malawi
Zambia
MERCOSUR
Lesotho
Namibia
Botswana
SouthAfrica
Mauritius
EU
OECD
1-7 (best)
Source: World Economic Forum, Global Enabling Trade Report.
Customs procedures remain too complex
20
0
1
2
3
4
5
6
Angola
Zimbabwe
Madagascar
Congo,Dem.Rep.
Lesotho
Malawi
Swaziland
Zambia
Mozambique
Tanzania
Seychelles
SouthAfrica
Namibia
Botswana
Mauritius
Venezuela
Nicaragua
Argentina
Brazil
Bolivia
ElSalvador
Honduras
Guatemala
Suriname
Guyana
Paraguay
Colombia
CostaRica
Ecuador
Mexico
Peru
DominicanRep.
Uruguay
Panama
Chile
PuertoRico
SADC Latin America
1-7 (best)
OECD average
Burden of customs procedures
Source: World Economic Forum, Global Competitiveness Report 2016-17.
 Reduce non-tariff barriers within South African Development
Community (SADC).
 Lead the harmonisation of competition rules among SADC
countries and promote competition in infrastructure-related services
across countries.
 Simplify and adopt a single set of rules of origin in the forthcoming
tripartite free trade area.
 Provide special economic zones with better infrastructure and
develop their linkages with local economies.
 Upgrade information technology at custom posts and improve the
interconnectivity of systems within SADC.
 Create a regional fund for infrastructure and increase private sector
participation in infrastructure projects.
Main recommendations on regional integration
21
Boosting job creation through more
start-ups and SME growth
22
It is key to remove red tape
23
0
10
20
30
40
50
60
70
80
90
EST
LVA
CHL
TUR
HUN
OECD
MEX
RUS
IDN
IND
CHN
POL
ZAF
BRA
Days
Time required to start a business
Source: World Bank (2017), Doing Business database.
Opening up access to professional services is
important for start-ups
24
0
1
2
3
4
5
All
professions
Accounting Legal Architect Engineer
0-6 (most restrictive)
Regulation in professional services
ZAF Non-OECD EMEs
OECD EMEs OECD average
Note: The emerging market economies are 5 non-OECD member countries (Brazil, China, India, Russia and South Africa, with varying coverage)
and 5 OECD members (Chile, Hungary, Mexico, Poland and Turkey). Data for 2013 or latest.
Source: OECD, Product Market Regulation Statistics database.
Entrepreneurial competencies can be improved
25
Attitudes have become more entrepreneurial, 2014-16
Note: Non-OECD EME is the average of Argentina, Brazil, China, Colombia, Costa Rica, India, Indonesia, Malaysia, Thailand, Russia
and South Africa.
Source: Global Entrepreneurship Monitor.
0
10
20
30
40
50
60
70
80
Perceived capabilities Fear of failure rate Know start-up entrepreneur
rate
Entrepreneurship as
desirable career choice
OECD ZAF Non-OECD EME
 Enact a package of reforms to reduce red tape.
 Introduce a “silence is consent rule” for licensing procedures that
have low associated risks. Systematically review and reduce the
stock of red tape and licensing requirements.
 Open up telecommunications, energy, transport and services sectors
to competition.
 Evaluate and streamline financial and non-financial support for
start-ups and small businesses.
 Expand second-chance programmes for early school leavers.
 Increase entrepreneurial education and work placements in the
post-school education system.
Main recommendations on entrepreneurship
and SMEs
26
27
For more information
http://www.oecd.org/eco/surveys/economic-survey-south-africa.htm
@OECD
@OECDeconomy

2017 oecd-economic-survey-south-africa-presentation

  • 1.
    2017 OECD ECONOMIC SURVEYOF SOUTH AFRICA Finding new ways to boost growth and job creation Pretoria, 24 July 2017 @OECD @OECDeconomy http://www.oecd.org/eco/surveys/economic-survey-south-africa.htm
  • 2.
    • Short-run fiscaland monetary policies offer limited scope to boost growth. • Bold structural reforms are needed to increase access to network sectors and services. • Improving education access and quality, reducing the cost of energy and developing transport infrastructure can boost the economy. • Deepening regional integration in the SADC will expand market size and open new opportunities for growth. • Entrepreneurship is low compared to other emerging economies. • The environment for new and small businesses is more difficult than in other countries, but reducing red tape would create jobs. Main messages 2
  • 3.
    South Africa performswell on some well- being dimensions 3 Source: OECD (2016), "Better Life Index 2016", OECD Social and Welfare Statistics (database). 0 2 4 6 8 10 Income and wealth Jobs and earnings Housing Work and life balance Health status Education and skillsSocial connections Civic engagement and governance Environmental quality Personal security Subjective well-being South Africa OECD emerging market average
  • 4.
    Social transfers reduceinequality 4 Source: OECD Income distribution and poverty database (provisional). 0 10 20 30 40 50 60 70 80 Lowest Second Third Fourth Highest % Distribution of income and transfers by quintile, entire population, 2015 Share of income Share of transfers
  • 5.
    5 Growth has slowed GDPindex, volume Source: OECD (2017), OECD Analytical Database. -2 0 2 4 6 2001 2002 2003 2004 2005 2006 2007 2008 2009 2010 2011 2012 2013 2014 2015 2016 %
  • 6.
    6 Unemployment is high Unemploymentrate Source: OECD (2017), OECD Analytical Database. 15 20 25 30 35 2001 2002 2003 2004 2005 2006 2007 2008 2009 2010 2011 2012 2013 2014 2015 2016 %
  • 7.
    Poverty remains high 7 Source:OECD Income distribution and poverty database (Provisional). 0 5 10 15 20 25 30 35 40 OECD RUS CHL MEX TUR ZAF % Poverty rate after taxes and transfers, 2015 or latest
  • 8.
    Fiscal consolidation islimiting debt growth 8 0.0 0.5 1.0 1.5 2.0 2.5 3.0 3.5 4.0 4.5 5.0 0 10 20 30 40 50 60 70 80 90 100 2013/14 2014/15 2015/16 2016/17 2017/18 2018/19 Government debt Gross loan debt (LHS) Interest payments (RHS) % GDP % GDP Source: National Treasury (2017), Budget Review 2017
  • 9.
    Falling inflation wouldcreate more room to ease monetary policy 9 0 1 2 3 4 5 6 7 8 9 10 2009 2010 2011 2012 2013 2014 2015 2016 2017 Y-o-y inflation, % Core Headline Policy target Source: South African Reserve Bank
  • 10.
    Regional integration ismodest 10 Share of intra-regional exports out of total exports for all members Source: IMF, Direction of Trade Statistics; World Bank 0 5 10 15 20 25 30 35 2000 2001 2002 2003 2004 2005 2006 2007 2008 2009 2010 2011 2012 2013 2014 2015 % of total exports ASEAN MERCOSUR ECOWAS SADC
  • 11.
    Early-stage entrepreneurial activityis low 11 % of working-age population in entrepreneurial activity, 2014-16 average Source: Global Entrepreneurship Monitor. 0 5 10 15 20 25 30 MYS RUS ZAF HUN IND LTU CRI CHN EST LVA IDN ARG MEX THA BRA COL CHL
  • 12.
    12 Policy reforms toboost inclusive growth
  • 13.
    The national minimumwage will reduce in- work poverty 13 0.0 0.2 0.4 0.6 0.8 1.0 1.2 RUS VNM IND ESP MEX CZE EST MYS SVK GRC LTU OECD POL LVA HUN ROU PRT SVN THA CHL ZAF(current) IDN CRI TUR COL ZAF(proposed) Minimum relative to median wages, 2015 or latest Source: OECD; ILO; World Bank.
  • 14.
    More effective publicspending will create fiscal space 14 0 2 4 6 8 10 12 14 16 Colombia Indonesia Chile Thailand Turkey Russia OECD Brazil South Africa % of GDP Compensation of general government employees, 2015 Source: IMF, Government Finance Statistics.
  • 15.
    The cost ofhigher education has been increasing 15 0 5 10 15 20 25 30 35 2009 2010 2011 2012 2013 2014 Billion ZAR Government subsidy and university personnel costs Personnel costs Government subsidies Source: Department of Higher Education and Training (2016); OECD calculations.
  • 16.
     Set upan independent commission of experts to advise on minimum wage adjustments.  Develop apprenticeship and internship programmes to increase youth employment.  Limit annual wage increases in the public sector and redeploy civil servants to priority areas.  Deepen implementation of public procurement reform and enforce sanctions for breaches of the Public Financial Management Act.  Ensure that state-owned enterprises respect procurement and expenditure rules.  Set up a scheme of universal student loans contingent on future incomes, with participation from banks and government guarantees. Main recommendations 16
  • 17.
  • 18.
    Deeper regional integrationwould expand markets 18 Tariff rate, applied, weighted mean, all products, 2015 1. Numbers are for 2014. 2. Numbers are for 2013. Source: World Bank staff estimates using the World Integrated Trade Solution system. 0 2 4 6 8 10 12 Botswana Mauritius Namibia Seychelles Zambia(2) Mozambique(1) SouthAfrica Malawi Swaziland Zimbabwe Madagascar(1) Tanzania Lesotho Congo,Dem.(1) Angola Chile Mexico(1) Indonesia(2) Russia China India(2) Argentina Brazil Canada Japan EU UnitedStates %
  • 19.
    Better trade facilitationis key 19 Trade facilitation index 0 1 2 3 4 5 6 Angola Congo,DR. Zimbabwe Tanzania Madagascar Mozambique Malawi Zambia MERCOSUR Lesotho Namibia Botswana SouthAfrica Mauritius EU OECD 1-7 (best) Source: World Economic Forum, Global Enabling Trade Report.
  • 20.
    Customs procedures remaintoo complex 20 0 1 2 3 4 5 6 Angola Zimbabwe Madagascar Congo,Dem.Rep. Lesotho Malawi Swaziland Zambia Mozambique Tanzania Seychelles SouthAfrica Namibia Botswana Mauritius Venezuela Nicaragua Argentina Brazil Bolivia ElSalvador Honduras Guatemala Suriname Guyana Paraguay Colombia CostaRica Ecuador Mexico Peru DominicanRep. Uruguay Panama Chile PuertoRico SADC Latin America 1-7 (best) OECD average Burden of customs procedures Source: World Economic Forum, Global Competitiveness Report 2016-17.
  • 21.
     Reduce non-tariffbarriers within South African Development Community (SADC).  Lead the harmonisation of competition rules among SADC countries and promote competition in infrastructure-related services across countries.  Simplify and adopt a single set of rules of origin in the forthcoming tripartite free trade area.  Provide special economic zones with better infrastructure and develop their linkages with local economies.  Upgrade information technology at custom posts and improve the interconnectivity of systems within SADC.  Create a regional fund for infrastructure and increase private sector participation in infrastructure projects. Main recommendations on regional integration 21
  • 22.
    Boosting job creationthrough more start-ups and SME growth 22
  • 23.
    It is keyto remove red tape 23 0 10 20 30 40 50 60 70 80 90 EST LVA CHL TUR HUN OECD MEX RUS IDN IND CHN POL ZAF BRA Days Time required to start a business Source: World Bank (2017), Doing Business database.
  • 24.
    Opening up accessto professional services is important for start-ups 24 0 1 2 3 4 5 All professions Accounting Legal Architect Engineer 0-6 (most restrictive) Regulation in professional services ZAF Non-OECD EMEs OECD EMEs OECD average Note: The emerging market economies are 5 non-OECD member countries (Brazil, China, India, Russia and South Africa, with varying coverage) and 5 OECD members (Chile, Hungary, Mexico, Poland and Turkey). Data for 2013 or latest. Source: OECD, Product Market Regulation Statistics database.
  • 25.
    Entrepreneurial competencies canbe improved 25 Attitudes have become more entrepreneurial, 2014-16 Note: Non-OECD EME is the average of Argentina, Brazil, China, Colombia, Costa Rica, India, Indonesia, Malaysia, Thailand, Russia and South Africa. Source: Global Entrepreneurship Monitor. 0 10 20 30 40 50 60 70 80 Perceived capabilities Fear of failure rate Know start-up entrepreneur rate Entrepreneurship as desirable career choice OECD ZAF Non-OECD EME
  • 26.
     Enact apackage of reforms to reduce red tape.  Introduce a “silence is consent rule” for licensing procedures that have low associated risks. Systematically review and reduce the stock of red tape and licensing requirements.  Open up telecommunications, energy, transport and services sectors to competition.  Evaluate and streamline financial and non-financial support for start-ups and small businesses.  Expand second-chance programmes for early school leavers.  Increase entrepreneurial education and work placements in the post-school education system. Main recommendations on entrepreneurship and SMEs 26
  • 27.

Editor's Notes

  • #5 F 4
  • #8 F 3 Note: % of population with 60% or less than the median disposable income, 2014 or latest
  • #10 F 9
  • #12 ES 3
  • #14 F 6
  • #15 F 13.C
  • #16 F 14
  • #19 F 20 Numbers are for 2014. Numbers are for 2013. Note: Weighted mean applied tariff is the average of effectively applied rates weighted by the product import shares corresponding to each partner country. Data are classified using the Harmonized System of trade at the six- or eight-digit level. Tariff line data were matched to Standard International Trade Classification (SITC) revision 3 codes to define commodity groups and import weights. To the extent possible, specific rates have been converted to their ad valorem equivalent rates and have been included in the calculation of weighted mean tariffs. When the effectively applied rate is unavailable, the most favoured nation rate is used instead. Source: World Bank staff estimates using the World Integrated Trade Solution system.
  • #20 F 1.7
  • #21 F 23.
  • #24 F 27.A
  • #25 F 28.A
  • #26 F 33 Perceived capabilities: those who believe they have the required skills and knowledge to start a business; Fear of failure rate: those perceiving good opportunities to start a business who indicate that fear of failure would prevent them from setting up a business; Know start-up entrepreneur rate: those who personally know someone who started a business in the past two years; Data for 2016 are not available. Entrepreneurship as desirable career choice: those who agree with the statement that in their country, most people consider starting a business as a desirable career choice.