Download to read offline


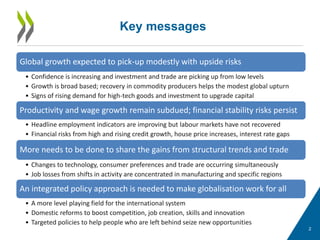
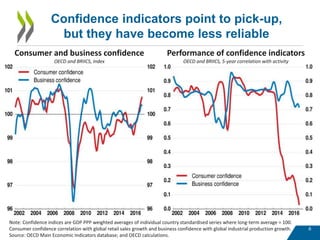
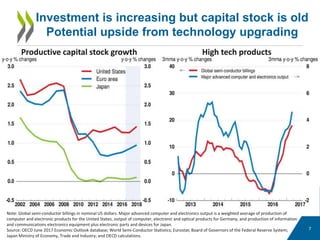
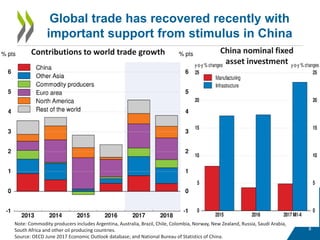
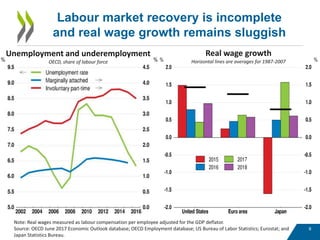
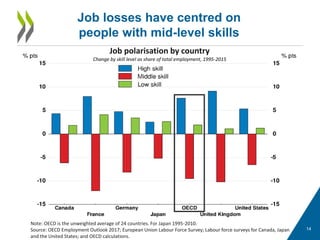
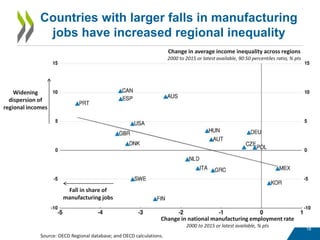
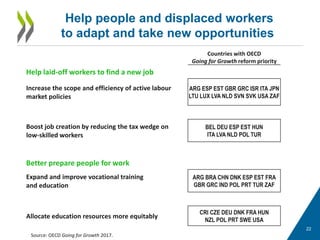
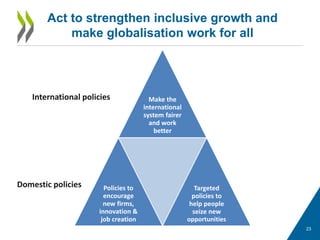

The OECD Economic Outlook indicates a modest global growth recovery buoyed by increased confidence, investment, and trade, despite lingering financial stability risks and an incomplete labor market recovery. Rising income inequality and job losses in manufacturing highlight the need for integrated policy approaches to ensure globalization benefits all, alongside domestic reforms to foster competition and skill development. The report emphasizes the importance of targeted policies to support those displaced by structural changes in the economy.


