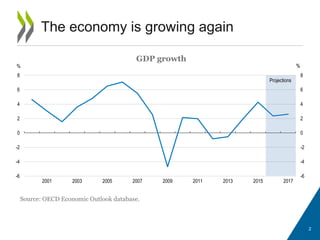
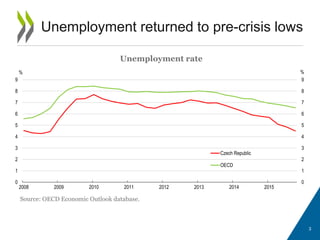
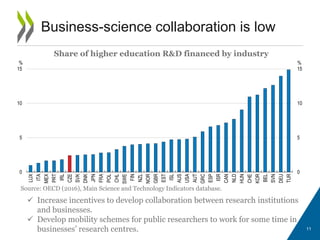
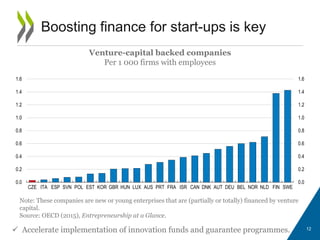
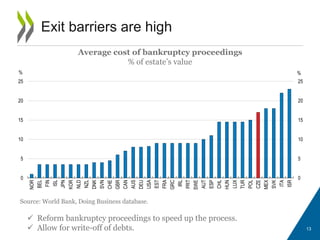
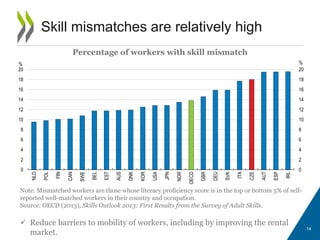
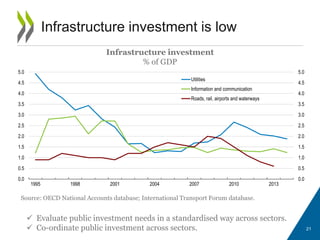
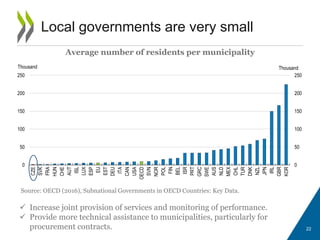
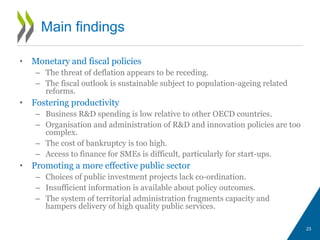
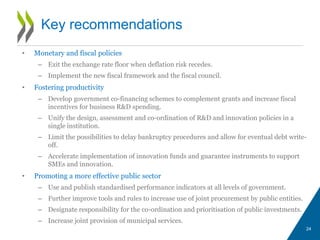
2016 OECD ECONOMIC SURVEY
OF THE CZECH REPUBLIC
Fostering prosperity for all
Prague, 6 June 2016
@OECD
@OECDeconomy
www.oecd.org/eco/surveys/economic-survey-czech-republic.htm
2
The economy is growing again
GDP growth
Source: OECD Economic Outlook database.
-6
-4
-2
0
2
4
6
8
-6
-4
-2
0
2
4
6
8
2001 2003 2005 2007 2009 2011 2013 2015 2017
% %%
Projections
3
Unemployment returned to pre-crisis lows
Unemployment rate
Source: OECD Economic Outlook database.
0
1
2
3
4
5
6
7
8
9
0
1
2
3
4
5
6
7
8
9
2008 2009 2010 2011 2012 2013 2014 2015
%%
Czech Republic
OECD
4
Deflation risks are receding
Inflation
1. CPI inflation excluding food and energy.
Source: OECD Economic Outlook database.
-1
0
1
2
3
4
5
6
7
8
-1
0
1
2
3
4
5
6
7
8
2008 2009 2010 2011 2012 2013 2014 2015 2016
y-o-y %y-o-y %
Headline inflation Core inflation¹
5
Well-being is good overall
OECD Better Life Index
Index scale, 0 (worst) to 10 (best)
Note: For each dimension indicators are normalised and averaged. CEE peers are Estonia, Hungary,
Poland, the Slovak Republic and Slovenia.
Source: OECD (2016), OECD Better Life Index.
0
2
4
6
8
10
Income and wealth
Jobs and earnings
Housing
Work and life balance
Health status
Education and skillsSocial connections
Civic engagement and governance
Environmental quality
Personal security
Subjective well-beingCzech Republic
OECD
CEE peers
6
Inequality is low
Gini coefficient
Note: The Gini coefficient is zero if everyone has the same income and is one if a single person has all
the income.
Source: OECD Income Distribution and Poverty database.
0.0
0.1
0.2
0.3
0.4
0.5
0.0
0.1
0.2
0.3
0.4
0.5
DNK
SVK
SVN
NOR
CZE
ISL
FIN
BEL
SWE
AUT
NLD
CHE
DEU
HUN
POL
LUX
IRL
FRA
KOR
AUS
ITA
NZL
ESP
PRT
EST
GRC
LVA
GBR
ISR
USA
TUR
MEX
7
Reconciling work and family is difficult
The impact of young children on women’s employment rates
Note: Difference between employment rate of women aged 20-49 years with children up to 6 years old
and those without children.
Source: Eurostat.
-50
-40
-30
-20
-10
0
10
-50
-40
-30
-20
-10
0
10
HUN SVK CZE EST GBR DEU TUR FIN IRL EU AUT POL FRA ESP BEL LUX ITA NLD GRC DNK PRT SVN SWE
% pt% pt
FOSTERING PRODUCTIVITY
8
9
Productivity has stalled since the crisis
Labour productivity
Source: OECD Economic Outlook database.
60
70
80
90
100
110
120
130
140
150
60
70
80
90
100
110
120
130
140
150
1995 2000 2005 2010 2015
Index 2006 = 100
Output per worker
Pre-crisis trend
Index 2006 = 100
10
Business R&D spending is low
Business R&D as a percentage of value-added in industry
Source: OECD (2016), Main Science and Technology Indicators database.
 Complement grants with co-financing schemes.
 Increase fiscal incentives for business R&D spending.
 Streamline the system by unifying the design, assessment and co-
ordination of R&D and innovation policies in a single institution.
0.0
0.5
1.0
1.5
2.0
2.5
3.0
3.5
4.0
4.5
5.0
0.0
0.5
1.0
1.5
2.0
2.5
3.0
3.5
4.0
4.5
5.0
MEX
SVK
GRC
POL
EST
PRT
ESP
ITA
CAN
NOR
HUN
CZE
IRL
NLD
GBR
FRA
SVN
BEL
USA
DEU
AUT
DNK
SWE
FIN
JPN
KOR
11
Business-science collaboration is low
Share of higher education R&D financed by industry
Source: OECD (2016), Main Science and Technology Indicators database.
 Increase incentives to develop collaboration between research institutions
and businesses.
 Develop mobility schemes for public researchers to work for some time in
businesses’ research centres.
0
5
10
15
0
5
10
15
LUX
ITA
MEX
PRT
IRL
CZE
SVK
DNK
JPN
FRA
POL
CHL
SWE
FIN
NZL
NOR
GBR
EST
ISL
AUS
USA
AUT
GRC
ESP
ISR
CAN
NLD
HUN
CHE
KOR
BEL
SVN
DEU
TUR
% %
12
Boosting finance for start-ups is key
Venture-capital backed companies
Per 1 000 firms with employees
Note: These companies are new or young enterprises that are (partially or totally) financed by venture
capital.
Source: OECD (2015), Entrepreneurship at a Glance.
 Accelerate implementation of innovation funds and guarantee programmes.
0.0
0.2
0.4
0.6
0.8
1.0
1.2
1.4
1.6
0.0
0.2
0.4
0.6
0.8
1.0
1.2
1.4
1.6
CZE ITA ESP SVN POL EST KOR GBR HUN LUX AUS PRT FRA ISR CAN DNK AUT DEU BEL NOR NLD FIN SWE
13
Exit barriers are high
Average cost of bankruptcy proceedings
% of estate’s value
Source: World Bank, Doing Business database.
 Reform bankruptcy proceedings to speed up the process.
 Allow for write-off of debts.
0
5
10
15
20
25
0
5
10
15
20
25
NOR
BEL
FIN
ISL
JPN
KOR
NLD
NZL
DNK
SVN
CHE
GBR
CAN
AUS
DEU
USA
EST
FRA
GRC
IRL
PRT
SWE
AUT
ESP
CHL
HUN
LUX
TUR
POL
CZE
MEX
SVK
ITA
ISR
%%
14
Skill mismatches are relatively high
Percentage of workers with skill mismatch
Note: Mismatched workers are those whose literacy proficiency score is in the top or bottom 5% of self-
reported well-matched workers in their country and occupation.
Source: OECD (2013), Skills Outlook 2013: First Results from the Survey of Adult Skills.
 Reduce barriers to mobility of workers, including by improving the rental
market.
0
2
4
6
8
10
12
14
16
18
20
0
2
4
6
8
10
12
14
16
18
20
NLD
POL
FIN
CAN
SWE
BEL
EST
AUS
DNK
KOR
USA
JPN
NOR
OECD
GBR
DEU
SVK
ITA
CZE
AUT
ESP
IRL
% %
15
Self-employment is high
Self-employed workers with no employees
% of total employment
Source: Eurostat.
 Align social security coverage of the self-employed and employees.
 Reconsider the tax advantages of self-employment.
0
5
10
15
20
25
0
5
10
15
20
25
DNK
NOR
LUX
HUN
DEU
SWE
EST
CHE
AUT
FRA
ISL
SVN
FIN
BEL
PRT
EU28
IRL
GBR
NLD
ESP
SVK
CZE
POL
TUR
ITA
GRC
PROMOTING A MORE
EFFECTIVE PUBLIC
SECTOR
16
17
Government debt is low
Government debt (Maastricht definition)
Source: OECD Economic Outlook database.
 Implementing the fiscal framework and fiscal council will help maintain
debt sustainability.
0
40
80
120
160
200
0
40
80
120
160
200
EST LUX NOR DNK CZE SWE POL SVK FIN NLD DEU HUN SVN AUT GBR IRL FRA ESP BEL PRT ITA GRC
% of GDP% of GDP
18
The public administration could be more
effective
Public administration performance indicator
Note: Composite indicator based on measures of bureaucracy, quality of justice, level of corruption and
government inefficiency.
Source: Dutu and Sicari (2016).
 Use and publish performance indicators for all levels of government.
0
1
2
3
4
5
0
1
2
3
4
5
SVK CZE HUN SVN POL EST OECD AUT BEL DNK SWE FIN
19
Turnover in the civil service has been high
Turnover of civil servants with a government change
Number of levels of senior civil service that are affected
Note: In the countries with no turnover a change of government does not directly affect the
employment of public servants.
Source: OECD, Government at a Glance.
 Review the implementation of the new Civil Service Act, including the
overall remuneration system and staff engagement.
0
1
2
3
4
5
6
7
0
1
2
3
4
5
6
7
AUS
AUT
CAN
DNK
EST
GBR
IRL
JPN
NOR
NZL
SWE
BEL
CHE
FIN
ISL
KOR
NLD
POL
SVN
DEU
ESP
FRA
GRC
ISR
ITA
PRT
CZE
MEX
SVK
USA
CHL
HUN
TUR
20
Public procurement should be more
competitive
Share of procurement processes with no call for tender
Source: European Commission, Single Market Scoreboard.
 Increase joint procurement by public entities to increase contract size and
improve competition.
 Increase auditing throughout the process.
0
5
10
15
20
0
5
10
15
20
SWE NOR IRL PRT LUX GRC FIN GBR BEL NLD DNK AUT FRA POL ISL DEU ITA ESP EST HUN SVK SVN CZE
%%
21
Infrastructure investment is low
Source: OECD National Accounts database; International Transport Forum database.
 Evaluate public investment needs in a standardised way across sectors.
 Co-ordinate public investment across sectors.
Infrastructure investment
% of GDP
0.0
0.5
1.0
1.5
2.0
2.5
3.0
3.5
4.0
4.5
5.0
0.0
0.5
1.0
1.5
2.0
2.5
3.0
3.5
4.0
4.5
5.0
1995 1998 2001 2004 2007 2010 2013
Utilities
Information and communication
Roads, rail, airports and waterways
22
Local governments are very small
Average number of residents per municipality
Source: OECD (2016), Subnational Governments in OECD Countries: Key Data.
 Increase joint provision of services and monitoring of performance.
 Provide more technical assistance to municipalities, particularly for
procurement contracts.
0
50
100
150
200
250
0
50
100
150
200
250
CZE
SVK
FRA
HUN
CHE
AUT
ISL
LUX
ESP
EU
EST
DEU
ITA
CAN
USA
OECD
SVN
NOR
POL
FIN
BEL
ISR
PRT
GRC
SWE
AUS
NLD
MEX
CHL
TUR
DNK
NZL
JPN
IRL
GBR
KOR
ThousandThousand
• Monetary and fiscal policies
– The threat of deflation appears to be receding.
– The fiscal outlook is sustainable subject to population-ageing related
reforms.
• Fostering productivity
– Business R&D spending is low relative to other OECD countries.
– Organisation and administration of R&D and innovation policies are too
complex.
– The cost of bankruptcy is too high.
– Access to finance for SMEs is difficult, particularly for start-ups.
• Promoting a more effective public sector
– Choices of public investment projects lack co-ordination.
– Insufficient information is available about policy outcomes.
– The system of territorial administration fragments capacity and
hampers delivery of high quality public services.
23
Main findings
• Monetary and fiscal policies
– Exit the exchange rate floor when deflation risk recedes.
– Implement the new fiscal framework and the fiscal council.
• Fostering productivity
– Develop government co-financing schemes to complement grants and increase fiscal
incentives for business R&D spending.
– Unify the design, assessment and co-ordination of R&D and innovation policies in a
single institution.
– Limit the possibilities to delay bankruptcy procedures and allow for eventual debt write-
off.
– Accelerate implementation of innovation funds and guarantee instruments to support
SMEs and innovation.
• Promoting a more effective public sector
– Use and publish standardised performance indicators at all levels of government.
– Further improve tools and rules to increase use of joint procurement by public entities.
– Designate responsibility for the co-ordination and prioritisation of public investments.
– Increase joint provision of municipal services.
24
Key recommendations
25
For more information
www.oecd.org/eco/surveys/economic-survey-czech-republic.htm
Disclaimers:
The statistical data for Israel are supplied by and under the responsibility of the relevant Israeli authorities. The use of such data
by the OECD is without prejudice to the status of the Golan Heights, East Jerusalem and Israeli settlements in the West Bank
under the terms of international law.
This document and any map included herein are without prejudice to the status of or sovereignty over any territory, to the
delimitation of international frontiers and boundaries and to the name of any territory, city or area.

Czech republic-2016-oecd-economic-survey-fostering-prosperity-for-all

  • 1.
    2016 OECD ECONOMICSURVEY OF THE CZECH REPUBLIC Fostering prosperity for all Prague, 6 June 2016 @OECD @OECDeconomy www.oecd.org/eco/surveys/economic-survey-czech-republic.htm
  • 2.
    2 The economy isgrowing again GDP growth Source: OECD Economic Outlook database. -6 -4 -2 0 2 4 6 8 -6 -4 -2 0 2 4 6 8 2001 2003 2005 2007 2009 2011 2013 2015 2017 % %% Projections
  • 3.
    3 Unemployment returned topre-crisis lows Unemployment rate Source: OECD Economic Outlook database. 0 1 2 3 4 5 6 7 8 9 0 1 2 3 4 5 6 7 8 9 2008 2009 2010 2011 2012 2013 2014 2015 %% Czech Republic OECD
  • 4.
    4 Deflation risks arereceding Inflation 1. CPI inflation excluding food and energy. Source: OECD Economic Outlook database. -1 0 1 2 3 4 5 6 7 8 -1 0 1 2 3 4 5 6 7 8 2008 2009 2010 2011 2012 2013 2014 2015 2016 y-o-y %y-o-y % Headline inflation Core inflation¹
  • 5.
    5 Well-being is goodoverall OECD Better Life Index Index scale, 0 (worst) to 10 (best) Note: For each dimension indicators are normalised and averaged. CEE peers are Estonia, Hungary, Poland, the Slovak Republic and Slovenia. Source: OECD (2016), OECD Better Life Index. 0 2 4 6 8 10 Income and wealth Jobs and earnings Housing Work and life balance Health status Education and skillsSocial connections Civic engagement and governance Environmental quality Personal security Subjective well-beingCzech Republic OECD CEE peers
  • 6.
    6 Inequality is low Ginicoefficient Note: The Gini coefficient is zero if everyone has the same income and is one if a single person has all the income. Source: OECD Income Distribution and Poverty database. 0.0 0.1 0.2 0.3 0.4 0.5 0.0 0.1 0.2 0.3 0.4 0.5 DNK SVK SVN NOR CZE ISL FIN BEL SWE AUT NLD CHE DEU HUN POL LUX IRL FRA KOR AUS ITA NZL ESP PRT EST GRC LVA GBR ISR USA TUR MEX
  • 7.
    7 Reconciling work andfamily is difficult The impact of young children on women’s employment rates Note: Difference between employment rate of women aged 20-49 years with children up to 6 years old and those without children. Source: Eurostat. -50 -40 -30 -20 -10 0 10 -50 -40 -30 -20 -10 0 10 HUN SVK CZE EST GBR DEU TUR FIN IRL EU AUT POL FRA ESP BEL LUX ITA NLD GRC DNK PRT SVN SWE % pt% pt
  • 8.
  • 9.
    9 Productivity has stalledsince the crisis Labour productivity Source: OECD Economic Outlook database. 60 70 80 90 100 110 120 130 140 150 60 70 80 90 100 110 120 130 140 150 1995 2000 2005 2010 2015 Index 2006 = 100 Output per worker Pre-crisis trend Index 2006 = 100
  • 10.
    10 Business R&D spendingis low Business R&D as a percentage of value-added in industry Source: OECD (2016), Main Science and Technology Indicators database.  Complement grants with co-financing schemes.  Increase fiscal incentives for business R&D spending.  Streamline the system by unifying the design, assessment and co- ordination of R&D and innovation policies in a single institution. 0.0 0.5 1.0 1.5 2.0 2.5 3.0 3.5 4.0 4.5 5.0 0.0 0.5 1.0 1.5 2.0 2.5 3.0 3.5 4.0 4.5 5.0 MEX SVK GRC POL EST PRT ESP ITA CAN NOR HUN CZE IRL NLD GBR FRA SVN BEL USA DEU AUT DNK SWE FIN JPN KOR
  • 11.
    11 Business-science collaboration islow Share of higher education R&D financed by industry Source: OECD (2016), Main Science and Technology Indicators database.  Increase incentives to develop collaboration between research institutions and businesses.  Develop mobility schemes for public researchers to work for some time in businesses’ research centres. 0 5 10 15 0 5 10 15 LUX ITA MEX PRT IRL CZE SVK DNK JPN FRA POL CHL SWE FIN NZL NOR GBR EST ISL AUS USA AUT GRC ESP ISR CAN NLD HUN CHE KOR BEL SVN DEU TUR % %
  • 12.
    12 Boosting finance forstart-ups is key Venture-capital backed companies Per 1 000 firms with employees Note: These companies are new or young enterprises that are (partially or totally) financed by venture capital. Source: OECD (2015), Entrepreneurship at a Glance.  Accelerate implementation of innovation funds and guarantee programmes. 0.0 0.2 0.4 0.6 0.8 1.0 1.2 1.4 1.6 0.0 0.2 0.4 0.6 0.8 1.0 1.2 1.4 1.6 CZE ITA ESP SVN POL EST KOR GBR HUN LUX AUS PRT FRA ISR CAN DNK AUT DEU BEL NOR NLD FIN SWE
  • 13.
    13 Exit barriers arehigh Average cost of bankruptcy proceedings % of estate’s value Source: World Bank, Doing Business database.  Reform bankruptcy proceedings to speed up the process.  Allow for write-off of debts. 0 5 10 15 20 25 0 5 10 15 20 25 NOR BEL FIN ISL JPN KOR NLD NZL DNK SVN CHE GBR CAN AUS DEU USA EST FRA GRC IRL PRT SWE AUT ESP CHL HUN LUX TUR POL CZE MEX SVK ITA ISR %%
  • 14.
    14 Skill mismatches arerelatively high Percentage of workers with skill mismatch Note: Mismatched workers are those whose literacy proficiency score is in the top or bottom 5% of self- reported well-matched workers in their country and occupation. Source: OECD (2013), Skills Outlook 2013: First Results from the Survey of Adult Skills.  Reduce barriers to mobility of workers, including by improving the rental market. 0 2 4 6 8 10 12 14 16 18 20 0 2 4 6 8 10 12 14 16 18 20 NLD POL FIN CAN SWE BEL EST AUS DNK KOR USA JPN NOR OECD GBR DEU SVK ITA CZE AUT ESP IRL % %
  • 15.
    15 Self-employment is high Self-employedworkers with no employees % of total employment Source: Eurostat.  Align social security coverage of the self-employed and employees.  Reconsider the tax advantages of self-employment. 0 5 10 15 20 25 0 5 10 15 20 25 DNK NOR LUX HUN DEU SWE EST CHE AUT FRA ISL SVN FIN BEL PRT EU28 IRL GBR NLD ESP SVK CZE POL TUR ITA GRC
  • 16.
  • 17.
    17 Government debt islow Government debt (Maastricht definition) Source: OECD Economic Outlook database.  Implementing the fiscal framework and fiscal council will help maintain debt sustainability. 0 40 80 120 160 200 0 40 80 120 160 200 EST LUX NOR DNK CZE SWE POL SVK FIN NLD DEU HUN SVN AUT GBR IRL FRA ESP BEL PRT ITA GRC % of GDP% of GDP
  • 18.
    18 The public administrationcould be more effective Public administration performance indicator Note: Composite indicator based on measures of bureaucracy, quality of justice, level of corruption and government inefficiency. Source: Dutu and Sicari (2016).  Use and publish performance indicators for all levels of government. 0 1 2 3 4 5 0 1 2 3 4 5 SVK CZE HUN SVN POL EST OECD AUT BEL DNK SWE FIN
  • 19.
    19 Turnover in thecivil service has been high Turnover of civil servants with a government change Number of levels of senior civil service that are affected Note: In the countries with no turnover a change of government does not directly affect the employment of public servants. Source: OECD, Government at a Glance.  Review the implementation of the new Civil Service Act, including the overall remuneration system and staff engagement. 0 1 2 3 4 5 6 7 0 1 2 3 4 5 6 7 AUS AUT CAN DNK EST GBR IRL JPN NOR NZL SWE BEL CHE FIN ISL KOR NLD POL SVN DEU ESP FRA GRC ISR ITA PRT CZE MEX SVK USA CHL HUN TUR
  • 20.
    20 Public procurement shouldbe more competitive Share of procurement processes with no call for tender Source: European Commission, Single Market Scoreboard.  Increase joint procurement by public entities to increase contract size and improve competition.  Increase auditing throughout the process. 0 5 10 15 20 0 5 10 15 20 SWE NOR IRL PRT LUX GRC FIN GBR BEL NLD DNK AUT FRA POL ISL DEU ITA ESP EST HUN SVK SVN CZE %%
  • 21.
    21 Infrastructure investment islow Source: OECD National Accounts database; International Transport Forum database.  Evaluate public investment needs in a standardised way across sectors.  Co-ordinate public investment across sectors. Infrastructure investment % of GDP 0.0 0.5 1.0 1.5 2.0 2.5 3.0 3.5 4.0 4.5 5.0 0.0 0.5 1.0 1.5 2.0 2.5 3.0 3.5 4.0 4.5 5.0 1995 1998 2001 2004 2007 2010 2013 Utilities Information and communication Roads, rail, airports and waterways
  • 22.
    22 Local governments arevery small Average number of residents per municipality Source: OECD (2016), Subnational Governments in OECD Countries: Key Data.  Increase joint provision of services and monitoring of performance.  Provide more technical assistance to municipalities, particularly for procurement contracts. 0 50 100 150 200 250 0 50 100 150 200 250 CZE SVK FRA HUN CHE AUT ISL LUX ESP EU EST DEU ITA CAN USA OECD SVN NOR POL FIN BEL ISR PRT GRC SWE AUS NLD MEX CHL TUR DNK NZL JPN IRL GBR KOR ThousandThousand
  • 23.
    • Monetary andfiscal policies – The threat of deflation appears to be receding. – The fiscal outlook is sustainable subject to population-ageing related reforms. • Fostering productivity – Business R&D spending is low relative to other OECD countries. – Organisation and administration of R&D and innovation policies are too complex. – The cost of bankruptcy is too high. – Access to finance for SMEs is difficult, particularly for start-ups. • Promoting a more effective public sector – Choices of public investment projects lack co-ordination. – Insufficient information is available about policy outcomes. – The system of territorial administration fragments capacity and hampers delivery of high quality public services. 23 Main findings
  • 24.
    • Monetary andfiscal policies – Exit the exchange rate floor when deflation risk recedes. – Implement the new fiscal framework and the fiscal council. • Fostering productivity – Develop government co-financing schemes to complement grants and increase fiscal incentives for business R&D spending. – Unify the design, assessment and co-ordination of R&D and innovation policies in a single institution. – Limit the possibilities to delay bankruptcy procedures and allow for eventual debt write- off. – Accelerate implementation of innovation funds and guarantee instruments to support SMEs and innovation. • Promoting a more effective public sector – Use and publish standardised performance indicators at all levels of government. – Further improve tools and rules to increase use of joint procurement by public entities. – Designate responsibility for the co-ordination and prioritisation of public investments. – Increase joint provision of municipal services. 24 Key recommendations
  • 25.
    25 For more information www.oecd.org/eco/surveys/economic-survey-czech-republic.htm Disclaimers: Thestatistical data for Israel are supplied by and under the responsibility of the relevant Israeli authorities. The use of such data by the OECD is without prejudice to the status of the Golan Heights, East Jerusalem and Israeli settlements in the West Bank under the terms of international law. This document and any map included herein are without prejudice to the status of or sovereignty over any territory, to the delimitation of international frontiers and boundaries and to the name of any territory, city or area.