Download as PDF, PPTX


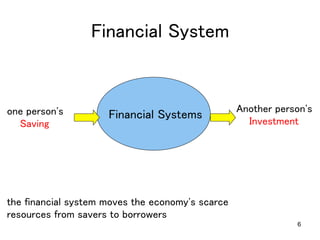
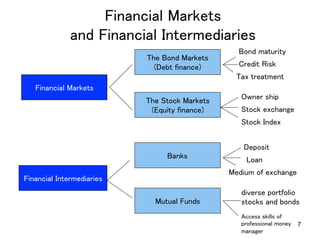
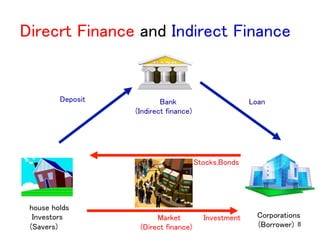
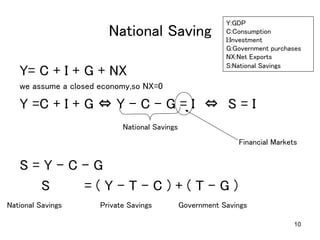
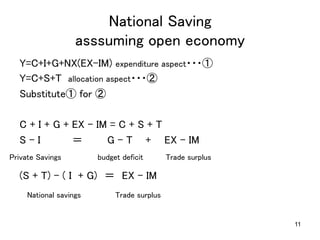
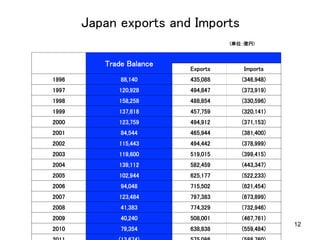
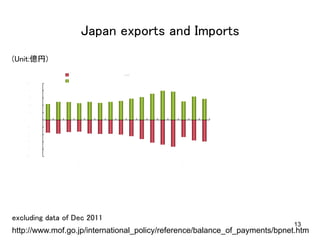
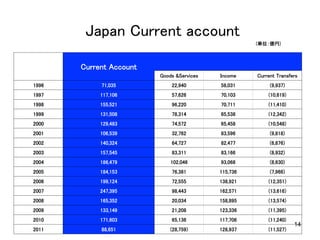
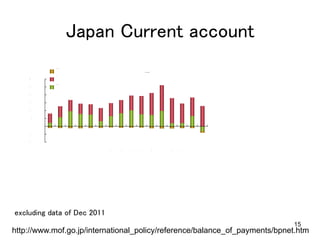
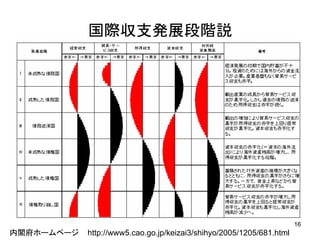
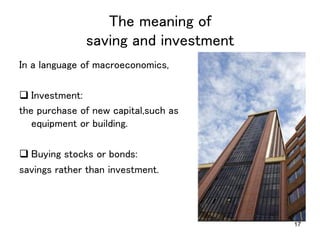
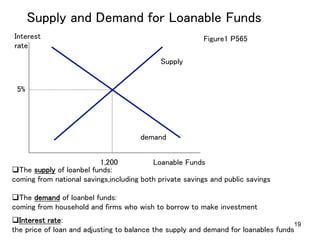

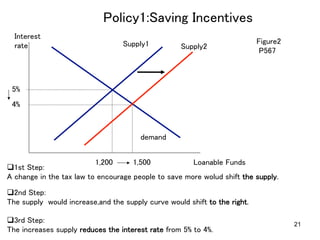
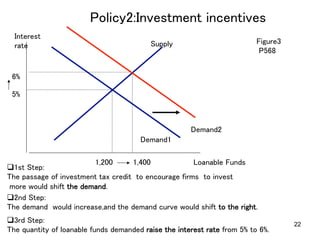
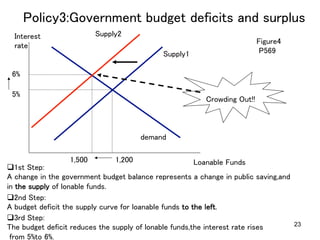
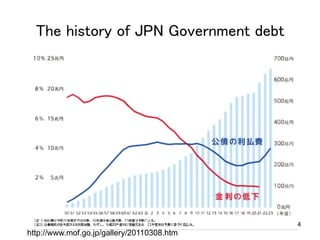
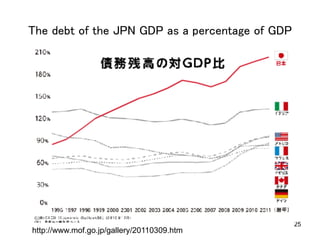

This document provides an overview of key concepts related to saving, investment, and financial markets from an economics textbook. It defines important terms like investment, saving, and different types of financial institutions and markets. It also uses supply and demand diagrams to illustrate how interest rates are determined in the market for loanable funds and how government policies can impact this market through incentives for saving and investment or changes in budget deficits. Historical data on Japan's trade balance, current account, and government debt are also presented.


