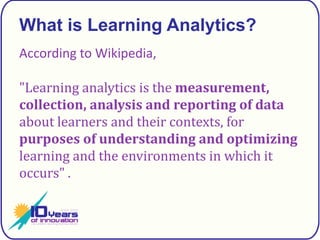
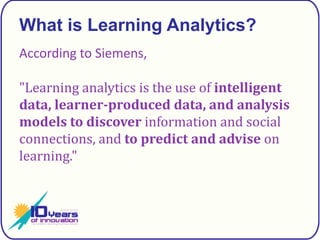
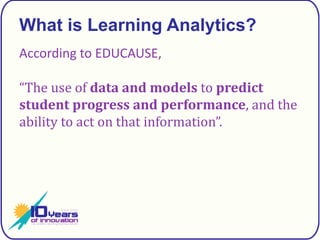
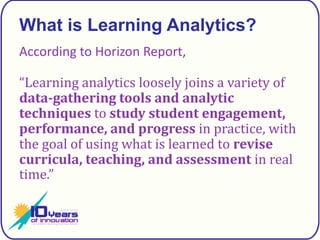
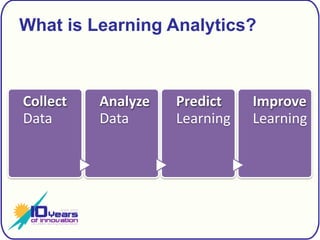
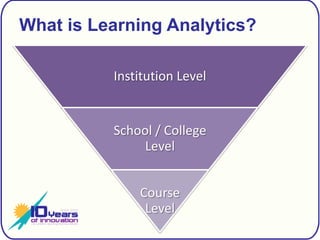
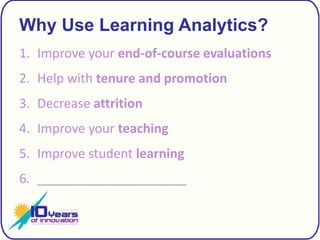
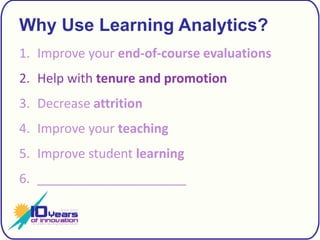
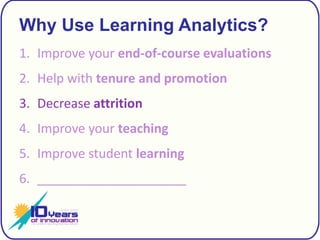
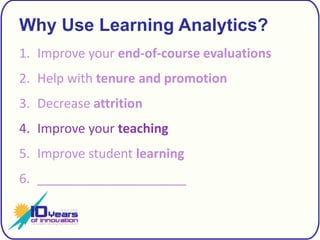
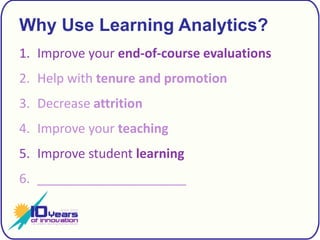
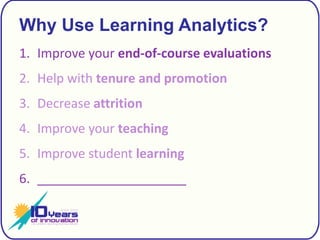
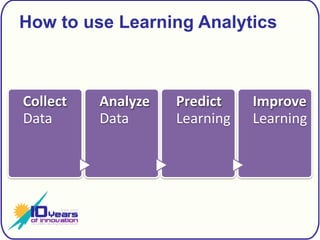
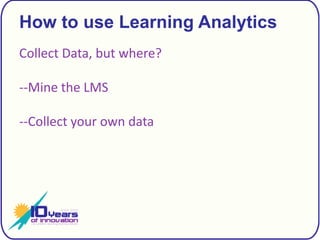
Can you measure if the content in your eLearning system provides an enriching and engaging experience for your learners? If you can't answer this important question, you're not alone. Organizations struggle to combine the complex activity of analyzing data to identify opportunities that can improve learner engagement with their content. It's worth it to find out. Courses and related resources that may not be as valuable as intended can result in decreased interest and attendance rates—leading to poor learning outcomes. There are many ways to measure and analyze course engagement data in your LMS. These insights enable managers to identify, prioritize change to learning programs and step up their engagement game.
CDE InFocus Conference (London): Big data in education - theory and practiceMike Moore
Big Data in Education: Theory and Practice
Presented at the CDE InFocus Conference - London
December 10, 2013
Presented by Mike Moore, Sr. Advisory Consultant - Analytics
Desire2Learn, Inc.
The Learning Ecosystem – A Content Agnostic Adaptive Learning and Analytics System
Presentation from 'InFocus: Learner analytics and big data', a CDE technology symposium held at Senate House on 10 December 2013. Conducted by George Mitchell (Chief Operations Officer, CCKF Ltd, Dublin).
Audio of the session and more details can be found at www.cde.london.ac.uk.
Presentation delivered at the UCISA event A-Z of learning analytics 28/06/2017. Ed Foster & Jane McNeil. A longer case study can be found at https://www.google.com/url?q=https://www.ucisa.ac.uk/-/media/Files/publications/truthaboutda/TheTruthAboutDA&sa=U&ved=0ahUKEwi8r-7W5_7eAhVKRBUIHf66CGEQFggMMAM&client=internal-uds-cse&cx=008281077274678676179:yulrfklwima&usg=AOvVaw17iuGZYPJPqFRCMGyBKLd0
Co-developing bespoke, enterprise-scale analytics systems with teaching staffDanny Liu
Presentation at the NSW Learning Analytics Working Group meeting, 3 February 2016, at the University of Technology, Sydney. Covering projects from Macquarie University and the University of Sydney.
Creating Wraparound Supports for Students through Internal PartnershipsJeremy Anderson
Presentation delivered to the Quality Matters East Regional Conference in 2020. Covered is a basic framework for developing analytics projects by combining stakeholders, IR, and IT.
Lambda Solutions Webinar | Capturing Data to Improve the eLearning Experience...Lambda Solutions
Regardless of what industry you work in, your training needs to have a purpose and produce outcomes - whether they are to inform, teach, improve, or change. The trick is implementing a system for evaluating how effective your training is. This is where data and analytics come in.
By collecting and analyzing data, you will begin to paint a picture of what aspects of training are working, where you need to improve, and the steps you need to take to make those improvements.
How any institution can get started on learning analyticsJeremy Anderson
Two case studies from Bay Path University in developing predictive retention analytics at the course level and across the four-year college experience. Walks through the CRISP-DM framework and how it guided each project. Also shares resources for carrying out similar projects in Excel. Presented at NERCOMP 2021
2018 Library Assessment Conference: How many seats do we need in our library?brightspot
Elliot Felix and Martha Kyrillidou (QualityMetrics, LLC) presented “How Many Seats Do We Need in Our Library? A New Utilization-Based Forecasting Model”
How to Get Started or Expand Your Learning Analytics ProgramWatershed
Watershed co-hosted a workshop with ATD Nashville and Rustici Software to help L&D pros get started with learning analytics. Facilitators Mike Rustici and John Mattox, Ph.D., explored the five steps of learning analytics and helped attendees choose the right approach for their learning analytics programs.
Presented at the 2010 Electronic Resources & Libraries Conference. --
Mary Feeney, Jim Martin, Ping Situ, University of Arizona --
Abstract: Searches, sessions, article requests - have access to data, but what's the next step? Learn how the University of Arizona Libraries' Spending Reductions Project analyzed usage of different types of resources to assess them against quality standards and make cancellation decisions. Tools, challenges, and organizational approaches will also be discussed.
Education, data policy and practice - Kim Schildkamp EduSkills OECD
This presentation was given by Kim Schildkamp of the University of Twente, Netherlands at the GCES Conference on Education Governance: The Role of Data in Tallinn on 12 February during the session on Keynote: Education data, policy and practice.
Education Stakeholders’ Perceptions of the Quality of Secondary Education Und...Creptone I. Madunda
Education development in Tanzania has a long background since 1960’s. Several initiatives and strategies were made whereby in 2002 the country initiated Primary Education Development Program (PEDP) whereby capacity expansion and quality of education were observed in Primary schools. And further, the achievements gained from primary schools leads to the establishment of Secondary Education Development Program (SEDP) phase one starting from 2004 -2009 as phase two from 2010 – 2015. It was during this period when the mushrooming of Community Secondary Schools in every ward national wise started for secondary education.
On 22nd February 2013 the President of United Republic of Tanzania, President Jakaya Mrisho Kikwete inaugurated the Big Results Now in an effort to transform the country’s economy over from its current LDDC status to a middle-income nation-state by the year 2025. On 15th August 2013 by Honorable Dr. Shukuru Kawambwa, Minister for Education and Vocational Training inaugurated Big Results Now in Education sector aiming at raising the quality of education and examination pass rate in primary and secondary schools.
The study findings revealed the following: First, the majority of the students, parents, school committee members and some of the secondary teachers who are the core implementers were unaware of what entail Big Results Now. Second, challenges faced the key implementer of BRN including shortage of teachers, poor support from parents, shortage of fund, shortage of important school infrastructures, irregular and insufficient staff training and support as well as insufficient teaching and learning materials. Moreover, the strategies which were employed to deal with the challenges faced Big Results Now implementation including building of important school infrastructures, salary increase, payment of allowances, regular and sufficient staff training, enough supply of books as well as improvement of school management and administrative system.
The study recommends by addressing things which have to be taken into action by all the in education stakeholders for implementation and areas for further studies with regarding to Big Results Now in education sector for the sake of raising the quality of education and increasing examination pass rate in Primary and Secondary schools in Tanzania and Iringa municipal in particular.
UX-Lx -a tour of non-design deliverablesPeter Boersma
My UX Lisbon 2011 presentation "More Elements of User Experience - a tour of non-design deliverables" in which I showed the impact that non-design deliverables and processes (scope, pitch, positioning, skill sets, etc.) have on the user experience, and how designers can (and should) influence them.
Presented by:
Dr. Lisa D’Adamo-Weinstein, Director of Academic Support , SUNY Empire State College
Dr. Tacy Holliday, Governance Coordinator, Montgomery College, NCLCA Learning Center Leadership Level
Description: Measuring and evaluating student success is crucial to retention efforts and program development. Join us as we talk about the key elements necessary to measure student success in your tutoring and learning centers. We will assist you in developing an assessment plan for your own center.
Assessment Analytics - EUNIS 2015 E-Learning Task Force WorkshopLACE Project
This presentation is to introduce a discussion session at the 2015 EUNIS Congress workshop session of the E-Learning Task Force. The LACE Project is very briefly introduced, followed by an explanation of the presenter's view of learning analytics and a critique of some common themes. Assessment Analytics is presented as an antithesis to these themes and an assessment lifecycle model (used in the Jisc Electronic Management of Assessment Programme) is used to outline some ways in which assessment analytics can be realised, as stimulus for discussion.
Jisc learning analytics MASHEIN Jan 2017Paul Bailey
Jisc Learning Analytics presentation at Leading Digital Learning: Key Issues for Small and Specialist Institutions event organised by MASHEIN (Management of Small Higher
Education Institutions Network)
Distance Learning, Online Teaching [19+ Years]
• Possess substantial strengths in distance learning, adult education, teaching with technology, student and faculty relations, higher education, and curriculum development.
• Significant experience as an adjunct online faculty member, Core Faculty, Dissertation Chair, Committee Member, Curriculum Developer/Author, and Faculty Development Manager.
• Create a safe, respectful, and welcoming learning environment.
• Specialize in working with new students, first generation students, and academically under-prepared students.
• Developed an exceptional record of academic excellence, end-of-course evaluations, collaboration, communication, mentoring, coaching, and professionalism.
• Computer proficient with online classroom platforms that include WebCT, eCollege, Canvas, Sakai, Moodle, Educator, Desire2Learn, Blackboard, Brightspace and others.
Dissertation Chair and Mentor [Remote, 11+ years]
• Provide high quality instruction, direction and mentorship for assigned students throughout all phases of the dissertation process.
• Provide timely and supportive mentoring throughout the student’s process of developing, researching, writing, and revising the dissertation.
• Participate in the Defense process of a student’s Prospectus and final Dissertation.
• Facilitate the successful completion of all IRB protocols.
Faculty Development [Remote, 10+ years]
• Served as a Trainer and Mentor for New Faculty Members.
• Performed faculty peer reviews and assessed classes based upon best practices and adult learning theories.
• Inspired faculty to improve their facilitation practice by leading online faculty workshops.
Curriculum Development [Remote, 12+ years]
• Authored hundreds of courses as a SME for multiple schools, including undergraduate and graduate courses.
• Strong knowledge and application of adult cognitive learning theories and instructional design methodologies.
• Develop content and assessments that met learning objectives, including discussions and assignments.
Background Includes: Various Online Schools (08/05 – Present)
Online Instructor, Doctoral Committee Member, Dissertation Chair, Faculty Development, Curriculum Development.
Construct maps are important tools in educational assessment and can serve multiple purposes related to development and validation, as well as score interpretation and use. This chapter outlines a process for developing a construct map from the qualitative ordering of teachers’ responses to open-ended assessment items. The construct of interest pertains to a teacher’s ability to attend to what students say and do, which is a key component of many recommendations for instructional practice within mathematics education. The instrument we are developing is designed to measure teachers’ attentiveness to student thinking in quantitative reasoning problem situations. A key aspect of our instrument development process is the development of a construct map that hierarchically orders qualitatively different levels of teacher attentiveness. In this chapter we describe our process for developing the construct map with the intent of providing an example to others who may be interested in engaging in the development of construct maps.
Scholars across many disciplines have grappled with questions of what it means for a person to
be and interact online. Who are we when we go online? How do others know we are there and
how do they perceive us? Within the context of online learning, scholarly questions tend to
reflect more specific concerns focused on how well people can learn in a setting limited to
mediated interactions lacking various communication cues. For example, how can a teacher and
students come to know each other if they cannot see each other? How can they effectively
understand and communicate with each other if they are separated by space and, in many
instances, time? These concerns are related to issues of social presence and identity, both of
which are complex, multi-faceted, closely interrelated constructs.
In search of a better understanding of social presence: An investigation into...Patrick Lowenthal
Research on social presence and online learning continues to grow. But to date,
researchers continue to define and conceptualize social presence very
differently. For instance, at a basic level, some conceptualize social presence as
one of three presences within a Community of Inquiry, while others do not.
Given this problem, we analyzed how researchers in highly cited social
presence research defined social presence in an effort to better understand how
they are defining social presence and how this might be changing over time. In
this article, we report the results of our inquiry and conclude with implications
for future research and practice.
Open Access Journals in Educational Technology: Results of a Survey of Exper...Patrick Lowenthal
As the academic publishing industry evolves, there has been an unprecedented growth of “open access journals” (OAJs). In educational technology alone, with an estimated 250 or more total journals, nearly one-third are designated as “open.” Though OAJs are lauded for their contribution to social justice issues (reduction of subscription requirement barriers), many people are suspicious of the content found in them and question the legitimacy of publishing in them. In this study, we sought to discover the opinions of educational technology scholars about OAJs in their own field. We were able to learn which OAJs were deemed to be most valuable, as well as the characteristics of OAJs thought to be particularly important. A companion site accompanies this article, http://edtechjournals.org
In Search of Quality: Using Quality Matters to Analyze the Quality of Massive...Patrick Lowenthal
The concept of the massive, open, online course (MOOC) is not new, but high-profile initiatives have moved them into the forefront of higher education news over the past few years. Members of institutions of higher education have mixed feelings about MOOCs, ranging from those who want to offer college credit for the successful completion of MOOCs to those who fear MOOCs are the end of the university as we know it. We set forth to investigate the quality of MOOCs by using the Quality Matters quality control framework. In this paper, we present the results of our inquiry, with a specific focus on the implications the results have on day-today practice of designing online courses.
Getting graphic About Infographics: Design Lessons Learned From Popular Infog...Patrick Lowenthal
People learn and remember more efficiently and effectively through the use of text and visuals than through text alone. Infographics are one way of presenting complex and dense informational content in a way that supports cognitive processing, learning, and future recognition and recollection. But the power of infographics is that they are a way of delivering the maximum amount of content in the least amount of space while still being precise and clear; because they are visual presentations as opposed to oral or text presentations, they can quickly tell a story, show relationships, and reveal structure. The following paper reports on an exploration of top 20 “liked” infographics on a popular infographic sharing website in an effort to better understand what makes an effective infographic in order to better prepare graduate students as consumers and designers of infographics. The paper concludes with recommendations and strategies on how educators might leverage the power of infographics in their classrooms.
Intentional Web Presence for Research and Technology ProfessionalsPatrick Lowenthal
Intentionally creating a well-crafted online presence, sometimes called a web presence, is important not only for recent graduates but for any professional in a community of practice that values technology use and innovation (e.g., information technology, computer science, digital and graphic design); also, professionals who work with external stakeholders (e.g., consultants working with clients, teachers working with parents, artists working with customers and funding sources) benefit from attention to their web presence. In this presentation, I will share why professionals need to attend to their web presence and share some strategies for crafting the components of a vibrant and dynamic professional web presence and digital footprint.
AERA 2015 Instructional Design Lessons Learned From Reviewing Popular Infogra...Patrick Lowenthal
Infographics are one way of presenting complex and dense informational content in a way the supports cognitive processing, learning, and future recognition and recollection. Infographics, as the name implies, are a way of presenting information graphically. But the power of infographics is that they are a way of delivering the maximum amount of content in the least amount of space while still being precise and clear. In this session we will share the results of our inquiry into what makes an effective infographic. Derived from our inquiry, we will share recommendations on how educators might leverage the power of infographics in their classrooms, and assignments we now use with our students.
Online video is believed to help build social presence and community in online courses. But do students actually watch these videos? And what do they think of them? Do they always build social presence for every student? This mixed methods exploratory study investigates students’ perceptions of online video and the degree to which different uses of online video (e.g., video announcements, instructional screencasts, and video feedback) help establish and maintain social presence. The results of the study and the implications for faculty and instructional designers will be discussed in this session.
Intentional Web Presence for Educational Technology ProfessionalsPatrick Lowenthal
Educational technology professionals must be digitally literate. Part of this involves effectively managing one’s web presence. In this presentation, I will argue that educational technology professionals need to practice what they preach by attending to their web presence. I will share strategies for crafting the components of a vibrant and dynamic professional web presence such as creating a personal website, engaging in social networking, contributing and sharing resources/artifacts, and attending to search engine optimization (SEO).
PASSHE 2015: If You Record It, Will They Watch It? And Will It Matter? Explor...Patrick Lowenthal
If You Record It, Will They Watch It? And Will It Matter? Exploring Student Perceptions of Online Video
Online videos can help build presence and community in online courses. But do students actually watch these videos? The presenter will share his experience using asynchronous video (e.g., video announcements, video feedback) as well as share research on students perceptions of asynchronous video, while engaging the audience in their own use of rich media.
Welcome to TechSoup New Member Orientation and Q&A (May 2024).pdfTechSoup
In this webinar you will learn how your organization can access TechSoup's wide variety of product discount and donation programs. From hardware to software, we'll give you a tour of the tools available to help your nonprofit with productivity, collaboration, financial management, donor tracking, security, and more.
How to Make a Field invisible in Odoo 17Celine George
It is possible to hide or invisible some fields in odoo. Commonly using “invisible” attribute in the field definition to invisible the fields. This slide will show how to make a field invisible in odoo 17.
Biological screening of herbal drugs: Introduction and Need for
Phyto-Pharmacological Screening, New Strategies for evaluating
Natural Products, In vitro evaluation techniques for Antioxidants, Antimicrobial and Anticancer drugs. In vivo evaluation techniques
for Anti-inflammatory, Antiulcer, Anticancer, Wound healing, Antidiabetic, Hepatoprotective, Cardio protective, Diuretics and
Antifertility, Toxicity studies as per OECD guidelines
Palestine last event orientationfvgnh .pptxRaedMohamed3
An EFL lesson about the current events in Palestine. It is intended to be for intermediate students who wish to increase their listening skills through a short lesson in power point.
The French Revolution, which began in 1789, was a period of radical social and political upheaval in France. It marked the decline of absolute monarchies, the rise of secular and democratic republics, and the eventual rise of Napoleon Bonaparte. This revolutionary period is crucial in understanding the transition from feudalism to modernity in Europe.
For more information, visit-www.vavaclasses.com
Introduction to AI for Nonprofits with Tapp NetworkTechSoup
Dive into the world of AI! Experts Jon Hill and Tareq Monaur will guide you through AI's role in enhancing nonprofit websites and basic marketing strategies, making it easy to understand and apply.
Macroeconomics- Movie Location
This will be used as part of your Personal Professional Portfolio once graded.
Objective:
Prepare a presentation or a paper using research, basic comparative analysis, data organization and application of economic information. You will make an informed assessment of an economic climate outside of the United States to accomplish an entertainment industry objective.
Model Attribute Check Company Auto PropertyCeline George
In Odoo, the multi-company feature allows you to manage multiple companies within a single Odoo database instance. Each company can have its own configurations while still sharing common resources such as products, customers, and suppliers.
2. Session Description Life in the digital age swims in data. But how can we make use of data to improve learning?Take advantage of easy to use, free web tools to collect and analyze data in your course. Learn how to take the pulse of your teaching and student performance, and make adjustments during the term.
5. What is Learning Analytics? According to Wikipedia,"Learning analytics is the measurement, collection, analysis and reporting of data about learners and their contexts, for purposes of understanding and optimizing learning and the environments in which it occurs" .
6. What is Learning Analytics? According to Siemens,"Learning analytics is the use of intelligent data, learner-produced data, and analysis modelsto discover information and social connections, and to predict and advise on learning."
7. What is Learning Analytics? According to EDUCAUSE,“The use of data and models to predict student progress and performance, and the ability to act on that information”.
8. What is Learning Analytics? According to Horizon Report,“Learning analytics loosely joins a variety of data-gathering tools and analytic techniques to study student engagement, performance, and progress in practice, with the goal of using what is learned to revise curricula, teaching, and assessment in real time.”
12. Why Use Learning Analytics? Improve your end-of-course evaluations Help with tenure and promotion Decrease attrition Improve your teaching Improve student learning _____________________
13. Why Use Learning Analytics? Improve your end-of-course evaluations Help with tenure and promotion Decrease attrition Improve your teaching Improve student learning _____________________
14. Why Use Learning Analytics? Improve your end-of-course evaluations Help with tenure and promotion Decrease attrition Improve your teaching Improve student learning _____________________
15. Why Use Learning Analytics? Improve your end-of-course evaluations Help with tenure and promotion Decrease attrition Improve your teaching Improve student learning _____________________
16. Why Use Learning Analytics? Improve your end-of-course evaluations Help with tenure and promotion Decrease attrition Improve your teaching Improve student learning _____________________
17. Why Use Learning Analytics? Improve your end-of-course evaluations Help with tenure and promotion Decrease attrition Improve your teaching Improve student learning _____________________
22. Institutional Examples --Signals project at Purdue University (risk level for outreach)--The Ohio State University (video analytics) --Northern Arizona University (early alert)--Ball State University (feedback system)--University of Wollongong (visual discussions)
23. Things to Try --Descriptive Statistics From Exam Results --Detailed Individual Feedback During & After Exams --Performance Dashboard / User Activity --Path Builder / Adaptive Release --Google Forms --Polls
24. Resources 7 Things You should Know about analytics http://net.educause.edu/ir/library/pdf/ELI7059.pdf Academic analytics: a New Tool for a New erahttp://net.educause.edu/ir/library/pdf/erm0742.pdf The Horizon Reporthttp://net.educause.edu/ir/library/pdf/HR2011.pdf
Editor's Notes
The Horizon Report “Identifies and describes emerging technologies… for their potential impact on and use in teaching, learning, and creative inquiry”Time-to-adoption: One Year or Less--ebooks--mobilesTime-to-adoption: Two to Three Years--Augmented Reality--Game-based LearningTime-to-adoption: Four to Five Years--Gesture-based Computing--Learning Analytics
According to Horizon Report,“Learning analytics loosely joins a variety of data-gathering tools and analytic techniques to study student engagement, performance, and progress in practice, with the goal of using what is learned to revise curricula, teaching, and assessment in real time. Building on the kinds of information generated by Google Analytics and other similar tools, learning analytics aims to mobilize the power of data-mining tools in the service of learning, and embracing the complexity, diversity, and abundance of information that dynamic learning environments can generate.”
So all of these definitions are essentially focusing on four things:Collect DataAnalyze DataPredict LearningImprove Learning
Often it seems when people think about and talk about learning analytics, they seem to be thinking about it at the institutional level or school / college level (maybe even the program level), but I am going to focus more today on thinking about it at the course level.
“Data are collected from explicit student actions, such as completing assignments and taking exams, and from tacit actions, including online social interactions, extracurricular activities, posts on discussion forums, and other activities that are not directly assessed as part of the student’s educational progress.”“This information can include student profiles within an institution’s database, as well as the interactions of students within course management systems. A long absence from a course’s online activities, for example, can trigger faculty intervention. At its best, however, learning analytics goes much further than this, marrying information from disparate sources to create a far more robust and nuanced profile of students, in turn offering faculty members more insight. “The potential for learning is clear, but the technology to deliver that potential is still very young.
Examples from Horizon Reportsignals — stoplights to student successhttp://www.itap.purdue.edu/tlt/signals/The Signals system at Purdue University provides tools for faculty to identify and help students through analytical data mining.Initiated in 2007, Signals gathers information from SIS, course management systems, and course gradebooks generate a risk level for students, and those designated as at-risk are targeted for outreach. --The Ohio State University“the College of Nursing at The Ohio State University is able to track who is watching videos, how much they are viewing, and how they are viewing the content.”--Academic early alert and retention system (@ NAU)http://www4.nau.edu/ua/GPS/student/Northern Arizona University uses a guidance system for students aimed at improving student academic success and retention. The system provides feedback to students in four areas (attendance, grade, academics, and positive feedback). Depending on the feedback given, students are given options and pointed to resources to help them improve.--Learning analytics — Visualizing Collaborative Knowledge work http://emergingmediainitiative.com/project/learning-analytics/The Visualizing Collaboration Knowledge Work project at Ball State University is designed to visualize collaborative writing processes in order to support stronger formative evaluation. --http://research.uow.edu.au/learningnetworks/seeing/snapp/index.htmlThe University of Wollongong in Australia uses SNAPP, a software application that visualizes data from discussion forum posts to allow faculty to perceive behavioral patterns.