Download to read offline

![Developing A Construct Map for Attentiveness
11
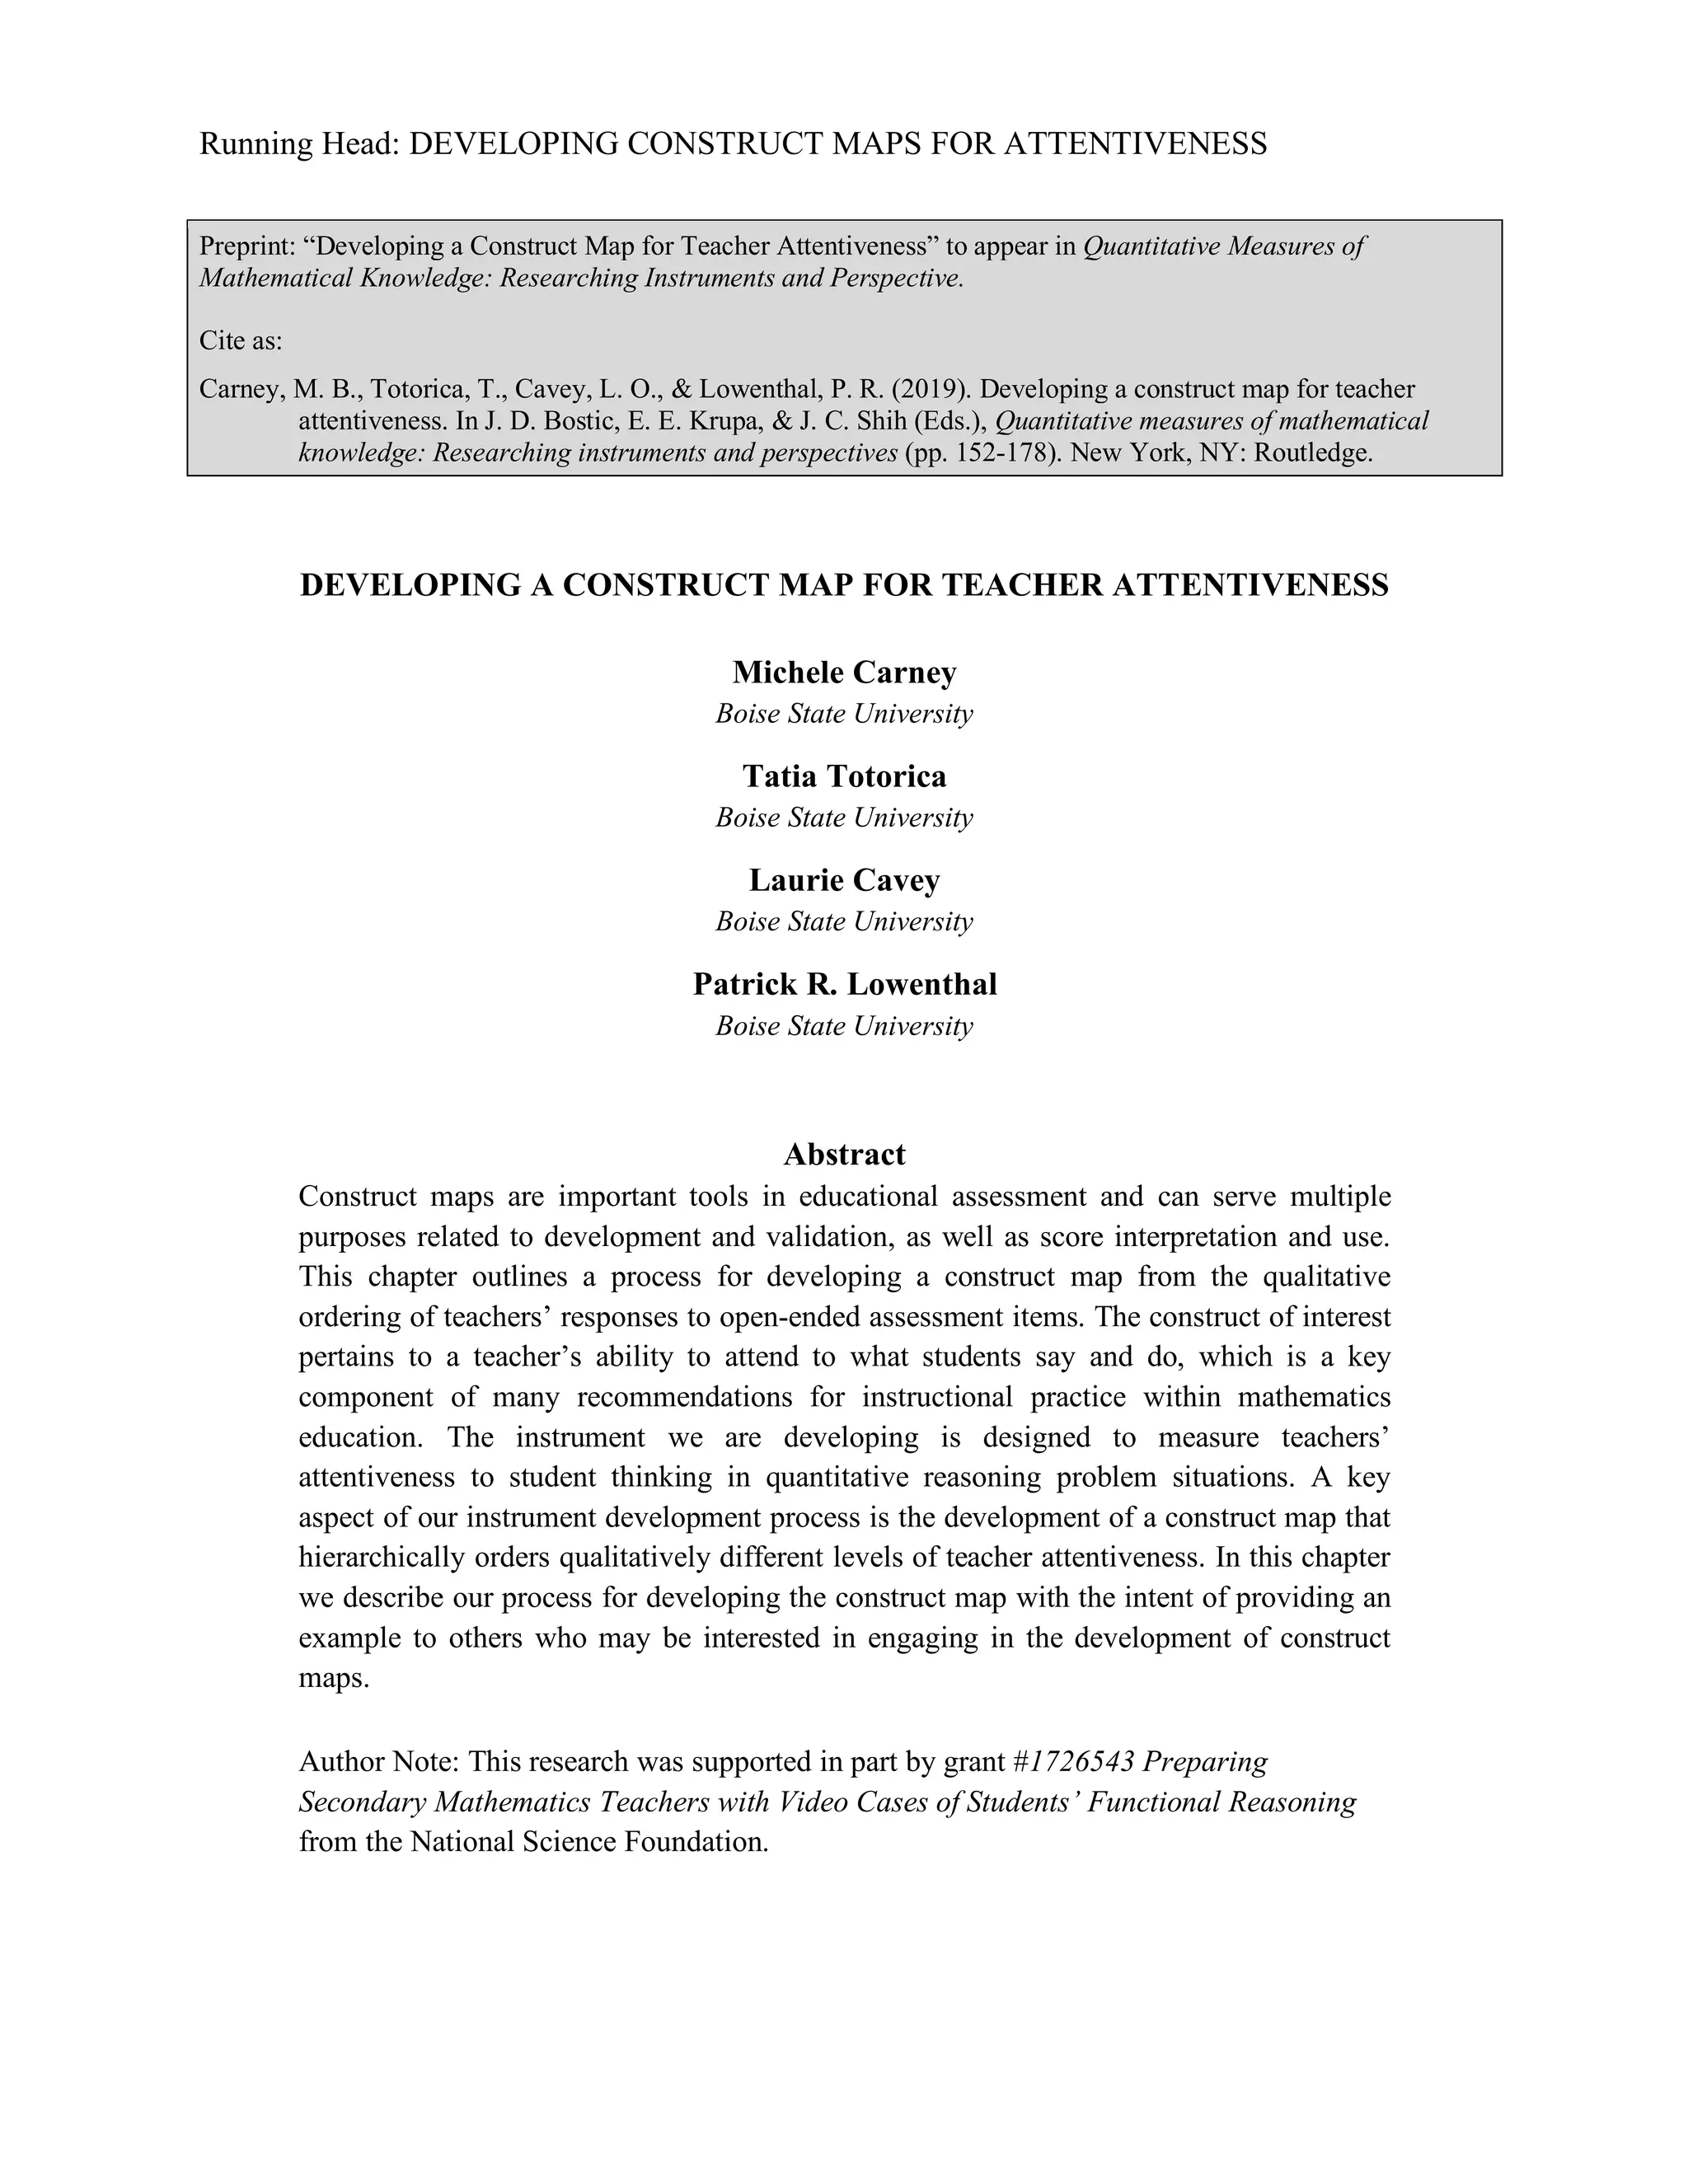
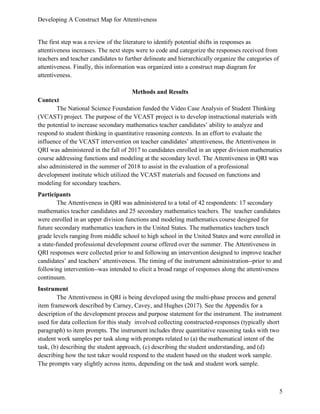
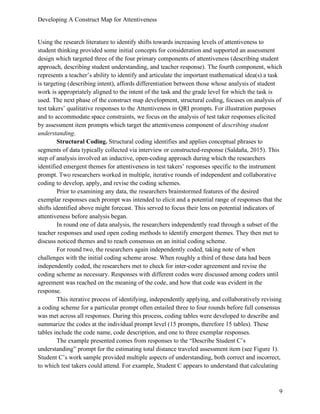
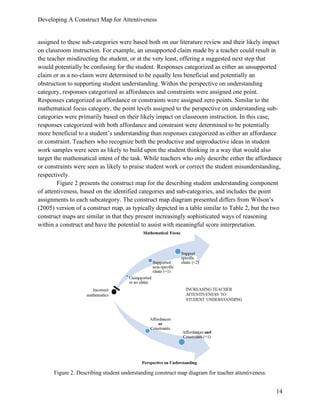
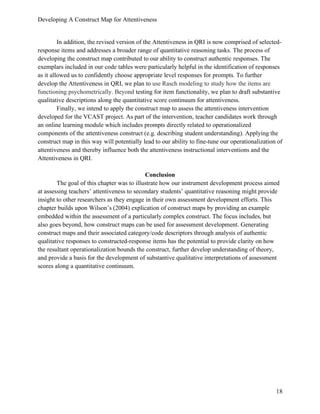
Table 1. Coding table for the student C understanding prompt for the estimating total distance traveled
assessment item.
Estimating total distance traveled from a time and speed graph: Describing student understanding
Code Name Code Description - Candidate response... Code Exemplar(s)
Describes aspects of what the student does understand
Points
Indicates that the student point selection is likely
not random but they don’t necessarily articulate
the likely reasoning.
- I am unsure of how they chose there [their] 7
points to look at though.
Distance
Calculation
Indicates the student knows or understands a
velocity (or speed) should be multiplied by a time
value to get distance.
- They understand that to find distance they need
to multiply a time by a speed.
- They have the basic idea right of multiplying
time and velocity to get distance.
Average
References student understanding of average
(related to calculation involving the 7 points)
- They understand how to average things in this
sense of add them up and then divide by how
many there are
Overgeneralize
Overgeneralizes student understanding in ways
that are not supported by the evidence.
- Student C understands how the axes and their
units relate to each other, this is shown by
multiplying the mph by the hours to get miles.-
Generic
Fails to explicitly reference either the student
approach or connect to the task intent
- It actually says a lot, this is a very interesting
approach to this problem
- How to read a graph
Describes aspects of what the student does NOT understand
Duration of
Speed
References student not taking into account the
length of time a particular speed was traveled.
- They, however, missed some critical ideas about
duration the vehicle was at certain speeds
- First and foremost, they do not account for the
"unevenness" of their sections, so averaging them
does not give a very good idea of the true average
speed
Total Time
References student mistake of using 12 (the last
time marked on the x-axis) instead of 6 (the
number of hours traveled) as the number of hours
traveled.
-They misread the graph, as it starts at 6 so there
are 6 total hours not 12.
Alternative
Approach
References an alternative approach the student
could have used to solve the problem.
- They used points that represented change in
speed rather than average speeds.
Overgeneralize
Overgeneralizes student (lack of) understanding
in ways that are not supported by the evidence.
- I think Student C was in a hurry to get this
problem done because they didn't pay much
attention to the starting point on the x-axis and
made some simple mistakes. It also would appear
that they do not understand what they are doing.
Formal
Identifies potential formal mathematical
(mis)understandings related to the task, but the
language used (e.g. area under the curve) is
beyond the scope of the task.
- Student C does not understand the relationship
between velocity and distance, or at least does not
connect the ideas of area under a velocity curve
and distance travelled.
Disparate
References (mis)understandings involving related
ideas (e.g., e.g. acceleration, position, direction of
movement, etc.) that are not the focus of the task
or explicitly evidenced in the student's work.
- no exemplars
Incorrect
Mathematics
Indicates an incorrect understanding of
mathematics, whether in the task itself or in the
student's work.
- This indicates that they don't know how to
interpret values based on the lines/curves of the
graph.](https://image.slidesharecdn.com/developingconstructmapsforattentiveness-190623185259/85/Developing-construct-maps-for-attentiveness-12-320.jpg)
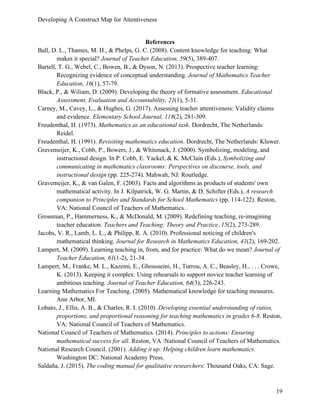

The document describes the development of a construct map for teacher attentiveness based on responses to open-ended assessment items. It involved the following steps: 1. The researchers reviewed literature to identify potential levels of attentiveness and coded responses from teachers and teacher candidates to assessment items. 2. The coded responses were organized into qualitative categories that were hierarchically ordered to show increasing levels of attentiveness. 3. The ordered categories were organized into a construct map diagram to operationalize the attentiveness construct and show how it is measured by the assessment. The goal was to provide an example of developing a construct map for a complex teaching skill based on open-ended response data.


![[1 8]designing instructional design emerging issues](https://cdn.slidesharecdn.com/ss_thumbnails/1-8designinginstructionaldesignemergingissues-120527021504-phpapp01-thumbnail.jpg?width=640&height=640&fit=bounds)


