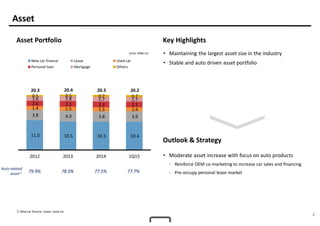
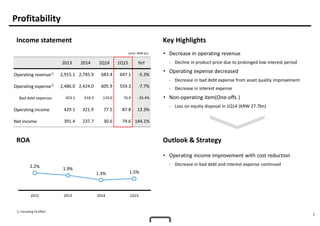
The document provides an overview of Hyundai Capital Services' financial results for the first quarter of 2015, including a moderate increase in assets focused on auto products, improved profitability from lower bad debt and interest expenses, and stable asset quality and capital levels maintained within regulatory guidelines. Key strategies mentioned include reinforcing auto sales and financing, pre-occupying the personal lease market, and sustaining strong risk management.

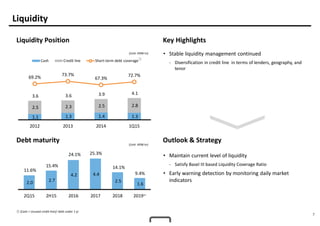
![8
(Unit: KRW bn,%) 2009 2010 2011 2012 2013 2014 1Q15
Domestic
auto market
Total (1,000 unit) 1,455 1,556 1,580 1,542 1,540 1,660 404
HMG M/S 76.7% 73.5% 74.5% 74.6% 71.4% 69.3% 66.8%
Asset portfolio
Total 16,480 18,788 19,806 20,286 20,397 20,323 20,220
Auto 81.1% 81.9% 82.8% 79.8% 78.3% 77.5% 77.7%
Non-auto 18.9% 18.1% 17.2% 20.2% 21.7% 22.5% 22.3%
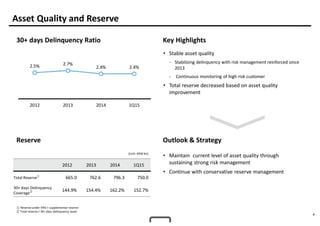
Asset quality
30+ days delinquency ratio 1.8% 1.6% 2.0% 2.5% 2.7% 2.4% 2.6%
90+ days delinquency ratio 1.0% 0.9% 1.1% 1.3% 1.7% 1.4% 1.4%
30+ days delinquency Coverage 152.7% 157.2% 151.3% 144.9% 154.4% 162.2% 152.7%
Profitability Operating income 541 667 660 595 429 322 75
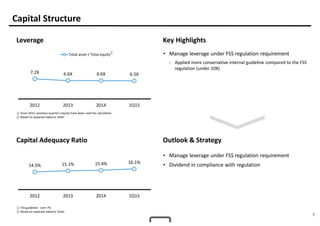
Capital structure①
Capital Adequacy Ratio 15.7% 13.7% 13.0% 14.5% 15.1% 15.4% 16.1%
Leverage 7.4X 9.3X 8.3X 7.2X 6.6X 6.6X 6.5X
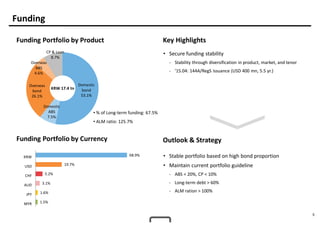
Funding portfolio
Total 14,378 16,560 17,330 17,338 17,755 17,795 17,386
Bond 65.6% 67.5% 72.0% 74.2% 76.1% 78.2% 79.2%
Loan 8.2% 7.4% 8.7% 9.4% 8.4% 7.8% 7.4%
CP 6.8% 8.5% 4.3% 3.4% 1.8% 1.1% 1.2%
ABS 19.4% 16.5% 15.0% 13.0% 13.6% 12.9% 12.1%
Short-term debt coverage 36.0% 39.1% 63.5% 69.2% 73.7% 67.3% 72.7%
ALM
ALM ratio 120.4% 138.0% 163.7% 148.0% 142.0% 132.0% 125.7%
Asset maturity (Y) 1.48 1.36 1.30 1.36 1.43 1.45 1.46
Debt maturity (Y) 1.78 1.87 2.12 2.02 2.03 1.92 1.84
① Based on separate balance sheet
[Appendix] Fact Sheet - HCS](https://image.slidesharecdn.com/irmaterial1q2015en-150601095907-lva1-app6892/85/Ir-material-1-q2015_en-9-320.jpg)