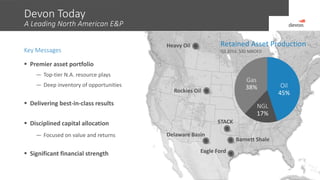
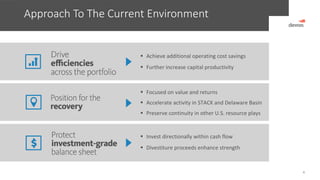
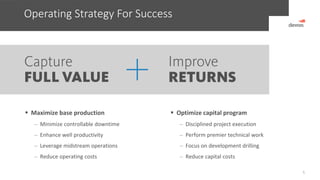
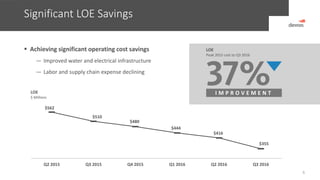
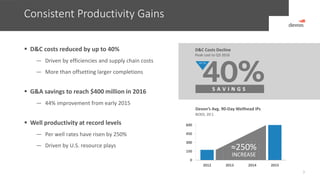
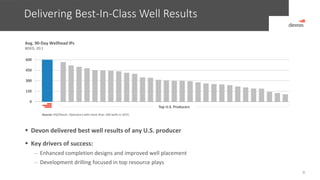
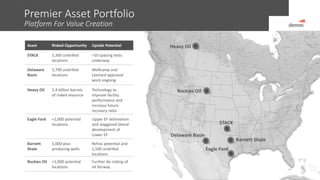
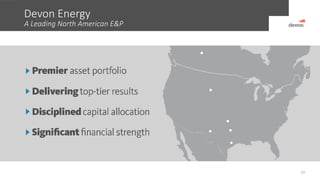
NYSE: DVN
devonenergy.com
Investor Presentation
November 2016
Investor Contacts & Notices
2
Investor Relations Contacts
Scott Coody, Vice President, Investor Relations
(405) 552-4735 / scott.coody@dvn.com
Chris Carr, Supervisor, Investor Relations
(405) 228-2496 / chris.carr@dvn.com
Forward-Looking Statements
This presentation includes "forward-looking statements" as defined by the Securities and Exchange Commission (the “SEC”). Such statements are subject to a variety of risks
and uncertainties that could cause actual results or developments to differ materially from those projected in the forward-looking statements. Please refer to the slide
entitled “Forward-Looking Statements” included in this presentation for other important information regarding such statements.
Use of Non-GAAP Information
This presentation may include non-GAAP financial measures. Such non-GAAP measures are not alternatives to GAAP measures, and you should not consider these non-GAAP
measures in isolation or as a substitute for analysis of our results as reported under GAAP. For additional disclosure regarding such non-GAAP measures, including
reconciliations to their most directly comparable GAAP measure, please refer to Devon’s most recent earnings release at www.devonenergy.com.
Cautionary Note to Investors
The SEC permits oil and gas companies, in their filings with the SEC, to disclose only proved, probable and possible reserves that meet the SEC's definitions for such terms, and
price and cost sensitivities for such reserves, and prohibits disclosure of resources that do not constitute such reserves. This presentation may contain certain terms, such as
resource potential, risked or unrisked resource, potential locations, risked or unrisked locations, exploration target size and other similar terms. These estimates are by their
nature more speculative than estimates of proved, probable and possible reserves and accordingly are subject to substantially greater risk of being actually realized. The SEC
guidelines strictly prohibit us from including these estimates in filings with the SEC. Investors are urged to consider closely the disclosure in our Form 10-K, available at
www.devonenergy.com. You can also obtain this form from the SEC by calling 1-800-SEC-0330 or from the SEC’s website at www.sec.gov.
Devon Today
A Leading North American E&P
3
Key Messages
 Premier asset portfolio
— Top-tier N.A. resource plays
— Deep inventory of opportunities
 Delivering best-in-class results
 Disciplined capital allocation
— Focused on value and returns
 Significant financial strength
Heavy Oil
Rockies Oil
Barnett Shale
STACK
Oil
45%
NGL
17%
Gas
38%
Retained Asset Production
Q3 2016: 550 MBOED
Delaware Basin
Eagle Ford
Approach To The Current Environment
4
 Achieve additional operating cost savings
 Further increase capital productivity
 Focused on value and returns
 Accelerate activity in STACK and Delaware Basin
 Preserve continuity in other U.S. resource plays
 Invest directionally within cash flow
 Divestiture proceeds enhance strength
Operating Strategy For Success
5
 Maximize base production
— Minimize controllable downtime
— Enhance well productivity
— Leverage midstream operations
— Reduce operating costs
 Optimize capital program
— Disciplined project execution
— Perform premier technical work
— Focus on development drilling
— Reduce capital costs
Significant LOE Savings
6
$562
$510
$480
$444
$416
$355
Q2 2015 Q3 2015 Q4 2015 Q1 2016 Q2 2016 Q3 2016
LOE
$ Millions
LOE
Peak 2015 cost to Q3 2016
I M P R O V E M E N T
 Achieving significant operating cost savings
— Improved water and electrical infrastructure
— Labor and supply chain expense declining
Consistent Productivity Gains
7
 D&C costs reduced by up to 40%
― Driven by efficiencies and supply chain costs
― More than offsetting larger completions
 G&A savings to reach $400 million in 2016
― 44% improvement from early 2015
 Well productivity at record levels
― Per well rates have risen by 250%
― Driven by U.S. resource plays
0
150
300
450
600
2012 2013 2014 2015
Devon’s Avg. 90-Day Wellhead IPs
BOED, 20:1
D&C Costs Decline
Peak cost to Q3 2016
S A V I N G S
UP TO
≈250%
INCREASE
Delivering Best-In-Class Well Results
8
Avg. 90-Day Wellhead IPs
BOED, 20:1
0
150
300
450
600
Top U.S. Producers
Source: IHS/Devon. Operators with more than 100 wells in 2015.
 Devon delivered best well results of any U.S. producer
 Key drivers of success:
— Enhanced completion designs and improved well placement
— Development drilling focused in top resource plays
Preliminary 2017 & 2018 Outlook
Accelerating Activity
9
(1) Growth rates compared to Q4 2016.
U . S . O I L G R O W T H (1)
2017e
0
10
20
30
40
2015 2016 2017
2015 2016 2017e
AT 9/30
RIGS
BY YEAR END 2016
RIGS
BY YEAR END 2017
RIGS
Rig Activity – U.S. Resource Plays
Operated Rigs
 Potential for 15-20 operated rigs in 2017
— Focused in STACK and Delaware Basin
— Invest directionally within cash flow
 Preliminary 2017 production targets(1)
— Double-digit U.S. oil growth
— Low to mid-single digit BOE growth
 Stronger growth expected in 2018
— At $60 WTI cash flow expands by >200% from
2016 levels
— Expect >30% STACK & Delaware top-line growth
Significant Financial Strength
10
 Investment-grade balance sheet
 No significant debt maturities until mid-2021
 Debt reduction program underway
― $1.2 billion tendered to date
― Adjusted net debt reduced 45% from 2015(1)
 Cash flow protected by hedges
― A third of expected of oil and gas production in 2017
(1) Adjusted net debt is a non-GAAP measure. See Q3 2016 earnings release for reconciliation.
Adjusted Net Debt (1)
9/30/16 vs. 12/31/15
D E C L I N E
Advantaged Midstream Business
11
 Devon’s equity ownership interest
― 24% of MLP (ENLK: 95 million units)
― 64% of GP (ENLC: 115 million units)
 Eliminates midstream capital requirements
 Improves midstream growth potential
 Provides visible cash flow stream
― Annual distributions: ≈$270 million
EnLink Overview
DVN’S ENLINK OWNERSHIP
BILLION
MARKET VALUE NOVEMBER 2016
 World-class development opportunity
— 430,000 net surface acres
— Top targets: Meramec & Woodford
— Q3 net production: 92 MBOED
 Acreage concentrated in core of play
 Provides visible long-term growth
 Accelerating activity
— Up to 6 operated rigs by year end
— Drilling focused in Meramec formation
— 2016 capital ≈$450 million
STACK
Best-In-Class Position
12
Canadian
Kingfisher
Blaine
Hunton
Woodford
Mississippian
Chester
Springer
Morrow
DevonianPenn.
Osage
Atoka
Meramec
Custer
Caddo
Meramec – Core Area
Woodford – Core Area
STACK Play
Dewey
STACK
A Multi-Decade Growth Opportunity
13
Largest leasehold position of any operator
Advantaged cost structure
Tremendous resource potential
430,000
265,000
203,000 183,000
115,000 110,000 92,000 86,000
STACK Acreage
Net Surface Acres
Peers
Source: Company and industry reports.
$6.24
$4.14
$4.43
$3.95 $4.03
Q3 2015 Q4 2015 Q1 2016 Q2 2016 Q3 2016
35%
IMPROVEMENT
STACK Unit LOE
$/BOE
RISKED LOCATIONS
STACK DRILLING INVENTORY
Strong production growth
STACK Production
MBOED
67
92
Q3 2015 Q3 2016
38%
INCREASE
Meramec
Results Validate Core Position
14
Over
Pressured
Oil
Liquids
Rich
Dry GasPlay Windows Normal
Pressured
Oil
Pressure Gradient (psi/ft.) >0.75 0.75 – 0.6 0.7 – 0.45 0.45 or less
Custer
Dewey
Canadian
Kingfisher
Blaine
Pony Express 27-1H
30-Day IP: 2,100 BOED Born Free Staggered Pilot
30-Day IP: 2,200 BOED
Scheffler 1H-9X
30-Day IP: 2,000 BOED
Blurton 1-7-6XH
30-Day IP: 1,800 BOED Maybel 1H-13X
30-Day IP: 1,900 BOED
Q3 2016 Wells
Cows Face 0805-4AH
30-Day IP: 2,200 BOED
Stiles 1407 2-4MH
30-Day IP: 1,900 BOED
Pump House 7-well Pattern
30-Day IP: 2,100 BOED
Wort 1-21H
30-Day IP: 2,400 BOEDAlma 5-Well Pilot
30-Day IP: 1,400 BOED
Parker 1-33H
30-Day IP: 2,000 BOED
Compton 1-2-35XH
30-Day IP: 2,200 BOED
Blue Ox 3130 -4AH
30-Day IP: 3,200 BOED
Marmot 19-1HX
30-Day IP: 2,600 BOED
Boomer 31-2AH
30-Day IP: 2,300 BOED
 Favorable characteristics of
core oil window:
1. Attractive reservoir properties
2. Strong flow rates due to high
pressure gradients
3. Oil-weighted production
 Record-setting well
productivity in Q3 2016
Meramec Core
Meramec
15
 Delivering industry-leading STACK results
— Meramec 30-day rates 50% above peers(1)
— Driven by legacy 5,000’ lateral design
 Future development to leverage long laterals
 Further enhances capital & well productivity
 Represents ≈60% of planned activity in 2017
Extended-Reach Laterals To Enhance Productivity
IP
EUR
D&C
1,600 - 2,000
MBOE
1,900 - 2,300
30-Day, BOED
$7.5 - 9.0
$MM
Meramec Over-Pressured Oil - 10,000’ Lateral
Type Well
OF 2017e ACTIVITY
EXTENDED-REACH
LATERALS
(1) Productivity per 1,000’ lateral. See Devon’s Q3 2016 operations report for additional detail.
Meramec
Tremendous Resource Opportunity
16
 Meramec inventory conservatively risked (4 wells per surface section)
 >10 spacing tests underway to drive risked location count higher
― First three Devon operated spacing pilots successful (Born Free, Alma and Pump House tests)
― Testing up to 8 wells per section across 1 interval in Meramec
― Staggered lateral pilots underway could further expand potential in Meramec
(1) Does not include upside potential from other target intervals within Meramec.
RISKED LOCATIONS
MERAMEC INVENTORY
Risked
MERAMEC
PrimarySecondary
Upside
Meramec Inventory(1)
Up to 8 wells/section3 wells/section
Up to 6 wells/section1 well/section
Woodford Shale
A Top-Tier Liquids-Rich Development
17
 Hobson Row completion activity underway
— 5-section development with ≈40 wells
— Peak rates expected in early 2017
 Jacobs development to leverage long laterals
— Development to commence drilling in mid-2017
— 13-section development with up to 70 wells
 Deep inventory of low-risk Woodford projects
— 3,700 risked locations
— Acreage concentrated in liquids-rich window
Woodford Eastern Core Activity
Woodford Core
Jacobs Row
Drilling to begin mid-2017
Hobson Row
≈40 Wells drilled (5-sections)
30-Day IPs: Expected early 2017
Canadian
Kingfisher
Blaine
IP
EUR
D&C
1,600
MBOE
1,500
30-Day, BOED
$6.0 - 6.5
$MM
OIL
30-DAY IP RATES
Delaware Basin
A World-Class Oil Play
18
 Industry leader in basin
— Net risked acres by formation: 670,000
— Q3 net production: 59 MBOED
 LOE reduced 54% from peak 2015 rates
 Deep inventory of low-risk oil projects
— 5,700 risked locations
— Significant upside (>20,000 unrisked)
 Acreage position concentrated in basin of
southeast New Mexico
Eddy
Lea
S L O P E
B A S I N
Reeves
Loving Winkler
Ward
Bone Spring
285,000 net acres
Wolfcamp
225,000 net acres
Leonard Shale
60,000 net acres
Delaware Sands
80,000 net acres
60%
Delaware Basin
Accelerating Activity
19
0
5
10
15
2015 2016 2017
2015 2016 2017e
 On track to operate 3 rigs by end
of 2016
— Stabilize production by early
2017
 Ramping up to as many as 10
rigs by end of 2017
— Position to resume strong
production growth
 Activity focused on Bone Spring,
Leonard and Wolfcamp
Delaware Basin Rig Activity
Operated Rigs
BY YEAR END 2016
RIGS
BY YEAR END 2017
RIGS
Delaware Basin
Growing Resource Opportunity
20
 Identified 5,700 risked locations
— Bone Spring ≈60% of risked inventory
— Massive upside with >20,000 unrisked locations
 Appraisal work evaluating resource upside
— Evaluating tighter Bone Spring spacing
— Leonard Shale has staggered lateral potential
— Wolfcamp appraisal activity to increase in 2017
 Results to optimize master development plan
Note: Graphic for illustrative purposes only and not necessarily representative across Devon’s entire acreage position.
Basin Slope
DELAWARE
SANDS
Madera
Lower
Brushy
LEONARD
A
B
C
BONESPRING
1st
2nd
(Upper &
Lower)
3rd
WOLFCAMP
X/Y
A, B, C
& D
Risked Location Unrisked Location
1 Section 1 Section
Delaware Basin Master Development Plan
Total Reservoir Access Concept (TRAC)
21
 A disciplined development approach to drive
returns higher
— More efficient permitting process
— Minimizes surface disturbance
— Utilizes integrated surface facilities
— Flexibility to add/defer development zones
— Allows for simultaneous operations
 TRAC project progressing
— Planning and initial permitting phase complete
— All new activity to incorporate TRAC concept
Premier Asset Portfolio
Platform For Value Creation
22
Asset Risked Opportunity Upside Potential
STACK 5,300 undrilled
locations
>10 spacing tests
underway
Delaware
Basin
5,700 undrilled
locations
Wolfcamp and
Leonard appraisal
work ongoing
Heavy Oil 1.4 billion barrels
of risked resource
Technology to
improve facility
performance and
increase future
recovery rates
Eagle Ford ≈1,000 potential
locations
Upper EF delineation
and staggered lateral
development of
Lower EF
Barnett
Shale
5,000-plus
producing wells
Refrac potential and
1,500 undrilled
locations
Rockies Oil >1,000 potential
locations
Further de-risking of
oil fairway
Heavy Oil
Rockies Oil
Barnett Shale
STACK
Delaware Basin
Eagle Ford
Devon Energy
A Leading North American E&P
23
Thank you.
24
Forward-Looking Statements
25
This presentation includes "forward-looking statements" as defined by the SEC. Such statements include those concerning strategic plans, expectations and objectives for future
operations, and are often identified by use of the words “expects,” “believes,” “will,” “would,” “could,” “forecasts,” “projections,” “estimates,” “plans,” “expectations,”
“targets,” “opportunities,” “potential,” “anticipates,” “outlook” and other similar terminology. All statements, other than statements of historical facts, included in this
presentation that address activities, events or developments that the Company expects, believes or anticipates will or may occur in the future are forward-looking statements.
Such statements are subject to a number of assumptions, risks and uncertainties, many of which are beyond the control of the Company. Statements regarding our business
and operations are subject to all of the risks and uncertainties normally incident to the exploration for and development and production of oil and gas. These risks include, but
are not limited to: the volatility of oil, gas and NGL prices, including the currently depressed commodity price environment; uncertainties inherent in estimating oil, gas and NGL
reserves; the extent to which we are successful in acquiring and discovering additional reserves; the uncertainties, costs and risks involved in exploration and development
activities; risks related to our hedging activities; counterparty credit risks; regulatory restrictions, compliance costs and other risks relating to governmental regulation, including
with respect to environmental matters; risks relating to our indebtedness; our ability to successfully complete mergers, acquisitions and divestitures; the extent to which
insurance covers any losses we may experience; our limited control over third parties who operate our oil and gas properties; midstream capacity constraints and potential
interruptions in production; competition for leases, materials, people and capital; cyberattacks targeting our systems and infrastructure; and any of the other risks and
uncertainties identified in our Form 10-K and our other filings with the SEC. Investors are cautioned that any such statements are not guarantees of future performance and
that actual results or developments may differ materially from those projected in the forward-looking statements. The forward-looking statements in this presentation are
made as of the date of this presentation, even if subsequently made available by Devon on its website or otherwise. Devon does not undertake any obligation to update the
forward-looking statements as a result of new information, future events or otherwise.
NYSE: DVN
devonenergy.com
Appendix
Canadian Heavy Oil
27
 Top-tier thermal oil position
— High reservoir quality: <2.5 SOR(1)
— Massive risked resource: 1.4 BBO
 Significant leverage to higher prices
— $1 increase in WTI ≈$40 MM of annual cash
flow
 Jackfish complex oil production up 23% YoY
 70% decline in LOE from peak rates
(1) Current steam-to-oil ratio for Jackfish complex.
Thermal Heavy Oil Projects
Operational Projects
Eagle Ford
28
 Top-tier acreage position
— 66,000 net acres focused in DeWitt Co.
— Q3 net production: 61 MBOED (77% liquids)
 Expect ≈$350 million of free cash flow in 2016
— Best-in-class well productivity
— Low-cost asset: LOE <$5 per BOE
 Staggered lateral development to expand
inventory
 Completion activity underway
— Reduce DUCs to ≈40 in 1H 2017
2016e FREE CASH FLOW
MILLION
CRETACEOUS
AUSTIN CHALK
UPPER EAGLE
FORD SHALE
LOWER EAGLE
FORD SHALE
BUDA
DEL RIO
Staggered Lateral Development
(9-well pattern testing up to 18 wells per section)
880’440’
Rockies
29
Johnson
Campbell
Converse
Weston
Niobrara
Natrona
 Premier Powder River position
— ≈470,000 net surface acres
— Q3 net production: 16 MBOED (73% oil)
 ≈50% decline in LOE from early 2016
 Drilling activity resumed in the Power River
— Targeting Parkman, Teapot and Turner
formations
Parkman
Turner
Teapot
Initial Powder River Focus Areas
Barnett Shale
30
Wise
Parker
TarrantFT. WORTH
Denton
DENTON
 Significant gas optionality
— Net acres: 610,000
— Q3 net production: 166 MBOED (27% liquids)
 Future development activity to unlock
significant value
— Identified 1,000 horizontal refrac locations
— Improved rig economics for 1,500 undrilled
locations Horizontal Refrac
Undrilled Location
Future Development

November Investor Presentation

  • 1.
  • 2.
    Investor Contacts &Notices 2 Investor Relations Contacts Scott Coody, Vice President, Investor Relations (405) 552-4735 / scott.coody@dvn.com Chris Carr, Supervisor, Investor Relations (405) 228-2496 / chris.carr@dvn.com Forward-Looking Statements This presentation includes "forward-looking statements" as defined by the Securities and Exchange Commission (the “SEC”). Such statements are subject to a variety of risks and uncertainties that could cause actual results or developments to differ materially from those projected in the forward-looking statements. Please refer to the slide entitled “Forward-Looking Statements” included in this presentation for other important information regarding such statements. Use of Non-GAAP Information This presentation may include non-GAAP financial measures. Such non-GAAP measures are not alternatives to GAAP measures, and you should not consider these non-GAAP measures in isolation or as a substitute for analysis of our results as reported under GAAP. For additional disclosure regarding such non-GAAP measures, including reconciliations to their most directly comparable GAAP measure, please refer to Devon’s most recent earnings release at www.devonenergy.com. Cautionary Note to Investors The SEC permits oil and gas companies, in their filings with the SEC, to disclose only proved, probable and possible reserves that meet the SEC's definitions for such terms, and price and cost sensitivities for such reserves, and prohibits disclosure of resources that do not constitute such reserves. This presentation may contain certain terms, such as resource potential, risked or unrisked resource, potential locations, risked or unrisked locations, exploration target size and other similar terms. These estimates are by their nature more speculative than estimates of proved, probable and possible reserves and accordingly are subject to substantially greater risk of being actually realized. The SEC guidelines strictly prohibit us from including these estimates in filings with the SEC. Investors are urged to consider closely the disclosure in our Form 10-K, available at www.devonenergy.com. You can also obtain this form from the SEC by calling 1-800-SEC-0330 or from the SEC’s website at www.sec.gov.
  • 3.
    Devon Today A LeadingNorth American E&P 3 Key Messages  Premier asset portfolio — Top-tier N.A. resource plays — Deep inventory of opportunities  Delivering best-in-class results  Disciplined capital allocation — Focused on value and returns  Significant financial strength Heavy Oil Rockies Oil Barnett Shale STACK Oil 45% NGL 17% Gas 38% Retained Asset Production Q3 2016: 550 MBOED Delaware Basin Eagle Ford
  • 4.
    Approach To TheCurrent Environment 4  Achieve additional operating cost savings  Further increase capital productivity  Focused on value and returns  Accelerate activity in STACK and Delaware Basin  Preserve continuity in other U.S. resource plays  Invest directionally within cash flow  Divestiture proceeds enhance strength
  • 5.
    Operating Strategy ForSuccess 5  Maximize base production — Minimize controllable downtime — Enhance well productivity — Leverage midstream operations — Reduce operating costs  Optimize capital program — Disciplined project execution — Perform premier technical work — Focus on development drilling — Reduce capital costs
  • 6.
    Significant LOE Savings 6 $562 $510 $480 $444 $416 $355 Q22015 Q3 2015 Q4 2015 Q1 2016 Q2 2016 Q3 2016 LOE $ Millions LOE Peak 2015 cost to Q3 2016 I M P R O V E M E N T  Achieving significant operating cost savings — Improved water and electrical infrastructure — Labor and supply chain expense declining
  • 7.
    Consistent Productivity Gains 7 D&C costs reduced by up to 40% ― Driven by efficiencies and supply chain costs ― More than offsetting larger completions  G&A savings to reach $400 million in 2016 ― 44% improvement from early 2015  Well productivity at record levels ― Per well rates have risen by 250% ― Driven by U.S. resource plays 0 150 300 450 600 2012 2013 2014 2015 Devon’s Avg. 90-Day Wellhead IPs BOED, 20:1 D&C Costs Decline Peak cost to Q3 2016 S A V I N G S UP TO ≈250% INCREASE
  • 8.
    Delivering Best-In-Class WellResults 8 Avg. 90-Day Wellhead IPs BOED, 20:1 0 150 300 450 600 Top U.S. Producers Source: IHS/Devon. Operators with more than 100 wells in 2015.  Devon delivered best well results of any U.S. producer  Key drivers of success: — Enhanced completion designs and improved well placement — Development drilling focused in top resource plays
  • 9.
    Preliminary 2017 &2018 Outlook Accelerating Activity 9 (1) Growth rates compared to Q4 2016. U . S . O I L G R O W T H (1) 2017e 0 10 20 30 40 2015 2016 2017 2015 2016 2017e AT 9/30 RIGS BY YEAR END 2016 RIGS BY YEAR END 2017 RIGS Rig Activity – U.S. Resource Plays Operated Rigs  Potential for 15-20 operated rigs in 2017 — Focused in STACK and Delaware Basin — Invest directionally within cash flow  Preliminary 2017 production targets(1) — Double-digit U.S. oil growth — Low to mid-single digit BOE growth  Stronger growth expected in 2018 — At $60 WTI cash flow expands by >200% from 2016 levels — Expect >30% STACK & Delaware top-line growth
  • 10.
    Significant Financial Strength 10 Investment-grade balance sheet  No significant debt maturities until mid-2021  Debt reduction program underway ― $1.2 billion tendered to date ― Adjusted net debt reduced 45% from 2015(1)  Cash flow protected by hedges ― A third of expected of oil and gas production in 2017 (1) Adjusted net debt is a non-GAAP measure. See Q3 2016 earnings release for reconciliation. Adjusted Net Debt (1) 9/30/16 vs. 12/31/15 D E C L I N E
  • 11.
    Advantaged Midstream Business 11 Devon’s equity ownership interest ― 24% of MLP (ENLK: 95 million units) ― 64% of GP (ENLC: 115 million units)  Eliminates midstream capital requirements  Improves midstream growth potential  Provides visible cash flow stream ― Annual distributions: ≈$270 million EnLink Overview DVN’S ENLINK OWNERSHIP BILLION MARKET VALUE NOVEMBER 2016
  • 12.
     World-class developmentopportunity — 430,000 net surface acres — Top targets: Meramec & Woodford — Q3 net production: 92 MBOED  Acreage concentrated in core of play  Provides visible long-term growth  Accelerating activity — Up to 6 operated rigs by year end — Drilling focused in Meramec formation — 2016 capital ≈$450 million STACK Best-In-Class Position 12 Canadian Kingfisher Blaine Hunton Woodford Mississippian Chester Springer Morrow DevonianPenn. Osage Atoka Meramec Custer Caddo Meramec – Core Area Woodford – Core Area STACK Play Dewey
  • 13.
    STACK A Multi-Decade GrowthOpportunity 13 Largest leasehold position of any operator Advantaged cost structure Tremendous resource potential 430,000 265,000 203,000 183,000 115,000 110,000 92,000 86,000 STACK Acreage Net Surface Acres Peers Source: Company and industry reports. $6.24 $4.14 $4.43 $3.95 $4.03 Q3 2015 Q4 2015 Q1 2016 Q2 2016 Q3 2016 35% IMPROVEMENT STACK Unit LOE $/BOE RISKED LOCATIONS STACK DRILLING INVENTORY Strong production growth STACK Production MBOED 67 92 Q3 2015 Q3 2016 38% INCREASE
  • 14.
    Meramec Results Validate CorePosition 14 Over Pressured Oil Liquids Rich Dry GasPlay Windows Normal Pressured Oil Pressure Gradient (psi/ft.) >0.75 0.75 – 0.6 0.7 – 0.45 0.45 or less Custer Dewey Canadian Kingfisher Blaine Pony Express 27-1H 30-Day IP: 2,100 BOED Born Free Staggered Pilot 30-Day IP: 2,200 BOED Scheffler 1H-9X 30-Day IP: 2,000 BOED Blurton 1-7-6XH 30-Day IP: 1,800 BOED Maybel 1H-13X 30-Day IP: 1,900 BOED Q3 2016 Wells Cows Face 0805-4AH 30-Day IP: 2,200 BOED Stiles 1407 2-4MH 30-Day IP: 1,900 BOED Pump House 7-well Pattern 30-Day IP: 2,100 BOED Wort 1-21H 30-Day IP: 2,400 BOEDAlma 5-Well Pilot 30-Day IP: 1,400 BOED Parker 1-33H 30-Day IP: 2,000 BOED Compton 1-2-35XH 30-Day IP: 2,200 BOED Blue Ox 3130 -4AH 30-Day IP: 3,200 BOED Marmot 19-1HX 30-Day IP: 2,600 BOED Boomer 31-2AH 30-Day IP: 2,300 BOED  Favorable characteristics of core oil window: 1. Attractive reservoir properties 2. Strong flow rates due to high pressure gradients 3. Oil-weighted production  Record-setting well productivity in Q3 2016 Meramec Core
  • 15.
    Meramec 15  Delivering industry-leadingSTACK results — Meramec 30-day rates 50% above peers(1) — Driven by legacy 5,000’ lateral design  Future development to leverage long laterals  Further enhances capital & well productivity  Represents ≈60% of planned activity in 2017 Extended-Reach Laterals To Enhance Productivity IP EUR D&C 1,600 - 2,000 MBOE 1,900 - 2,300 30-Day, BOED $7.5 - 9.0 $MM Meramec Over-Pressured Oil - 10,000’ Lateral Type Well OF 2017e ACTIVITY EXTENDED-REACH LATERALS (1) Productivity per 1,000’ lateral. See Devon’s Q3 2016 operations report for additional detail.
  • 16.
    Meramec Tremendous Resource Opportunity 16 Meramec inventory conservatively risked (4 wells per surface section)  >10 spacing tests underway to drive risked location count higher ― First three Devon operated spacing pilots successful (Born Free, Alma and Pump House tests) ― Testing up to 8 wells per section across 1 interval in Meramec ― Staggered lateral pilots underway could further expand potential in Meramec (1) Does not include upside potential from other target intervals within Meramec. RISKED LOCATIONS MERAMEC INVENTORY Risked MERAMEC PrimarySecondary Upside Meramec Inventory(1) Up to 8 wells/section3 wells/section Up to 6 wells/section1 well/section
  • 17.
    Woodford Shale A Top-TierLiquids-Rich Development 17  Hobson Row completion activity underway — 5-section development with ≈40 wells — Peak rates expected in early 2017  Jacobs development to leverage long laterals — Development to commence drilling in mid-2017 — 13-section development with up to 70 wells  Deep inventory of low-risk Woodford projects — 3,700 risked locations — Acreage concentrated in liquids-rich window Woodford Eastern Core Activity Woodford Core Jacobs Row Drilling to begin mid-2017 Hobson Row ≈40 Wells drilled (5-sections) 30-Day IPs: Expected early 2017 Canadian Kingfisher Blaine IP EUR D&C 1,600 MBOE 1,500 30-Day, BOED $6.0 - 6.5 $MM OIL 30-DAY IP RATES
  • 18.
    Delaware Basin A World-ClassOil Play 18  Industry leader in basin — Net risked acres by formation: 670,000 — Q3 net production: 59 MBOED  LOE reduced 54% from peak 2015 rates  Deep inventory of low-risk oil projects — 5,700 risked locations — Significant upside (>20,000 unrisked)  Acreage position concentrated in basin of southeast New Mexico Eddy Lea S L O P E B A S I N Reeves Loving Winkler Ward Bone Spring 285,000 net acres Wolfcamp 225,000 net acres Leonard Shale 60,000 net acres Delaware Sands 80,000 net acres 60%
  • 19.
    Delaware Basin Accelerating Activity 19 0 5 10 15 20152016 2017 2015 2016 2017e  On track to operate 3 rigs by end of 2016 — Stabilize production by early 2017  Ramping up to as many as 10 rigs by end of 2017 — Position to resume strong production growth  Activity focused on Bone Spring, Leonard and Wolfcamp Delaware Basin Rig Activity Operated Rigs BY YEAR END 2016 RIGS BY YEAR END 2017 RIGS
  • 20.
    Delaware Basin Growing ResourceOpportunity 20  Identified 5,700 risked locations — Bone Spring ≈60% of risked inventory — Massive upside with >20,000 unrisked locations  Appraisal work evaluating resource upside — Evaluating tighter Bone Spring spacing — Leonard Shale has staggered lateral potential — Wolfcamp appraisal activity to increase in 2017  Results to optimize master development plan Note: Graphic for illustrative purposes only and not necessarily representative across Devon’s entire acreage position. Basin Slope DELAWARE SANDS Madera Lower Brushy LEONARD A B C BONESPRING 1st 2nd (Upper & Lower) 3rd WOLFCAMP X/Y A, B, C & D Risked Location Unrisked Location 1 Section 1 Section
  • 21.
    Delaware Basin MasterDevelopment Plan Total Reservoir Access Concept (TRAC) 21  A disciplined development approach to drive returns higher — More efficient permitting process — Minimizes surface disturbance — Utilizes integrated surface facilities — Flexibility to add/defer development zones — Allows for simultaneous operations  TRAC project progressing — Planning and initial permitting phase complete — All new activity to incorporate TRAC concept
  • 22.
    Premier Asset Portfolio PlatformFor Value Creation 22 Asset Risked Opportunity Upside Potential STACK 5,300 undrilled locations >10 spacing tests underway Delaware Basin 5,700 undrilled locations Wolfcamp and Leonard appraisal work ongoing Heavy Oil 1.4 billion barrels of risked resource Technology to improve facility performance and increase future recovery rates Eagle Ford ≈1,000 potential locations Upper EF delineation and staggered lateral development of Lower EF Barnett Shale 5,000-plus producing wells Refrac potential and 1,500 undrilled locations Rockies Oil >1,000 potential locations Further de-risking of oil fairway Heavy Oil Rockies Oil Barnett Shale STACK Delaware Basin Eagle Ford
  • 23.
    Devon Energy A LeadingNorth American E&P 23
  • 24.
  • 25.
    Forward-Looking Statements 25 This presentationincludes "forward-looking statements" as defined by the SEC. Such statements include those concerning strategic plans, expectations and objectives for future operations, and are often identified by use of the words “expects,” “believes,” “will,” “would,” “could,” “forecasts,” “projections,” “estimates,” “plans,” “expectations,” “targets,” “opportunities,” “potential,” “anticipates,” “outlook” and other similar terminology. All statements, other than statements of historical facts, included in this presentation that address activities, events or developments that the Company expects, believes or anticipates will or may occur in the future are forward-looking statements. Such statements are subject to a number of assumptions, risks and uncertainties, many of which are beyond the control of the Company. Statements regarding our business and operations are subject to all of the risks and uncertainties normally incident to the exploration for and development and production of oil and gas. These risks include, but are not limited to: the volatility of oil, gas and NGL prices, including the currently depressed commodity price environment; uncertainties inherent in estimating oil, gas and NGL reserves; the extent to which we are successful in acquiring and discovering additional reserves; the uncertainties, costs and risks involved in exploration and development activities; risks related to our hedging activities; counterparty credit risks; regulatory restrictions, compliance costs and other risks relating to governmental regulation, including with respect to environmental matters; risks relating to our indebtedness; our ability to successfully complete mergers, acquisitions and divestitures; the extent to which insurance covers any losses we may experience; our limited control over third parties who operate our oil and gas properties; midstream capacity constraints and potential interruptions in production; competition for leases, materials, people and capital; cyberattacks targeting our systems and infrastructure; and any of the other risks and uncertainties identified in our Form 10-K and our other filings with the SEC. Investors are cautioned that any such statements are not guarantees of future performance and that actual results or developments may differ materially from those projected in the forward-looking statements. The forward-looking statements in this presentation are made as of the date of this presentation, even if subsequently made available by Devon on its website or otherwise. Devon does not undertake any obligation to update the forward-looking statements as a result of new information, future events or otherwise.
  • 26.
  • 27.
    Canadian Heavy Oil 27 Top-tier thermal oil position — High reservoir quality: <2.5 SOR(1) — Massive risked resource: 1.4 BBO  Significant leverage to higher prices — $1 increase in WTI ≈$40 MM of annual cash flow  Jackfish complex oil production up 23% YoY  70% decline in LOE from peak rates (1) Current steam-to-oil ratio for Jackfish complex. Thermal Heavy Oil Projects Operational Projects
  • 28.
    Eagle Ford 28  Top-tieracreage position — 66,000 net acres focused in DeWitt Co. — Q3 net production: 61 MBOED (77% liquids)  Expect ≈$350 million of free cash flow in 2016 — Best-in-class well productivity — Low-cost asset: LOE <$5 per BOE  Staggered lateral development to expand inventory  Completion activity underway — Reduce DUCs to ≈40 in 1H 2017 2016e FREE CASH FLOW MILLION CRETACEOUS AUSTIN CHALK UPPER EAGLE FORD SHALE LOWER EAGLE FORD SHALE BUDA DEL RIO Staggered Lateral Development (9-well pattern testing up to 18 wells per section) 880’440’
  • 29.
    Rockies 29 Johnson Campbell Converse Weston Niobrara Natrona  Premier PowderRiver position — ≈470,000 net surface acres — Q3 net production: 16 MBOED (73% oil)  ≈50% decline in LOE from early 2016  Drilling activity resumed in the Power River — Targeting Parkman, Teapot and Turner formations Parkman Turner Teapot Initial Powder River Focus Areas
  • 30.
    Barnett Shale 30 Wise Parker TarrantFT. WORTH Denton DENTON Significant gas optionality — Net acres: 610,000 — Q3 net production: 166 MBOED (27% liquids)  Future development activity to unlock significant value — Identified 1,000 horizontal refrac locations — Improved rig economics for 1,500 undrilled locations Horizontal Refrac Undrilled Location Future Development