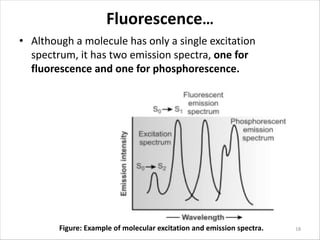
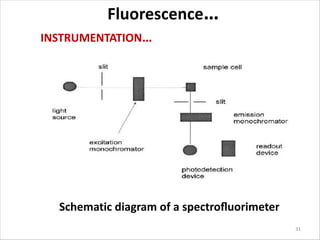
Chapter 2
Fluorescence Spectroscopy
1
Key points
Principles
• Certain molecules, particularly those with a chromophore
and a rigid structure, can be excited by UV/visible radiation,
and will then emit the radiation absorbed at a longer
wavelength. The radiation emitted can then be measured.
Applications
• Determination of fluorescent drugs in low-dose
formulations in the presence of non-fluorescent excipients.
• In carrying out limit tests where the impurity is fluorescent
or can be simply rendered fluorescent.
• Useful for studying the binding of drugs to components in
complex formulations
• Widely used in bioanalysis for measuring small amounts of
drug and for studying drug-protein binding.
2
KEYPOINTS (Continued)
Strengths
• A selective detection method and can be used to quantify a
strongly fluorescent compound in the presence of a larger
amount of non-fluorescent material.
• Can be used to monitor changes in complex molecules such
as proteins, which are being used increasingly as drugs.
Limitations
• The technique only applies to a limited number of
molecules.
• Fluorescence is subject to interference by UV-absorbing
species, heavy ions in solution, and is affected by
temperature.
3
Introduction
• Luminescence spectroscopy is an analytical method
derived from the emission of light by molecules which
have become electronically excited subsequent to the
absorption of visible or ultraviolet radiation.
•
• Due to its high analytical sensitivity (concentrations of
luminescent analytes (1x10⁻⁹ moles/L) are routinely
deter-mined),
– this technique is widely employed in the analysis of
drugs and metabolites.
4
Introduction…
• Luminescence spectroscopy may be divided into two
major areas:
1. Fluorescence spectroscopy and
2. Phosphorescence spectroscopy
• The differences between the two are based mostly on the
time frames on which the phenomena of fluorescence and
phosphorescence occur
• Phosphorescence decays much more slowly (often taking
several seconds) than fluorescence subsequent to
excitation.
5
Introduction…
• Deactivation as fluorescence is a rapid process
occurring within 10-6 to 10-9 seconds of excitation.
• The average lifetime for phosphorescence ranges from
10–4 to 104 .
• Phosphorescence may continue for some time after
removing the excitation source.
6
Introduction…
• After the absorption of U-Vis light, the excited molecular
species are extremely short lived and deactivation occur due
to
– Internal collision (internal conversion)
– Cleavage of chemical bonds, initiating photochemical
reaction
– Re-emission as light (Luminescence)
• Molecules on excitation normally possess higher vibrational
energy than they had in the ground state.
7
Introduction…
• In excited molecules which exhibit fluorescence, the spin
of π electron and that π* electron, which together
constitute a π bond in the chromophore system are in
opposite directions, i.e. they are anti parallel (Singlet
excited state).
8
Introduction…
• Some excited molecules, particularly at low temperature,
many undergo a slow intersystem crossover to a state
(Triplet excited state) in which the spin of the π and π *
electrons are unpaired (Parallel)
• Return from the Singlet excited state to the ground state
results in the emission of Fluorescence.
• Return from the Triplet excited state to the ground state
results in the emission of phosphorescence.
9
Introduction…
10
Introduction…
TERMS (non radiation conversions)
 Internal conversion: A form of radiationless relaxation in which the
analyte moves from a higher electronic energy level to a lower
electronic energy level.
 External conversion: A form of radiationless relaxation in
which energy is transferred to the solvent or sample matrix
 Intersystem crossing: A form of radiationless relaxation in
which the analyte moves from a higher electronic energy level
to a lower electronic energy level with a different spin state
11
Introduction…
• The difference in the energy level (E) b/n the
excited and the unexcited state during excitation
(Absorption), fluorescence and Phosphorescence
are in the order of
E (Absorption) > E (Fluorescence) > E
(Phosphorescence)
12
Fluorescence spectroscopy
• Fluorometry or spectrofluorometry, is a type of
electromagnetic spectroscopy which analyzes
fluorescence from a sample.
• It involves using a beam of light, usually ultraviolet
light, that excites the electrons in molecules of certain
compounds and causes them to emit light of a lower
energy, typically, but not necessarily, visible light.
13
Fluorescence…
• Fluorescence occurs when a molecule in the lowest
vibrational energy level of an excited electronic state
returns to a lower energy electronic state by emitting a
photon
• A quantitative expression of the efficiency of fluorescence
is the fluorescent quantum yield (ØF)
• It is the fraction of excited molecules returning to the
ground state by fluorescence.
14
Fluorescence…
15
For low concentrations of the fluorescing species,
Fluorescence…
• Quantum yields range
– from 1:- when every molecule in an excited state
undergoes fluorescence,
– to 0:- when fluorescence does not occur.
• The intensity of fluorescence therefore, increases
with an increase in
– quantum efficiency,
– incident power of the excitation source,
– the molar absorptivity and
– concentration of the fluorescing species.
16
Fluorescence…
Excitation Versus Emission Spectra
• Photoluminescence spectra are recorded by measuring the
intensity of emitted radiation as a function of either the
excitation wavelength or the emission wavelength.
• An excitation spectrum is obtained by monitoring emission
at a fixed wavelength while varying the excitation
wavelength.
• In an emission spectrum a fixed wavelength is used to
excite the molecules, and the intensity of emitted radiation
is monitored as a function of wavelength.
17
Fluorescence…
• Although a molecule has only a single excitation
spectrum, it has two emission spectra, one for
fluorescence and one for phosphorescence.
18
Figure: Example of molecular excitation and emission spectra.
Fluorescence…
Advantages of Fluorescence spectroscopy
1. Sensitivity
• Substances that are reasonably fluorescent may be determined
at concentration of up to 1000 times less than those required
for absorption spectroscopy.
• In spectrofluorimetry the detector measures single light
intensity which may be amplified electronically many
times
• In UV/Vis, the detector measures two intensities Io and It
and reasonable difference( It=0.05 Io to 0.5 Io) should exist
for accurate and precise measurement of absorbance.
19
Fluorescence…
vSamples containing < 1 mg/dose
– Biological samples( blood, urine) containing low
concentration of drugs,
– Hormones,
– Alkaloids and vitamins in formulation or biological
samples.
2.Selectivity
• Not all substances that absorb in the UV-Visible
fluoresce
• Wavelength of excitation /emission/ can be easily
varied to selectively measure the fluorescence
20
Fluorescence…
Factors affecting Fluorescence intensity
Concentration
• In order for a molecule to fluorescence it must
first absorb radiation.
• If the concentration of the absorbing substance
is very high, all the incident light may be
absorbed by first layer of solution
21
Factors affecting Fluorescence intensity…
Concentration….
• Over a wide range of solute concentrations, solute–solute
interactions may also account for loss of luminescence
intensity with increasing solute concentration.
• The fluorescence of such samples will therefore be non
uniform and will not be proportional to the
concentration of the substance.
22
Fluorescence…
Factors affecting …
Temperature and Viscosity
• A molecule’s fluorescence quantum yield is also
influenced by external variables such as temperature and
solvent.
• Increasing temperature generally decreases fluorescence
because more frequent collisions between the molecule
and the solvent increases external conversion.
• Decreasing the solvent ’s viscosity decreases
fluorescence for similar reasons.
23
Fluorescence…
Factors affecting …
pH of the solution
• The influences of pH on luminescence spectra are derived from
the dissociation of acidic functional groups or the protonation
of basic functional groups, associated with the aromatic
portions of fluorescing molecules.
• Fluorescence intensity from excited states of charged and
uncharged species is generally different. (i.e. change in pH
alter the ratio of charged and uncharged species)
24
Fluorescence…
Factors affecting …
Oxygen
• The presence of oxygen may interfere in two ways
– By direct oxidation of fluorescence substances to non-
fluorescence products
– By Quenching of fluorescence(quenching:- any process which
decreases fluorescence intensity)
25
F + hv--------F*
F*------F + hv
F* + Q-------------F + Q
Fluorescence…
Factors affecting…
The effect of other solutes
• Fluorometry is not ideal for the analysis of
mixtures due to its un predictability of the effect
of one cpd on another.
• H a l o g e n s , h e a v y a t o m s , q u e n c h
fluorescence( decrease fluorescence efficiency)
26
Fluorescence…
Molecular structure and fluorescence
• In order for a molecule to exhibit fluorescence it is
necessary that the excited molecule return to the ground
state via a radiative transition from the excited singlet.
• It has been found the probability of a radiation transfer
from singlet to triplet state is higher for an n-pi* than pi-
pi*
• Thus the latter will have high probability of fluorescence.
27
Fluorescence…
Molecular structure…
• Fluorescence is generally observed with molecules where
the lowest energy absorption is pi-pi* transition, although
some n-p* transitions show weak fluorescence.
• Most unsubstituted, non-heterocyclic aromatic
compounds show favorable fluorescence quantum yields.
–Most aromatics fluoresce
28
Molecular structure…
• Fluorescence also increases for aromatic ring
systems and for aromatic molecules with rigid
planar structures.
29
Fluorescence…
INSTRUMENTATION
Fluorescence spectrophotometers consist of
• A light source- to provide the excitation energy,
• A device for selecting the excitation wavelength
• A sample compartment
• A second device for selecting the emission wavelength
• Photodetector and
• A data acquisition and recording device to determine
the intensity of fluorescence at any given wavelength (fig.
below) 30
Fluorescence…
INSTRUMENTATION…
31
Schematic diagram of a spectrofluorimeter
Fluorescence…
INSTRUMENTATION…
Light source
• Gas discharge lamps are the most commonly used
light sources.
• These lamps consist of two electrodes in a carrier gas
at high pressure, across which a high potential
difference is applied.
• The carrier gas employed is frequently the inert gas
xenon.
32
INSTRUMENTATION…
Light source…
• The high potential difference ionizes the carrier-gas
atoms, which then accelerate toward the cathode,
generating, through collisions, other excited states which
emit radiation upon returning to their ground states.
Mercury arc lamps and Xenon arc lamps are in common use
• Both lamps emit in the visible and Uv region
33
Fluorescence…
INSTRUMENTATION…
Wavelength Selection Devices
• The wavelength selection devices employed in fluorimetry
are either filters or grating monochromators.
• The filters are either absorption or interference based.
• However, the filters are not very useful in scanning
instruments.
• Monochromators consist of an entrance slit, a dispersion
device, and an exit slit.
34
INSTRUMENTATION…
Wavelength Selection Devices…
• The dispersion device is usually a diffraction grating,
though a prism may still be used in the older devices.
• The gratings are preferred than the prisms, as they are
– less expensive,
– have uniform resolution,
– a linear dispersion throughout the ultraviolet–visible
range
35
Fluorescence…
INSTRUMENTATION…
• There are usually two monochromators in
fluorescence spectrophotometers,
– an excitation monochromator and
– an emission monochromator.
36
INSTRUMENTATION…
Sample Compartment
• The sample compartment has its internal surfaces
painted a flat black and is covered during measurement
to minimize stray light.
• The sample compartment is normally positioned so that
the excitation and emission monochromators are at
right angles to each other, so as to minimize
interference from stray excitation light.
37
Fluorescence…
INSTRUMENTATION…
Sample Compartment…
• The fluorescence cells are constructed of either quartz or
silica, as these materials are able to transmit light of
wavelength as low as 200 nm up to well into the near-
infrared.
• Occasionally, cheaper glass or plastic cells are employed,
where the excitation wavelength range is above 330 nm.
• The sample cells are normally rectangular, with a
horizontal cross-sectional area of 1 cm 2 for room-
temperature fluorescence spectroscopy.
38
Fluorescence…
INSTRUMENTATION…
Photodetectors
• The most widely used photodetectors are the
photomultiplier tubes. These tubes generate an electrical
signal upon exposure to light.
• For the measurement of low light intensities, photon
counting has been employed.
• In photon counters the photoelectron pulses at the anode
of the photomultiplier tube are counted using a high-
speed electronic counter.
39
INSTRUMENTATION…
Photodetectors…
• One pulse accounts for each electron ejected from
the photocathode
• And the mean pulse count rate is proportional to
the light intensity.
40
Fluorescence…
INSTRUMENTATION…
Data Acquisition Devices
• The electronic signal obtained from the
photodetector is usually electronically amplified,
measured using some sort of galvanometer, and
presented in either analog or digital form.
• The signal may alternatively be recorded on a strip-
chart recorder, to supply a permanent record of the
spectrum.
41
Fluorescence…
Applications
• Concentration of drugs and drug metabolites in blood,
urine and other biological fluids samples may be
extremely low and fluorescence analysis finds wide
application in quantitative studies of rates and
mechanism of absorption, metabolism and excretion
studies( PK studies)
• Fluorometric drug analysis can be classified in to three
chemical ways.
42
Fluorescence…
Applications…
A) Those drugs that possess intrinsic fluorescence.
ØThese require no chemical reactions to create a
fluorescent compound.
Example Quinine
B) Those drugs which can be derivatized to the forms by
attaching fluorescent compounds to the drug.
Ø Eg. Dansyl chloride can react with aminoacids to give
dansyaminoacids which are highly fluorescent
43
Fluorescence…
Applications…
c) Those drugs which needs more extensive molecular
change than simple derivative formation.
ØEg. Thiamine HCl
44
THE END
45

2. Fluorimetry.pdf

  • 1.
  • 2.
    Key points Principles • Certainmolecules, particularly those with a chromophore and a rigid structure, can be excited by UV/visible radiation, and will then emit the radiation absorbed at a longer wavelength. The radiation emitted can then be measured. Applications • Determination of fluorescent drugs in low-dose formulations in the presence of non-fluorescent excipients. • In carrying out limit tests where the impurity is fluorescent or can be simply rendered fluorescent. • Useful for studying the binding of drugs to components in complex formulations • Widely used in bioanalysis for measuring small amounts of drug and for studying drug-protein binding. 2
  • 3.
    KEYPOINTS (Continued) Strengths • Aselective detection method and can be used to quantify a strongly fluorescent compound in the presence of a larger amount of non-fluorescent material. • Can be used to monitor changes in complex molecules such as proteins, which are being used increasingly as drugs. Limitations • The technique only applies to a limited number of molecules. • Fluorescence is subject to interference by UV-absorbing species, heavy ions in solution, and is affected by temperature. 3
  • 4.
    Introduction • Luminescence spectroscopyis an analytical method derived from the emission of light by molecules which have become electronically excited subsequent to the absorption of visible or ultraviolet radiation. • • Due to its high analytical sensitivity (concentrations of luminescent analytes (1x10⁻⁹ moles/L) are routinely deter-mined), – this technique is widely employed in the analysis of drugs and metabolites. 4
  • 5.
    Introduction… • Luminescence spectroscopymay be divided into two major areas: 1. Fluorescence spectroscopy and 2. Phosphorescence spectroscopy • The differences between the two are based mostly on the time frames on which the phenomena of fluorescence and phosphorescence occur • Phosphorescence decays much more slowly (often taking several seconds) than fluorescence subsequent to excitation. 5
  • 6.
    Introduction… • Deactivation asfluorescence is a rapid process occurring within 10-6 to 10-9 seconds of excitation. • The average lifetime for phosphorescence ranges from 10–4 to 104 . • Phosphorescence may continue for some time after removing the excitation source. 6
  • 7.
    Introduction… • After theabsorption of U-Vis light, the excited molecular species are extremely short lived and deactivation occur due to – Internal collision (internal conversion) – Cleavage of chemical bonds, initiating photochemical reaction – Re-emission as light (Luminescence) • Molecules on excitation normally possess higher vibrational energy than they had in the ground state. 7
  • 8.
    Introduction… • In excitedmolecules which exhibit fluorescence, the spin of π electron and that π* electron, which together constitute a π bond in the chromophore system are in opposite directions, i.e. they are anti parallel (Singlet excited state). 8
  • 9.
    Introduction… • Some excitedmolecules, particularly at low temperature, many undergo a slow intersystem crossover to a state (Triplet excited state) in which the spin of the π and π * electrons are unpaired (Parallel) • Return from the Singlet excited state to the ground state results in the emission of Fluorescence. • Return from the Triplet excited state to the ground state results in the emission of phosphorescence. 9
  • 10.
  • 11.
    Introduction… TERMS (non radiationconversions)  Internal conversion: A form of radiationless relaxation in which the analyte moves from a higher electronic energy level to a lower electronic energy level.  External conversion: A form of radiationless relaxation in which energy is transferred to the solvent or sample matrix  Intersystem crossing: A form of radiationless relaxation in which the analyte moves from a higher electronic energy level to a lower electronic energy level with a different spin state 11
  • 12.
    Introduction… • The differencein the energy level (E) b/n the excited and the unexcited state during excitation (Absorption), fluorescence and Phosphorescence are in the order of E (Absorption) > E (Fluorescence) > E (Phosphorescence) 12
  • 13.
    Fluorescence spectroscopy • Fluorometryor spectrofluorometry, is a type of electromagnetic spectroscopy which analyzes fluorescence from a sample. • It involves using a beam of light, usually ultraviolet light, that excites the electrons in molecules of certain compounds and causes them to emit light of a lower energy, typically, but not necessarily, visible light. 13
  • 14.
    Fluorescence… • Fluorescence occurswhen a molecule in the lowest vibrational energy level of an excited electronic state returns to a lower energy electronic state by emitting a photon • A quantitative expression of the efficiency of fluorescence is the fluorescent quantum yield (ØF) • It is the fraction of excited molecules returning to the ground state by fluorescence. 14
  • 15.
    Fluorescence… 15 For low concentrationsof the fluorescing species,
  • 16.
    Fluorescence… • Quantum yieldsrange – from 1:- when every molecule in an excited state undergoes fluorescence, – to 0:- when fluorescence does not occur. • The intensity of fluorescence therefore, increases with an increase in – quantum efficiency, – incident power of the excitation source, – the molar absorptivity and – concentration of the fluorescing species. 16
  • 17.
    Fluorescence… Excitation Versus EmissionSpectra • Photoluminescence spectra are recorded by measuring the intensity of emitted radiation as a function of either the excitation wavelength or the emission wavelength. • An excitation spectrum is obtained by monitoring emission at a fixed wavelength while varying the excitation wavelength. • In an emission spectrum a fixed wavelength is used to excite the molecules, and the intensity of emitted radiation is monitored as a function of wavelength. 17
  • 18.
    Fluorescence… • Although amolecule has only a single excitation spectrum, it has two emission spectra, one for fluorescence and one for phosphorescence. 18 Figure: Example of molecular excitation and emission spectra.
  • 19.
    Fluorescence… Advantages of Fluorescencespectroscopy 1. Sensitivity • Substances that are reasonably fluorescent may be determined at concentration of up to 1000 times less than those required for absorption spectroscopy. • In spectrofluorimetry the detector measures single light intensity which may be amplified electronically many times • In UV/Vis, the detector measures two intensities Io and It and reasonable difference( It=0.05 Io to 0.5 Io) should exist for accurate and precise measurement of absorbance. 19
  • 20.
    Fluorescence… vSamples containing <1 mg/dose – Biological samples( blood, urine) containing low concentration of drugs, – Hormones, – Alkaloids and vitamins in formulation or biological samples. 2.Selectivity • Not all substances that absorb in the UV-Visible fluoresce • Wavelength of excitation /emission/ can be easily varied to selectively measure the fluorescence 20
  • 21.
    Fluorescence… Factors affecting Fluorescenceintensity Concentration • In order for a molecule to fluorescence it must first absorb radiation. • If the concentration of the absorbing substance is very high, all the incident light may be absorbed by first layer of solution 21
  • 22.
    Factors affecting Fluorescenceintensity… Concentration…. • Over a wide range of solute concentrations, solute–solute interactions may also account for loss of luminescence intensity with increasing solute concentration. • The fluorescence of such samples will therefore be non uniform and will not be proportional to the concentration of the substance. 22
  • 23.
    Fluorescence… Factors affecting … Temperatureand Viscosity • A molecule’s fluorescence quantum yield is also influenced by external variables such as temperature and solvent. • Increasing temperature generally decreases fluorescence because more frequent collisions between the molecule and the solvent increases external conversion. • Decreasing the solvent ’s viscosity decreases fluorescence for similar reasons. 23
  • 24.
    Fluorescence… Factors affecting … pHof the solution • The influences of pH on luminescence spectra are derived from the dissociation of acidic functional groups or the protonation of basic functional groups, associated with the aromatic portions of fluorescing molecules. • Fluorescence intensity from excited states of charged and uncharged species is generally different. (i.e. change in pH alter the ratio of charged and uncharged species) 24
  • 25.
    Fluorescence… Factors affecting … Oxygen •The presence of oxygen may interfere in two ways – By direct oxidation of fluorescence substances to non- fluorescence products – By Quenching of fluorescence(quenching:- any process which decreases fluorescence intensity) 25 F + hv--------F* F*------F + hv F* + Q-------------F + Q
  • 26.
    Fluorescence… Factors affecting… The effectof other solutes • Fluorometry is not ideal for the analysis of mixtures due to its un predictability of the effect of one cpd on another. • H a l o g e n s , h e a v y a t o m s , q u e n c h fluorescence( decrease fluorescence efficiency) 26
  • 27.
    Fluorescence… Molecular structure andfluorescence • In order for a molecule to exhibit fluorescence it is necessary that the excited molecule return to the ground state via a radiative transition from the excited singlet. • It has been found the probability of a radiation transfer from singlet to triplet state is higher for an n-pi* than pi- pi* • Thus the latter will have high probability of fluorescence. 27
  • 28.
    Fluorescence… Molecular structure… • Fluorescenceis generally observed with molecules where the lowest energy absorption is pi-pi* transition, although some n-p* transitions show weak fluorescence. • Most unsubstituted, non-heterocyclic aromatic compounds show favorable fluorescence quantum yields. –Most aromatics fluoresce 28
  • 29.
    Molecular structure… • Fluorescencealso increases for aromatic ring systems and for aromatic molecules with rigid planar structures. 29
  • 30.
    Fluorescence… INSTRUMENTATION Fluorescence spectrophotometers consistof • A light source- to provide the excitation energy, • A device for selecting the excitation wavelength • A sample compartment • A second device for selecting the emission wavelength • Photodetector and • A data acquisition and recording device to determine the intensity of fluorescence at any given wavelength (fig. below) 30
  • 31.
  • 32.
    Fluorescence… INSTRUMENTATION… Light source • Gasdischarge lamps are the most commonly used light sources. • These lamps consist of two electrodes in a carrier gas at high pressure, across which a high potential difference is applied. • The carrier gas employed is frequently the inert gas xenon. 32
  • 33.
    INSTRUMENTATION… Light source… • Thehigh potential difference ionizes the carrier-gas atoms, which then accelerate toward the cathode, generating, through collisions, other excited states which emit radiation upon returning to their ground states. Mercury arc lamps and Xenon arc lamps are in common use • Both lamps emit in the visible and Uv region 33
  • 34.
    Fluorescence… INSTRUMENTATION… Wavelength Selection Devices •The wavelength selection devices employed in fluorimetry are either filters or grating monochromators. • The filters are either absorption or interference based. • However, the filters are not very useful in scanning instruments. • Monochromators consist of an entrance slit, a dispersion device, and an exit slit. 34
  • 35.
    INSTRUMENTATION… Wavelength Selection Devices… •The dispersion device is usually a diffraction grating, though a prism may still be used in the older devices. • The gratings are preferred than the prisms, as they are – less expensive, – have uniform resolution, – a linear dispersion throughout the ultraviolet–visible range 35
  • 36.
    Fluorescence… INSTRUMENTATION… • There areusually two monochromators in fluorescence spectrophotometers, – an excitation monochromator and – an emission monochromator. 36
  • 37.
    INSTRUMENTATION… Sample Compartment • Thesample compartment has its internal surfaces painted a flat black and is covered during measurement to minimize stray light. • The sample compartment is normally positioned so that the excitation and emission monochromators are at right angles to each other, so as to minimize interference from stray excitation light. 37
  • 38.
    Fluorescence… INSTRUMENTATION… Sample Compartment… • Thefluorescence cells are constructed of either quartz or silica, as these materials are able to transmit light of wavelength as low as 200 nm up to well into the near- infrared. • Occasionally, cheaper glass or plastic cells are employed, where the excitation wavelength range is above 330 nm. • The sample cells are normally rectangular, with a horizontal cross-sectional area of 1 cm 2 for room- temperature fluorescence spectroscopy. 38
  • 39.
    Fluorescence… INSTRUMENTATION… Photodetectors • The mostwidely used photodetectors are the photomultiplier tubes. These tubes generate an electrical signal upon exposure to light. • For the measurement of low light intensities, photon counting has been employed. • In photon counters the photoelectron pulses at the anode of the photomultiplier tube are counted using a high- speed electronic counter. 39
  • 40.
    INSTRUMENTATION… Photodetectors… • One pulseaccounts for each electron ejected from the photocathode • And the mean pulse count rate is proportional to the light intensity. 40
  • 41.
    Fluorescence… INSTRUMENTATION… Data Acquisition Devices •The electronic signal obtained from the photodetector is usually electronically amplified, measured using some sort of galvanometer, and presented in either analog or digital form. • The signal may alternatively be recorded on a strip- chart recorder, to supply a permanent record of the spectrum. 41
  • 42.
    Fluorescence… Applications • Concentration ofdrugs and drug metabolites in blood, urine and other biological fluids samples may be extremely low and fluorescence analysis finds wide application in quantitative studies of rates and mechanism of absorption, metabolism and excretion studies( PK studies) • Fluorometric drug analysis can be classified in to three chemical ways. 42
  • 43.
    Fluorescence… Applications… A) Those drugsthat possess intrinsic fluorescence. ØThese require no chemical reactions to create a fluorescent compound. Example Quinine B) Those drugs which can be derivatized to the forms by attaching fluorescent compounds to the drug. Ø Eg. Dansyl chloride can react with aminoacids to give dansyaminoacids which are highly fluorescent 43
  • 44.
    Fluorescence… Applications… c) Those drugswhich needs more extensive molecular change than simple derivative formation. ØEg. Thiamine HCl 44
  • 45.