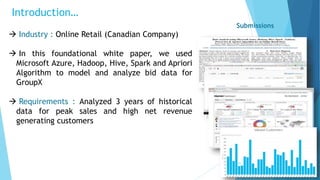
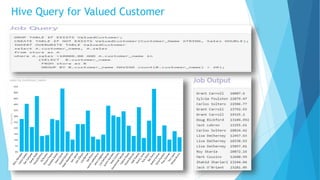
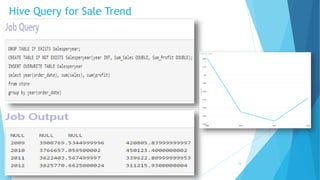
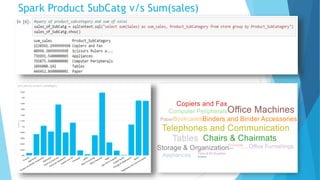
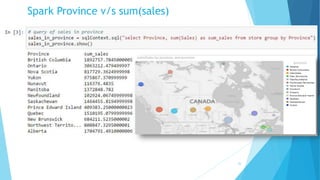
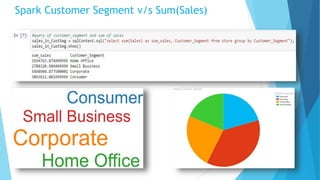
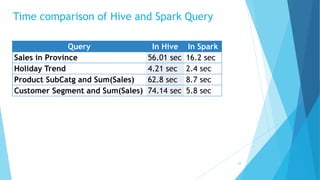
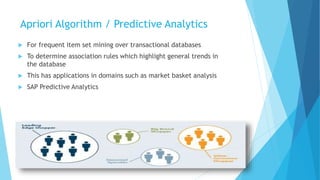
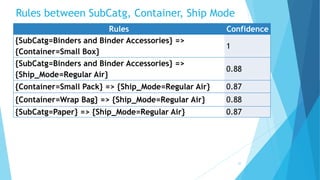
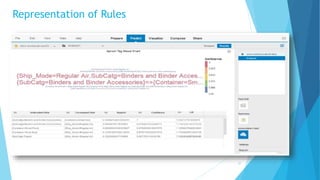
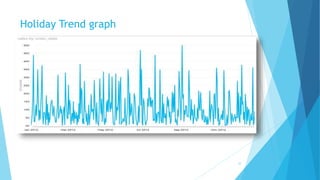
Dashboard 1
2
1
Big Data Science
Online Retail Store Analysis
Submitted to : Dr Jongwook Woo
24th Annual Student Symposium,CSULA
Submitted By : Rajeev Singh , Manvi Chandra
Richa Kankarej
California State University, Los Angeles
2
3
4
5
6
7
8
9
10
11
12
13
14
15
16
17
18
19
Introduction…
 Industry : Online Retail (Canadian Company)
 In this foundational white paper, we used
Microsoft Azure, Hadoop, Hive, Spark and Apriori
Algorithm to model and analyze bid data for
GroupX
 Requirements : Analyzed 3 years of historical
data for peak sales and high net revenue
generating customers
Submissions
20
Go Big OR Go Home….
21
Retail Industry – It (Online & Offline) is huge of approx.
8 Trillion USD
Extrapolation – From weather patterns, search/browsing
trends, social networks, industry forecasts, existing
customer records
Predict – Instore sales, predict product trends, forecast
demand, pinpoint customer, optimize pricing and
promotions
Leverage to Retailers – Fewer sotckouts, higher visit to
buy ratio, better anticipation and response to market
shifts.
Retail Oligopoly – A market structure where only few
firms dominate.
Go Big …
Flow Diagram
22
Hive Query for Valued Customer
23
Hive Query for Sale Trend
24
Spark Product SubCatg v/s Sum(sales)
25
Spark Province v/s sum(sales)
26
Spark Customer Segment v/s Sum(Sales)
27
28
Query In Hive In Spark
Sales in Province 56.01 sec 16.2 sec
Holiday Trend 4.21 sec 2.4 sec
Product SubCatg and Sum(Sales) 62.8 sec 8.7 sec
Customer Segment and Sum(Sales) 74.14 sec 5.8 sec
Time comparison of Hive and Spark Query
Apriori Algorithm / Predictive Analytics
 For frequent item set mining over transactional databases
 To determine association rules which highlight general trends in
the database
 This has applications in domains such as market basket analysis
 SAP Predictive Analytics
29
Rules between SubCatg, Container, Ship Mode
30
Rules Confidence
{SubCatg=Binders and Binder Accessories} =>
{Container=Small Box}
1
{SubCatg=Binders and Binder Accessories} =>
{Ship_Mode=Regular Air}
0.88
{Container=Small Pack} => {Ship_Mode=Regular Air} 0.87
{Container=Wrap Bag} => {Ship_Mode=Regular Air} 0.88
{SubCatg=Paper} => {Ship_Mode=Regular Air} 0.87
31
Representation of Rules
Holiday Trend graph
32
Conclusion/Learnings
• No co-relation in Holiday season and an increase in sales for GroupX
• Spark is faster than Hive
• What steps can GroupX take to increase its YoY(Year on Year)
revenues
33
References
 References
 What is Hive?
 http://www-01.ibm.com/software/data/infosphere/hadoop/hive/.
 Introduction to Hadoop in HDInsight: Big-data analysis and processing in the
cloud. https://azure.microsoft.com/en-us/documentation/articles/hdinsight-
hadoop-introductin
34
Dashboard 1
2
35
Thank You
Q & A

RETAIL STORE ANALYSIS

  • 1.
    Dashboard 1 2 1 Big DataScience Online Retail Store Analysis Submitted to : Dr Jongwook Woo 24th Annual Student Symposium,CSULA Submitted By : Rajeev Singh , Manvi Chandra Richa Kankarej California State University, Los Angeles
  • 2.
  • 3.
  • 4.
  • 5.
  • 6.
  • 7.
  • 8.
  • 9.
  • 10.
  • 11.
  • 12.
  • 13.
  • 14.
  • 15.
  • 16.
  • 17.
  • 18.
  • 19.
  • 20.
    Introduction…  Industry :Online Retail (Canadian Company)  In this foundational white paper, we used Microsoft Azure, Hadoop, Hive, Spark and Apriori Algorithm to model and analyze bid data for GroupX  Requirements : Analyzed 3 years of historical data for peak sales and high net revenue generating customers Submissions 20
  • 21.
    Go Big ORGo Home…. 21 Retail Industry – It (Online & Offline) is huge of approx. 8 Trillion USD Extrapolation – From weather patterns, search/browsing trends, social networks, industry forecasts, existing customer records Predict – Instore sales, predict product trends, forecast demand, pinpoint customer, optimize pricing and promotions Leverage to Retailers – Fewer sotckouts, higher visit to buy ratio, better anticipation and response to market shifts. Retail Oligopoly – A market structure where only few firms dominate. Go Big …
  • 22.
  • 23.
    Hive Query forValued Customer 23
  • 24.
    Hive Query forSale Trend 24
  • 25.
    Spark Product SubCatgv/s Sum(sales) 25
  • 26.
    Spark Province v/ssum(sales) 26
  • 27.
    Spark Customer Segmentv/s Sum(Sales) 27
  • 28.
    28 Query In HiveIn Spark Sales in Province 56.01 sec 16.2 sec Holiday Trend 4.21 sec 2.4 sec Product SubCatg and Sum(Sales) 62.8 sec 8.7 sec Customer Segment and Sum(Sales) 74.14 sec 5.8 sec Time comparison of Hive and Spark Query
  • 29.
    Apriori Algorithm /Predictive Analytics  For frequent item set mining over transactional databases  To determine association rules which highlight general trends in the database  This has applications in domains such as market basket analysis  SAP Predictive Analytics 29
  • 30.
    Rules between SubCatg,Container, Ship Mode 30 Rules Confidence {SubCatg=Binders and Binder Accessories} => {Container=Small Box} 1 {SubCatg=Binders and Binder Accessories} => {Ship_Mode=Regular Air} 0.88 {Container=Small Pack} => {Ship_Mode=Regular Air} 0.87 {Container=Wrap Bag} => {Ship_Mode=Regular Air} 0.88 {SubCatg=Paper} => {Ship_Mode=Regular Air} 0.87
  • 31.
  • 32.
  • 33.
    Conclusion/Learnings • No co-relationin Holiday season and an increase in sales for GroupX • Spark is faster than Hive • What steps can GroupX take to increase its YoY(Year on Year) revenues 33
  • 34.
    References  References  Whatis Hive?  http://www-01.ibm.com/software/data/infosphere/hadoop/hive/.  Introduction to Hadoop in HDInsight: Big-data analysis and processing in the cloud. https://azure.microsoft.com/en-us/documentation/articles/hdinsight- hadoop-introductin 34
  • 35.