Downloaded 2,633 times


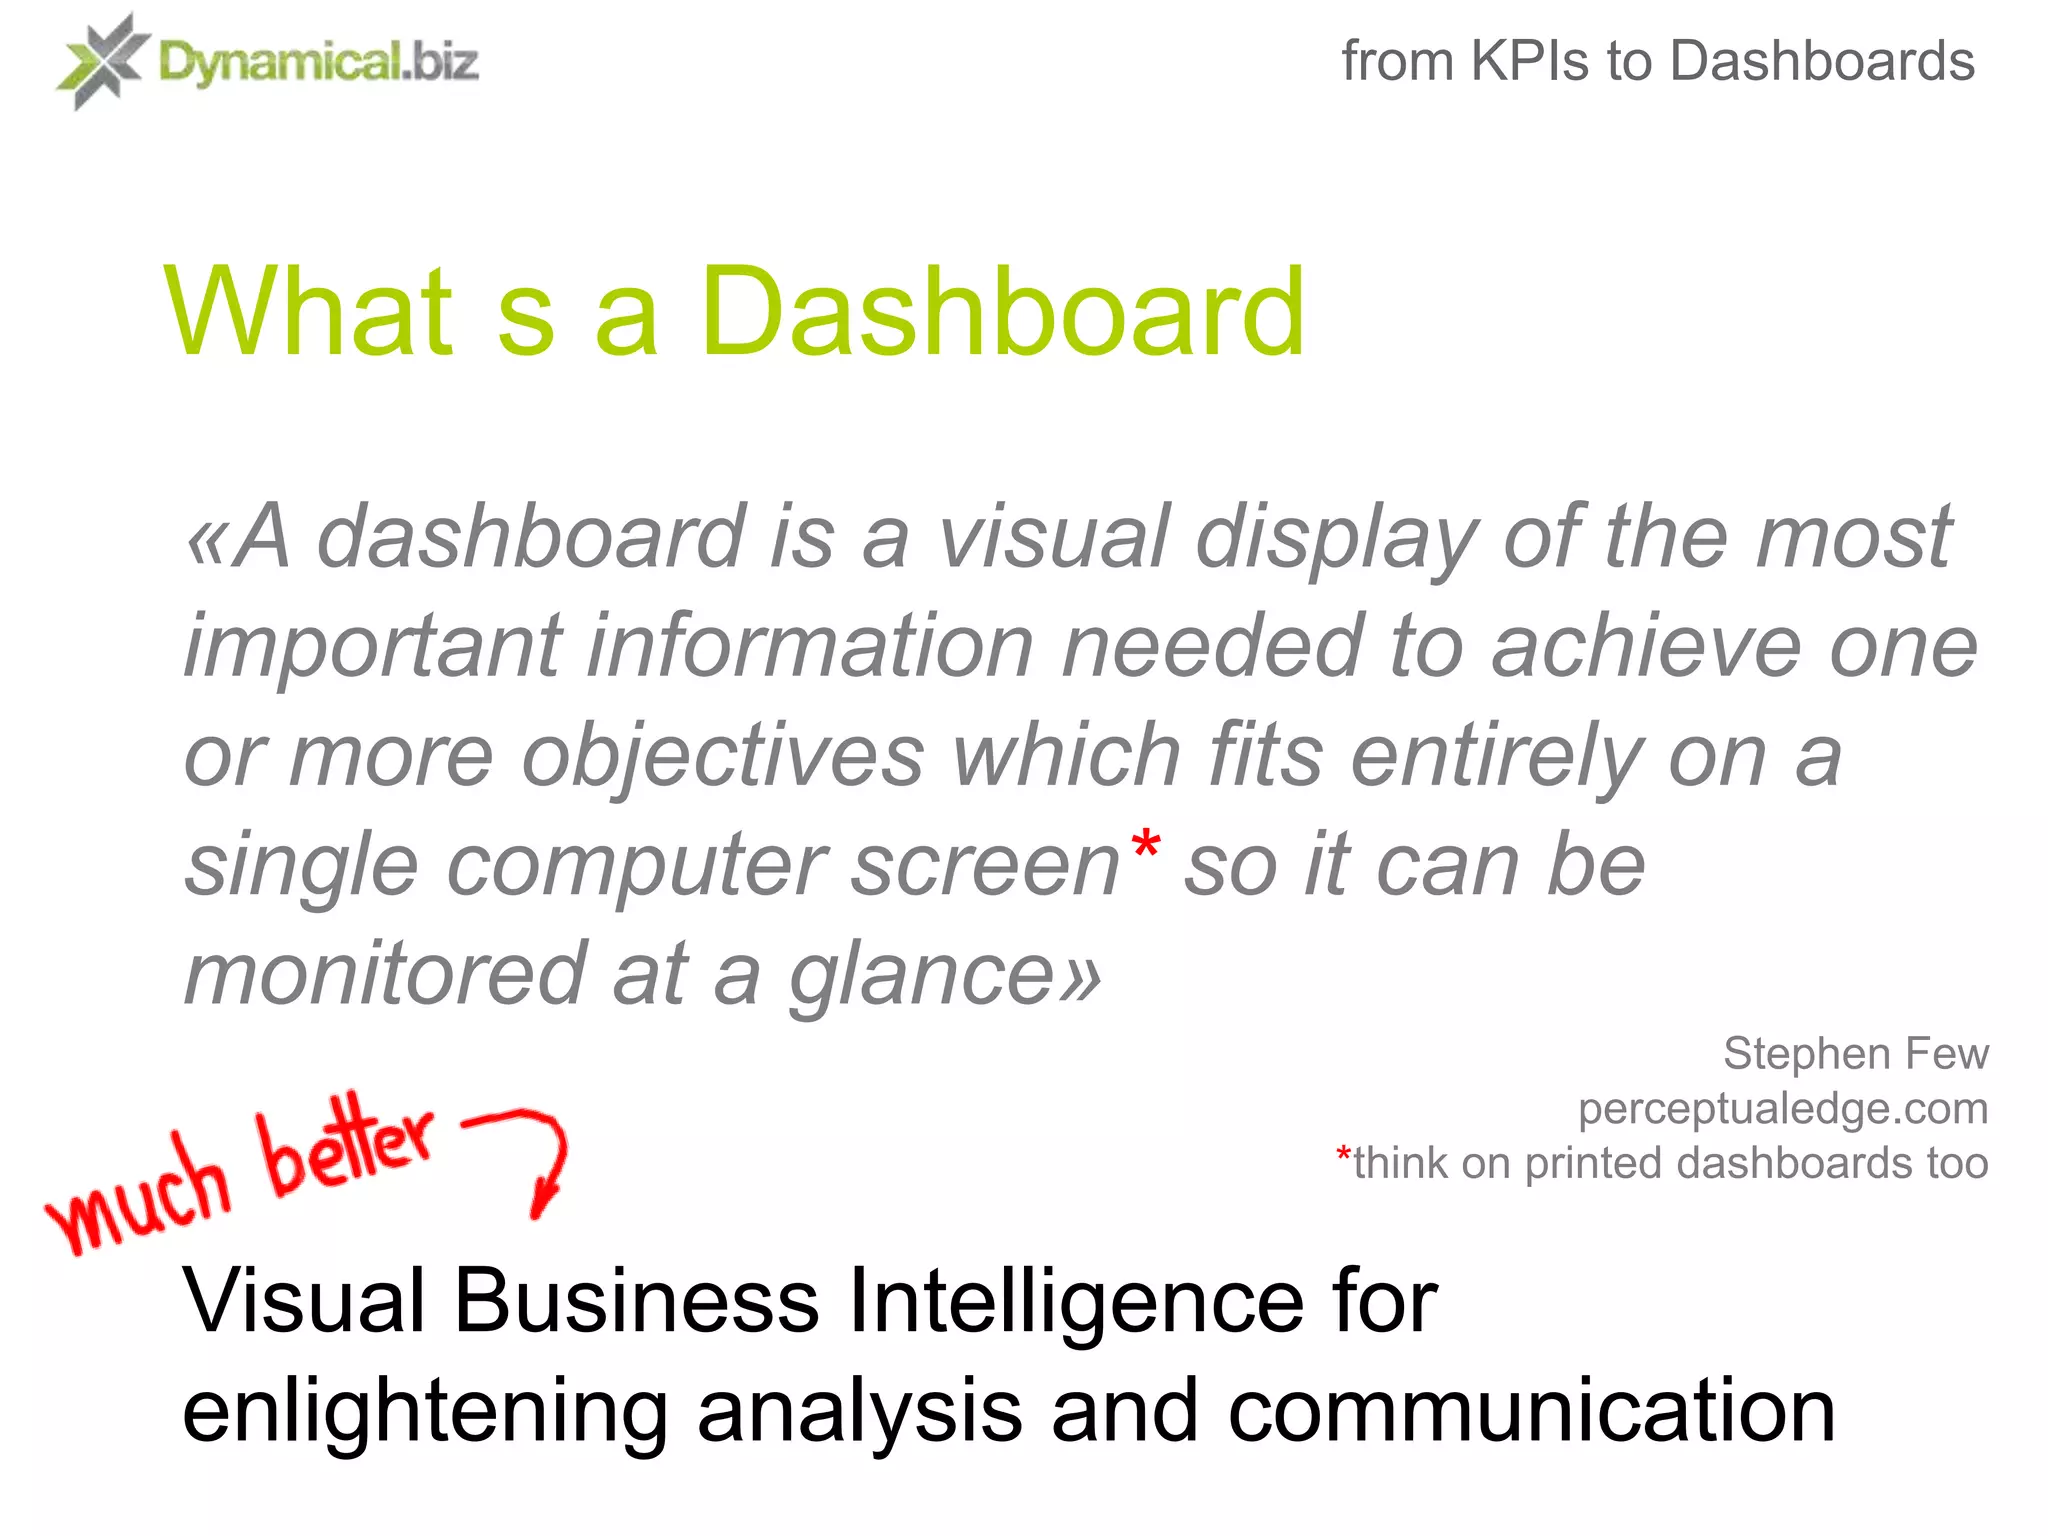


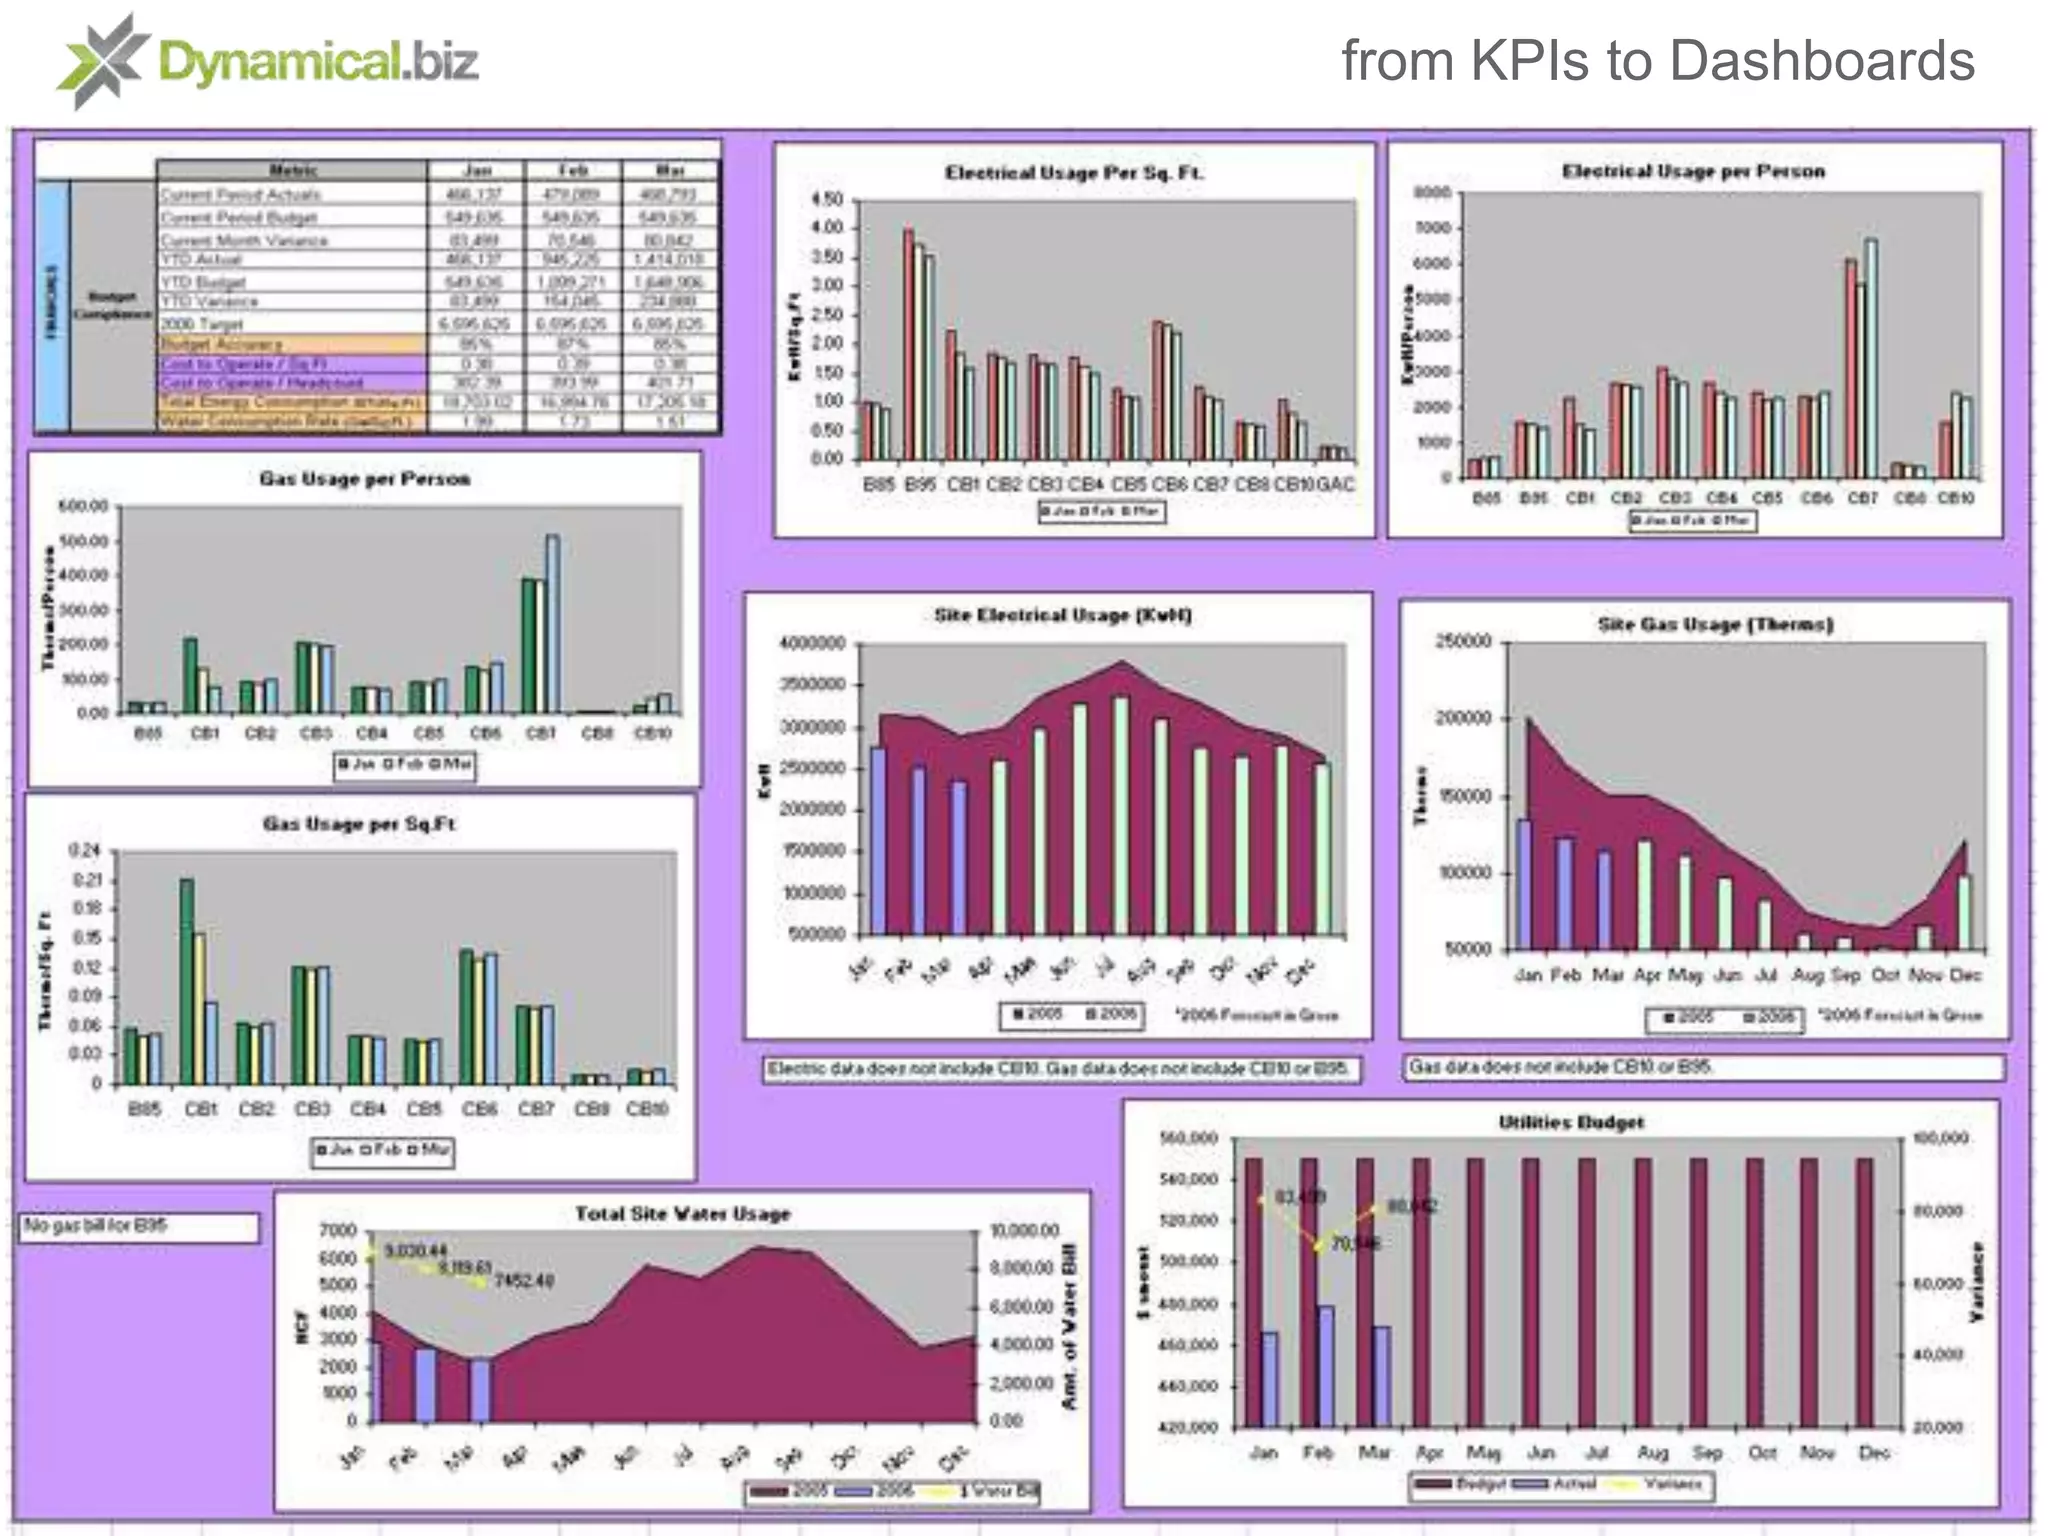
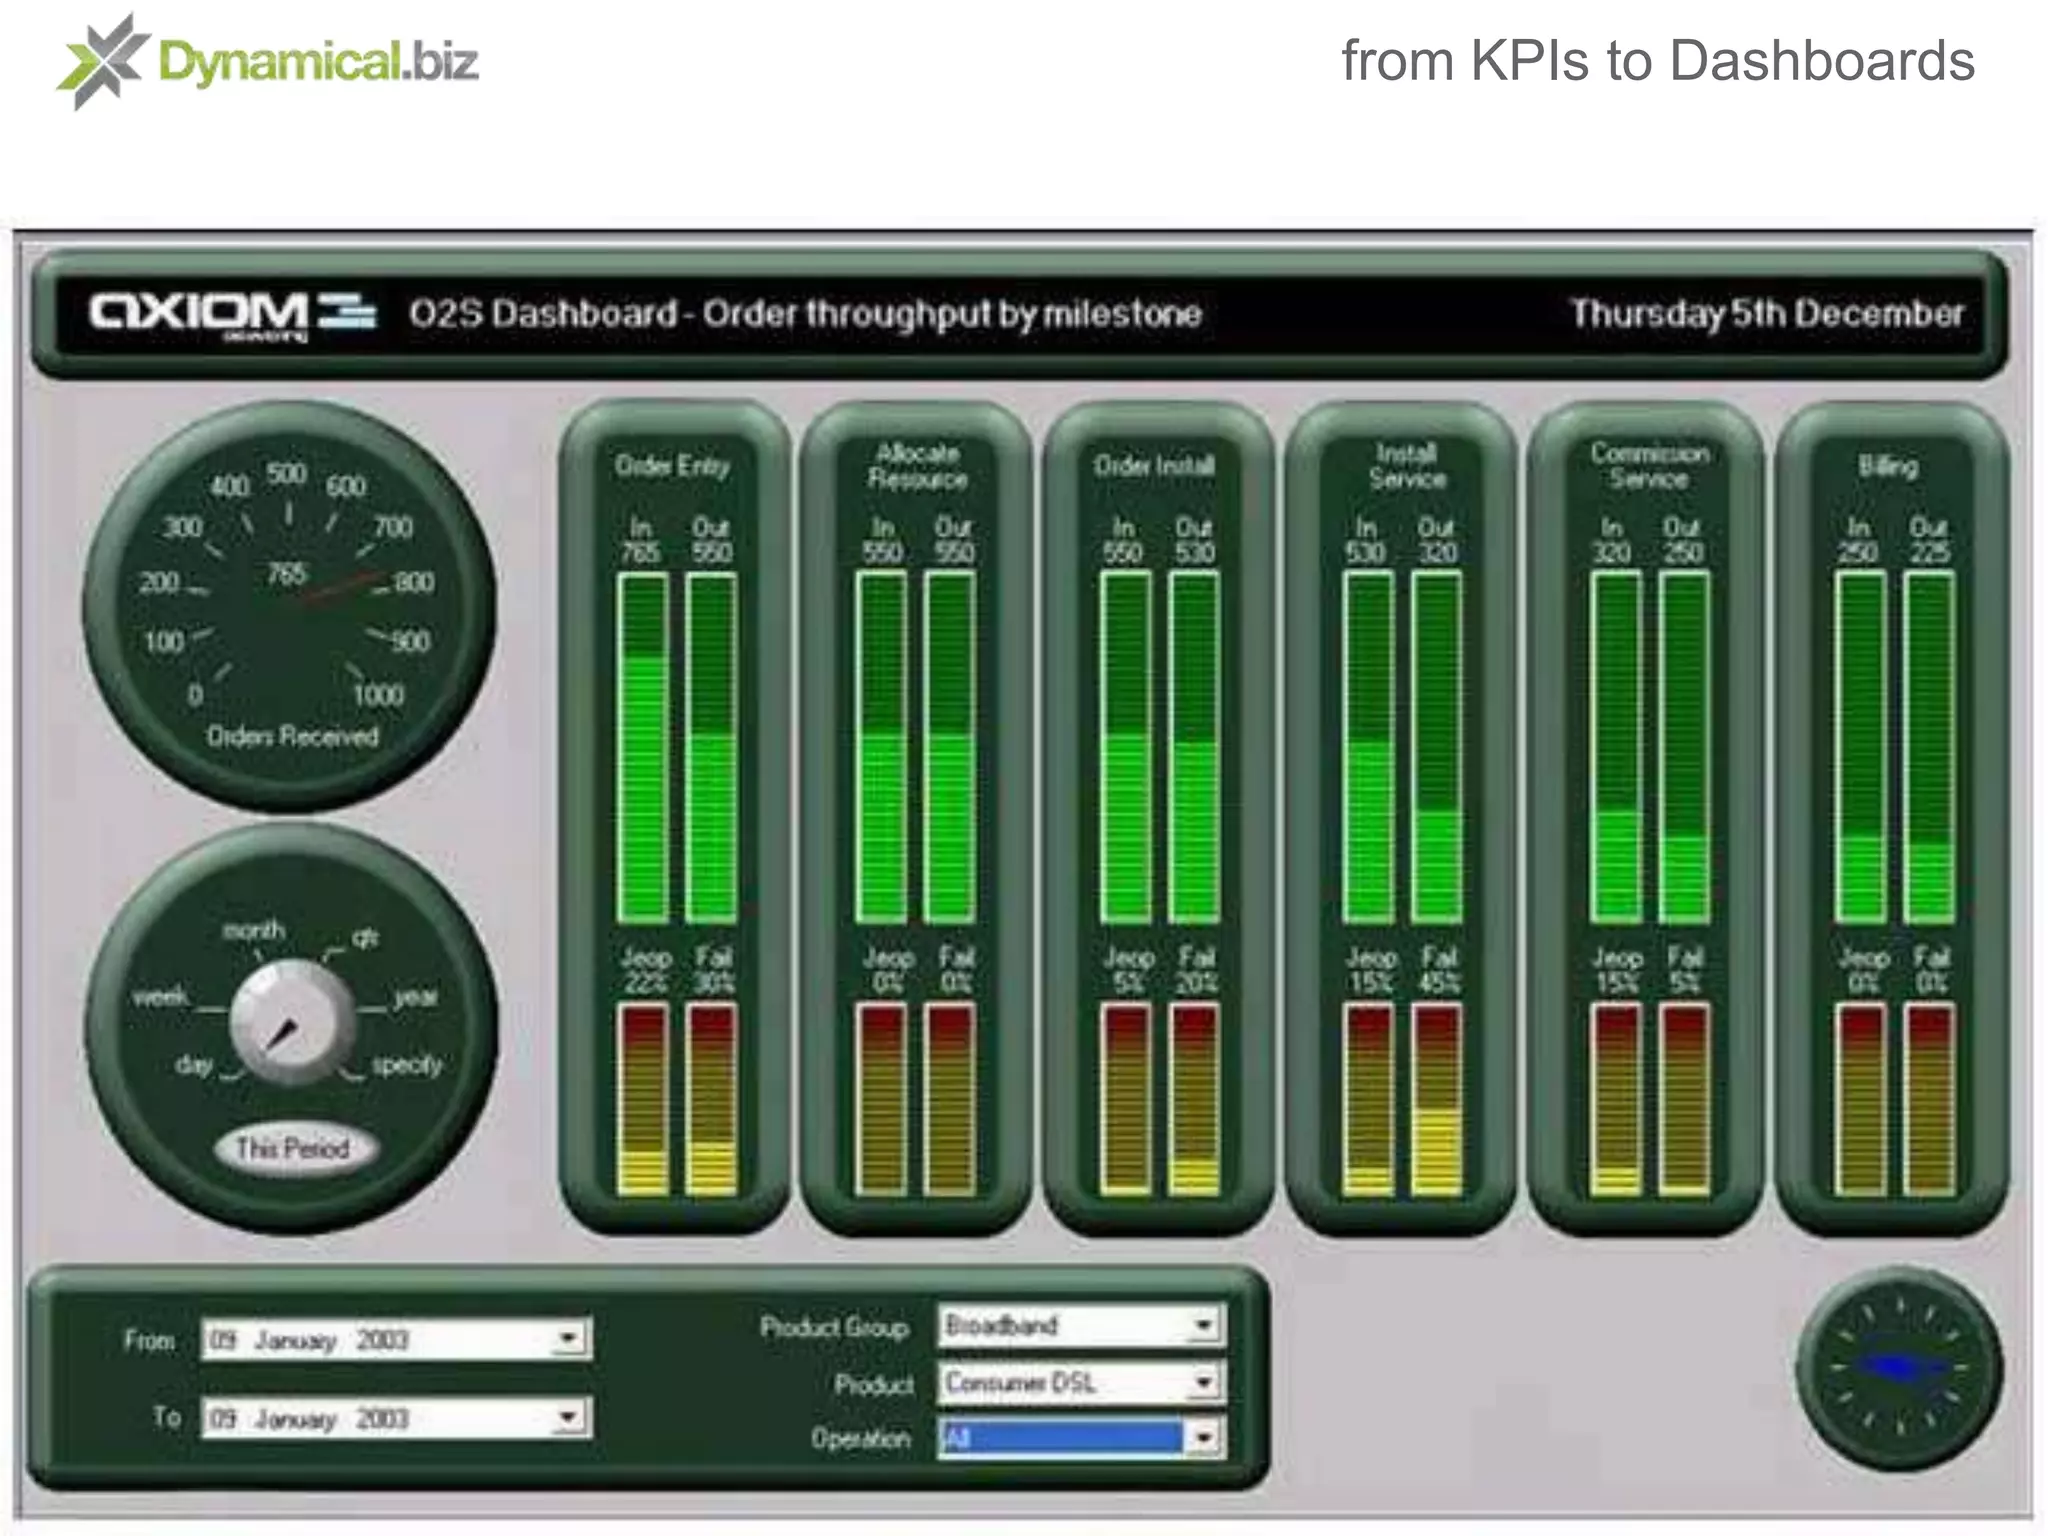
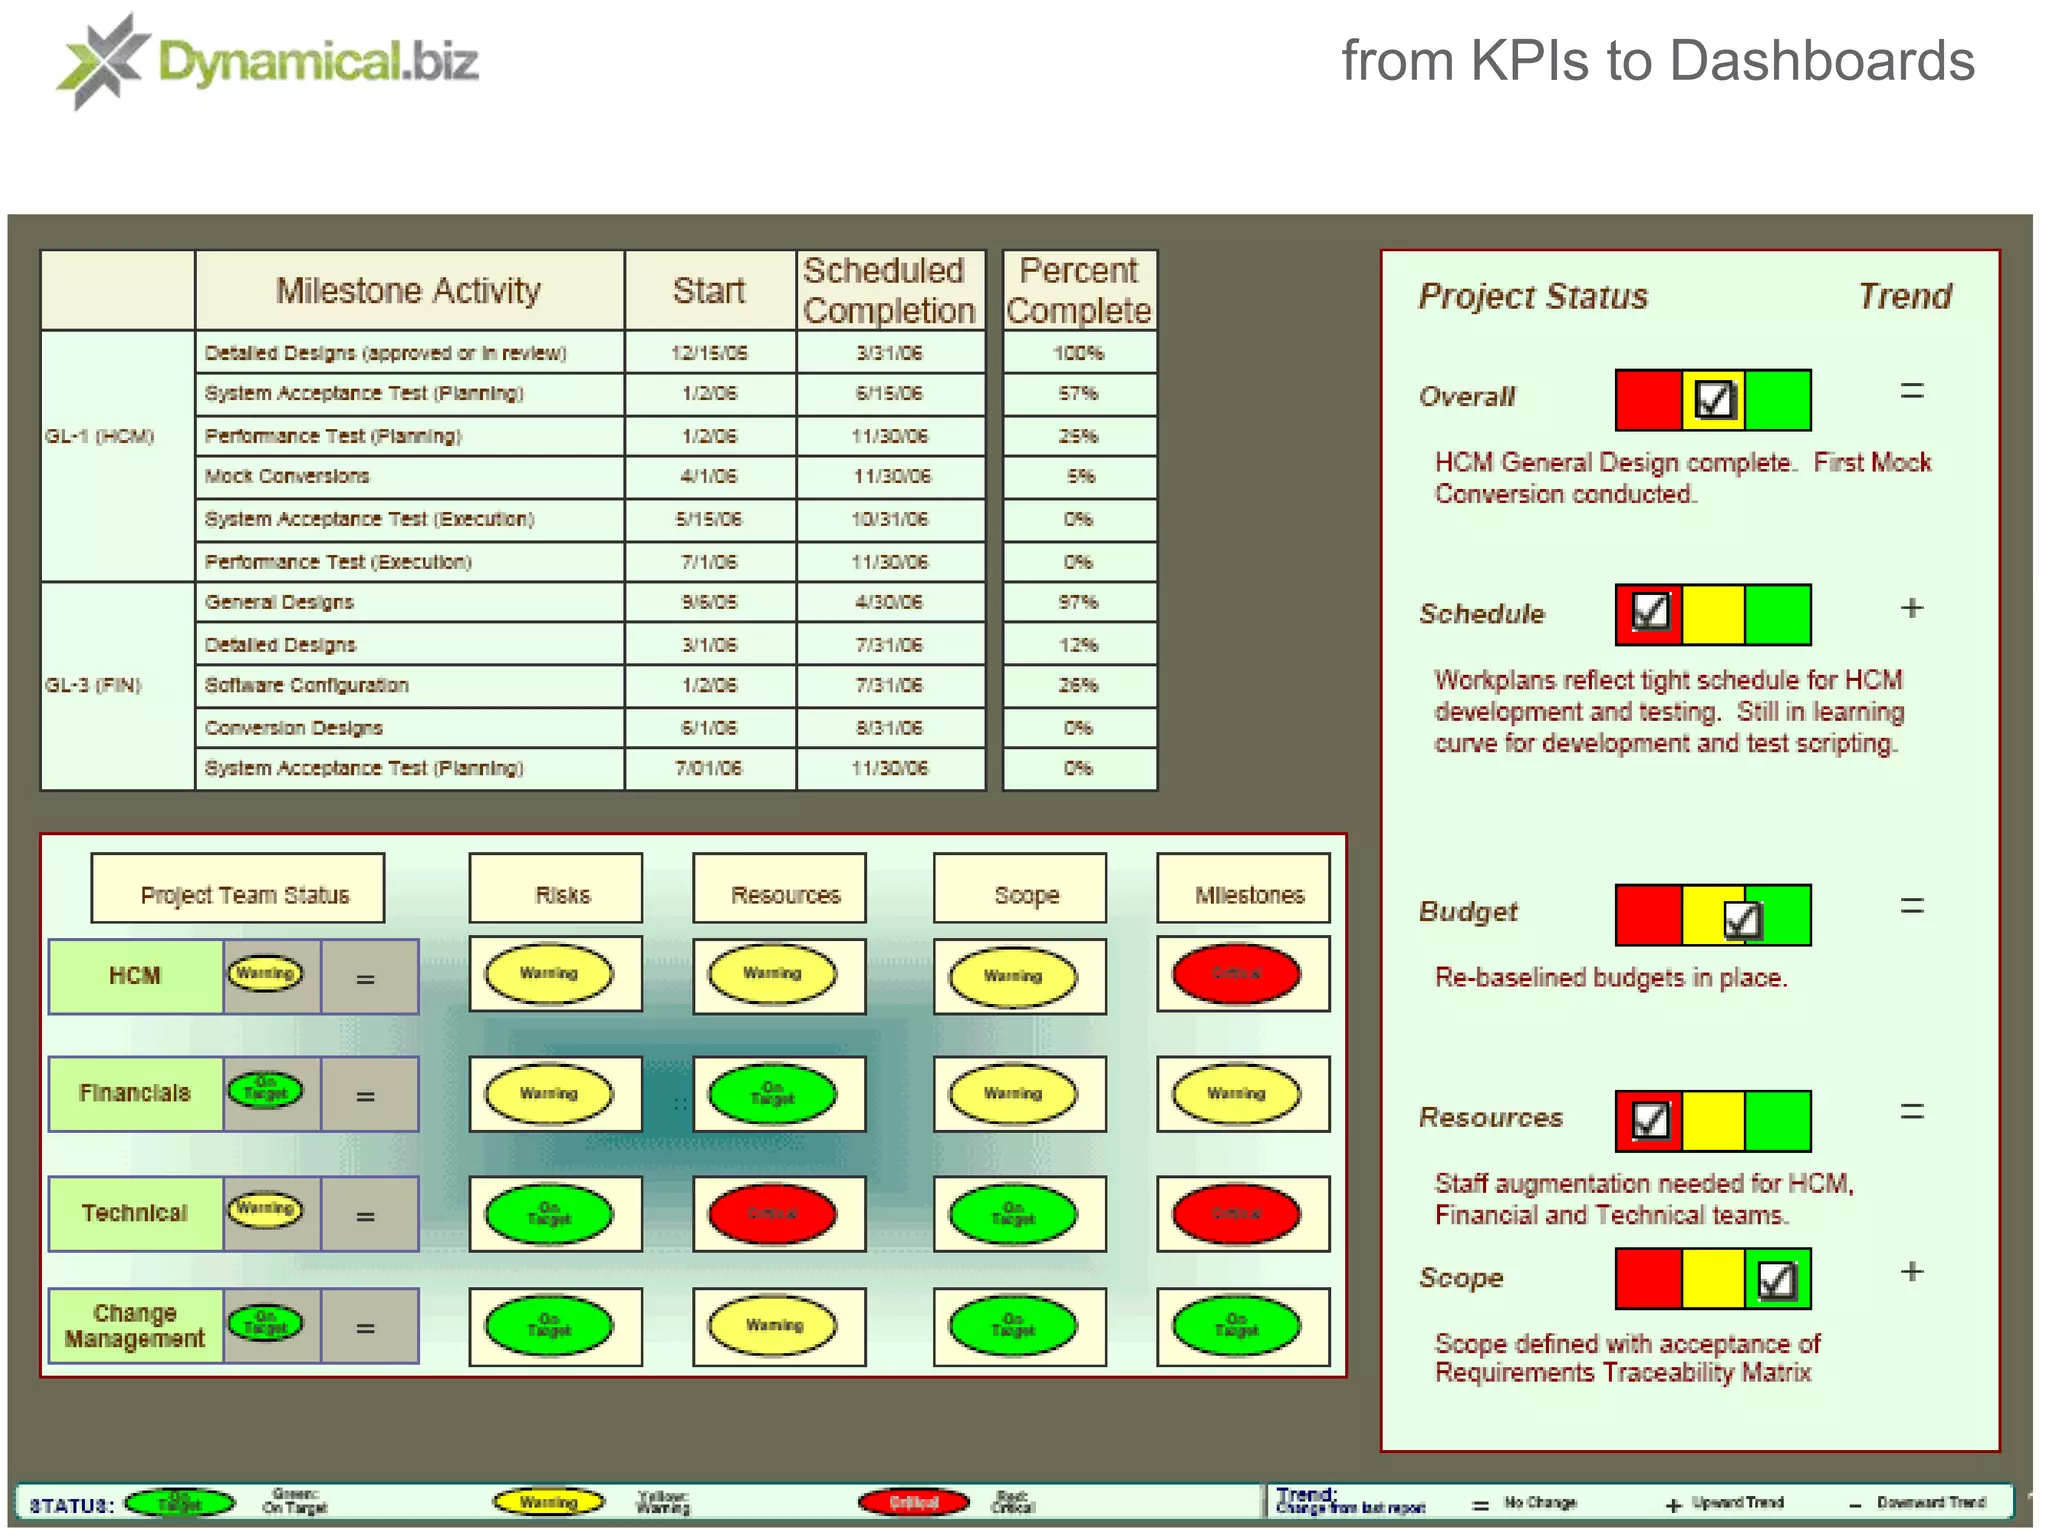
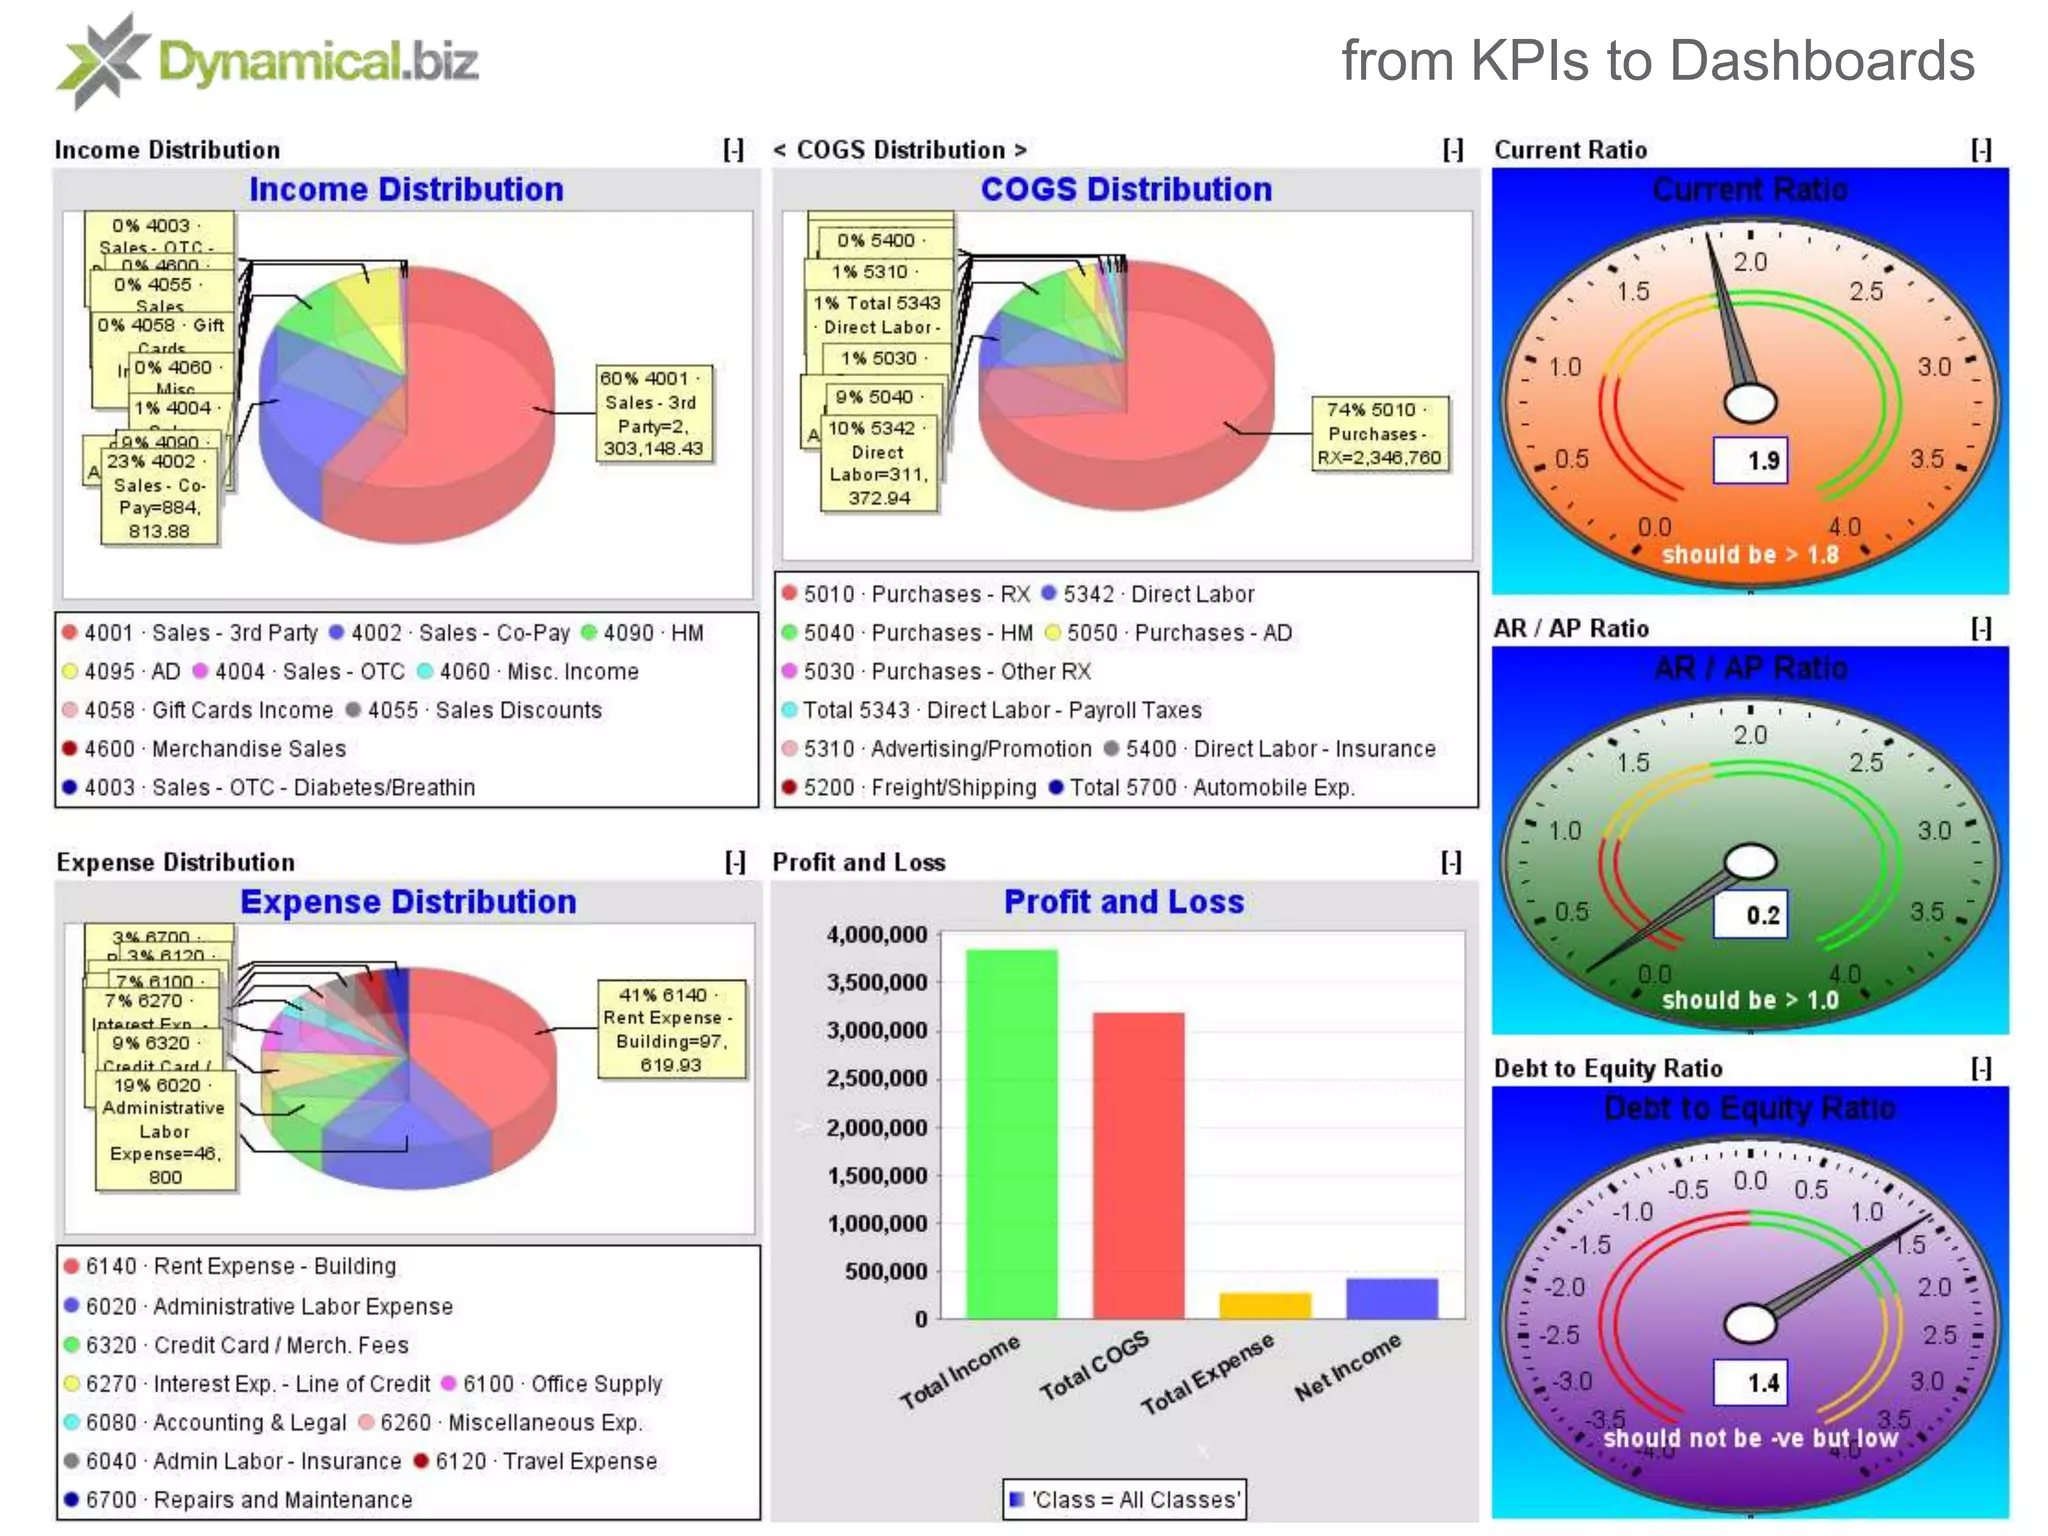

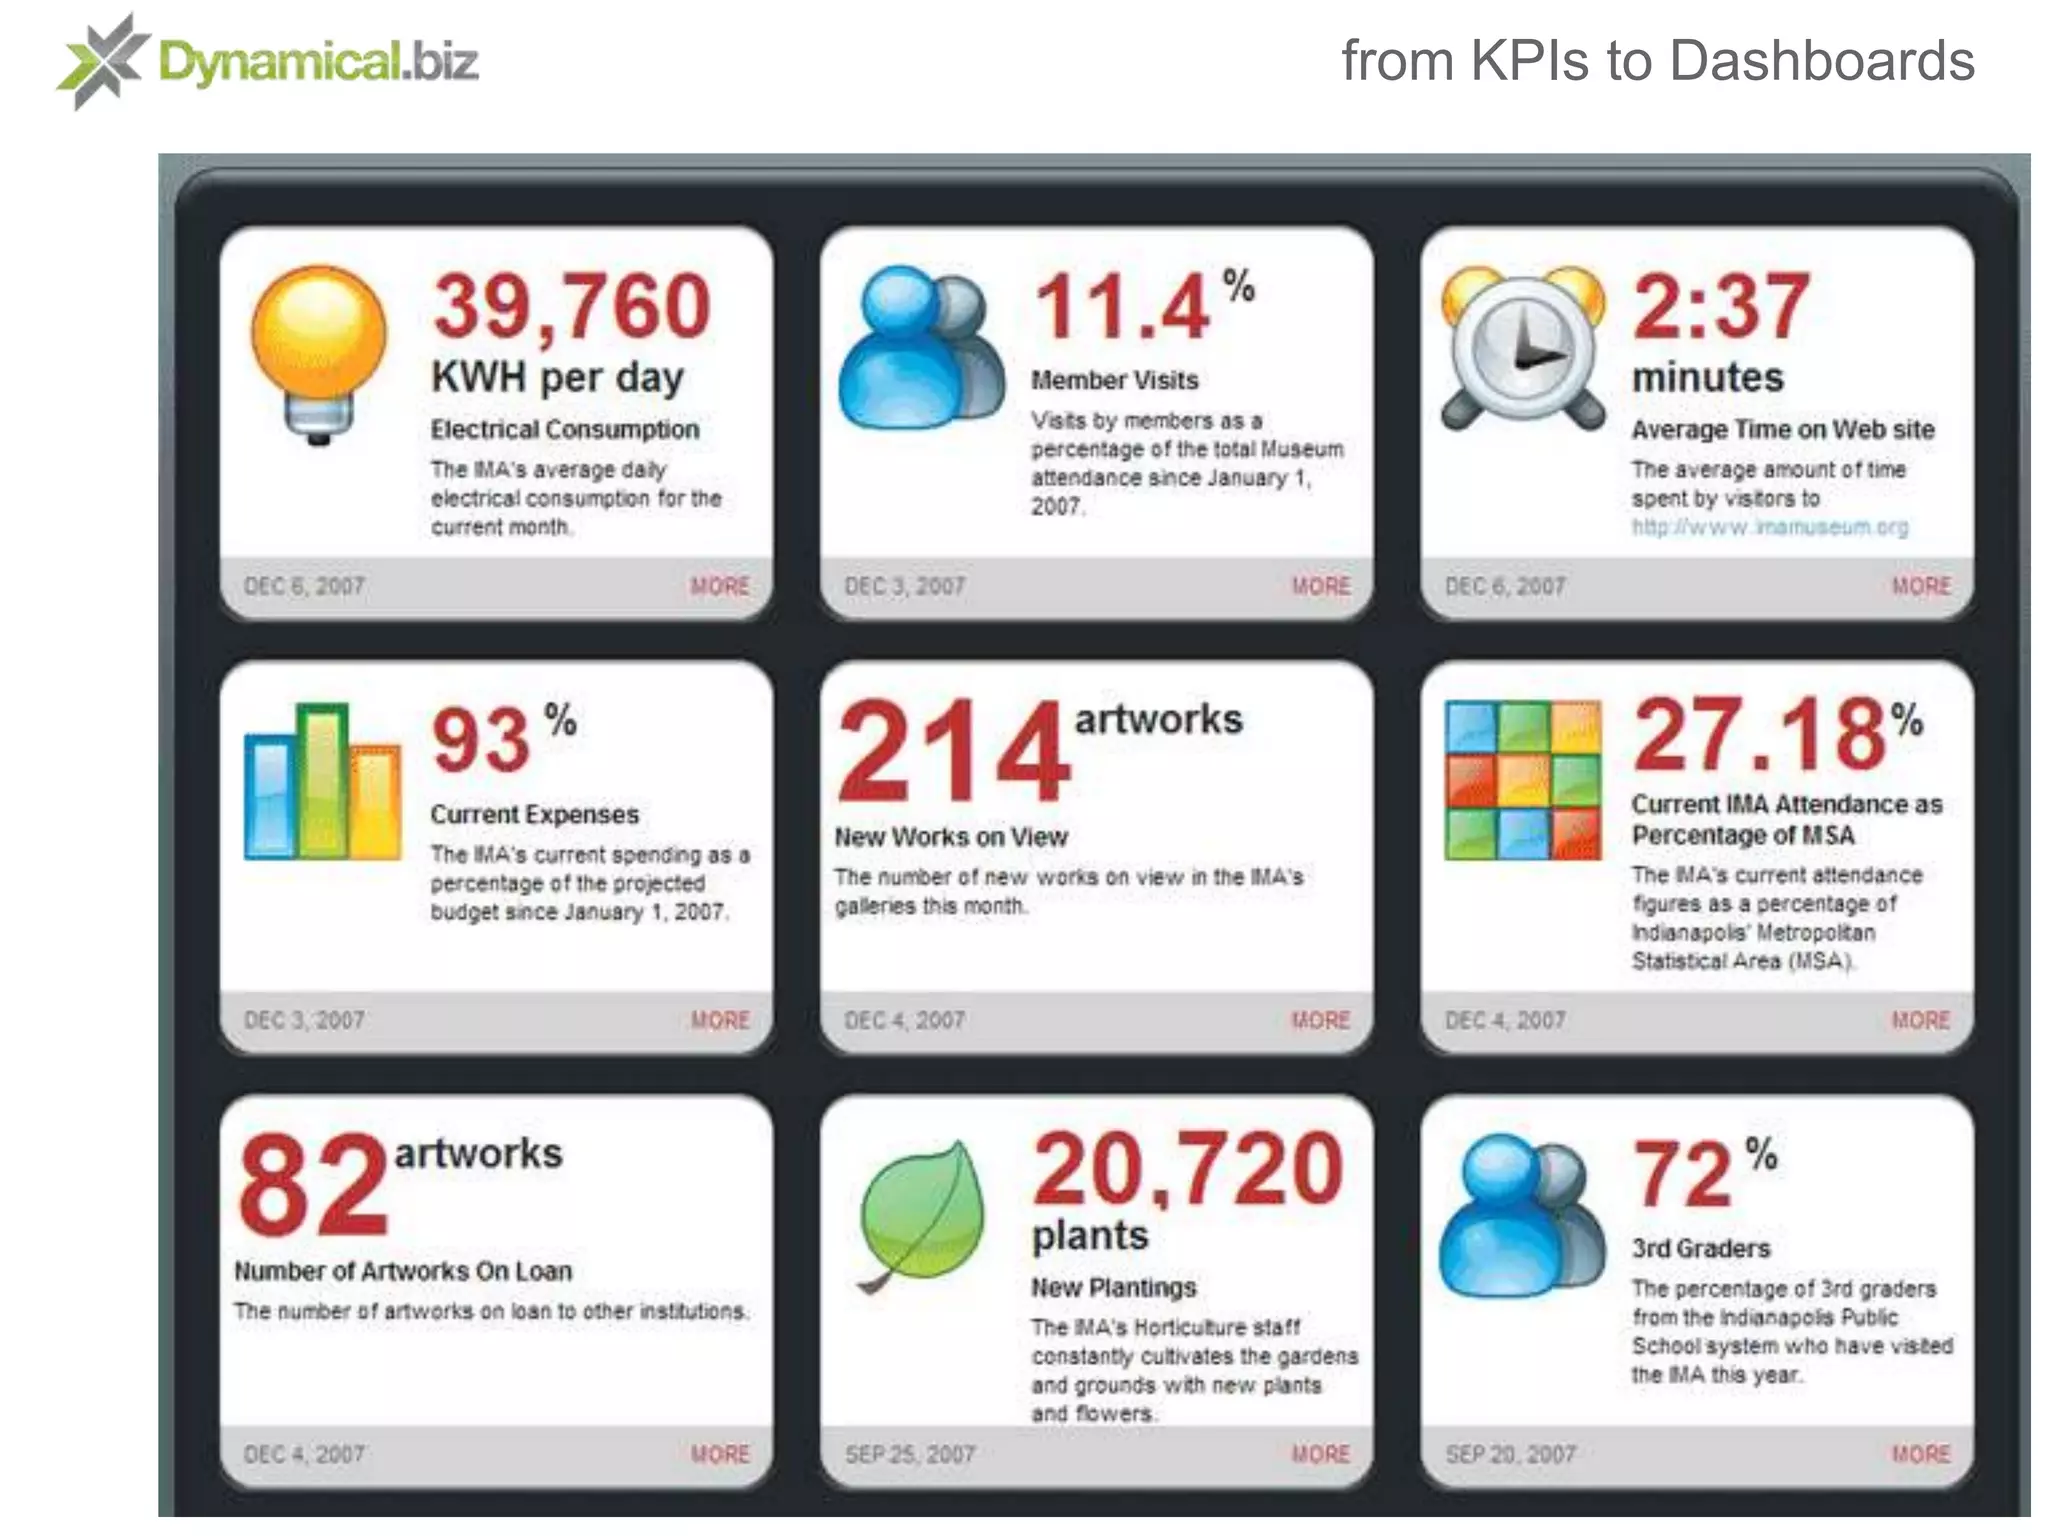
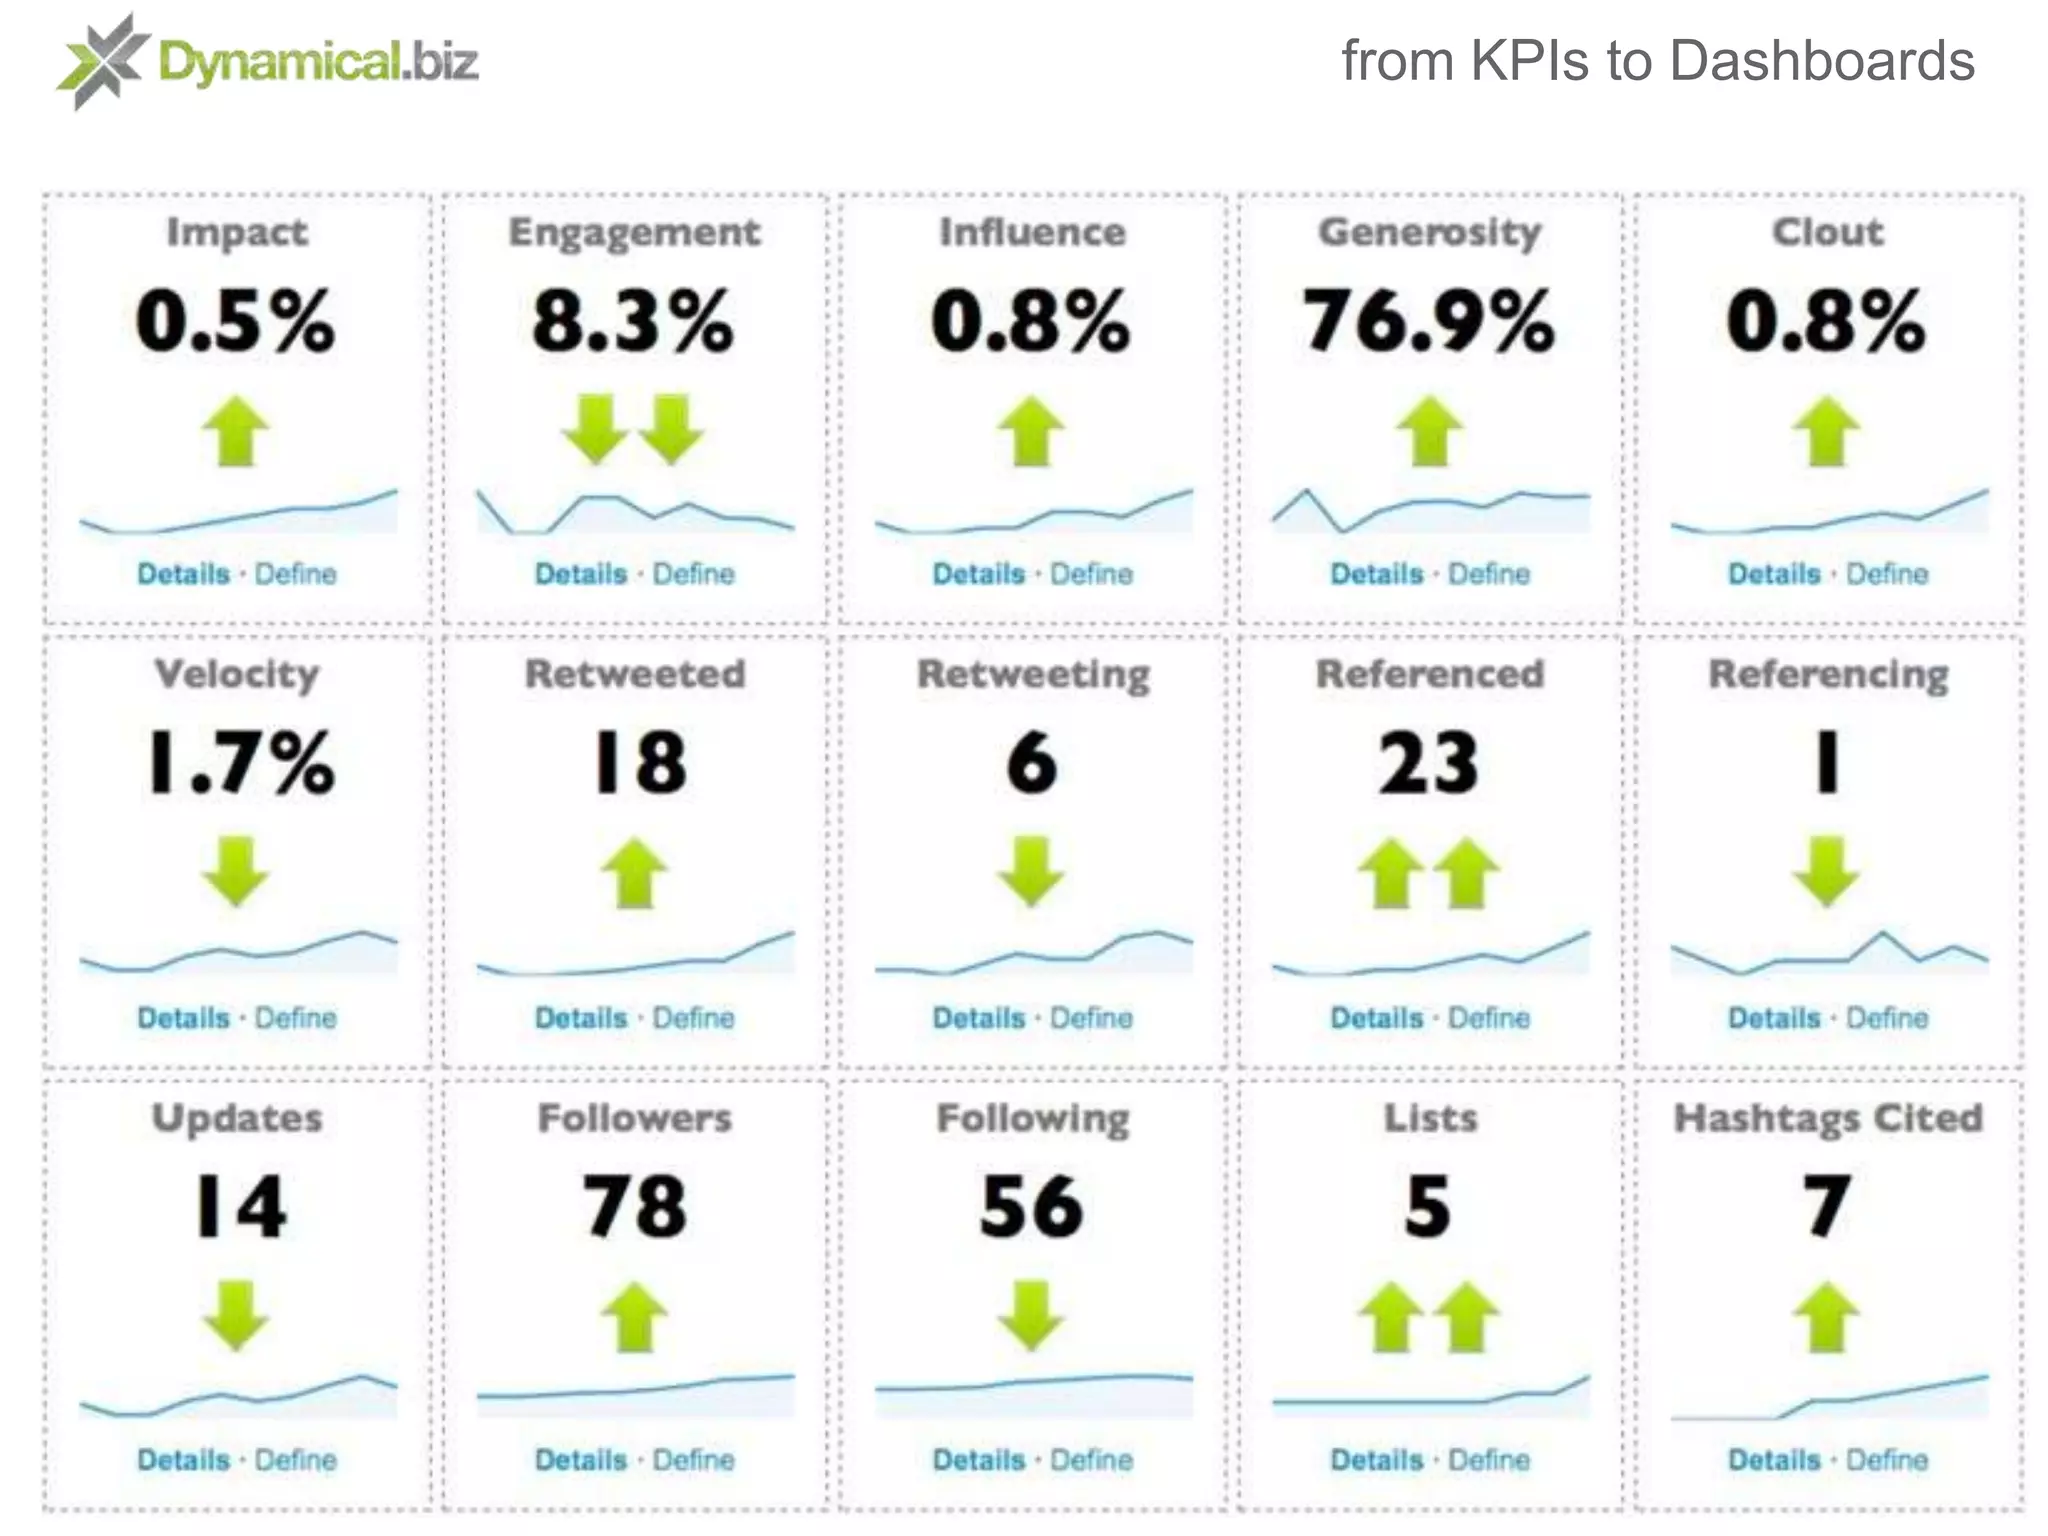

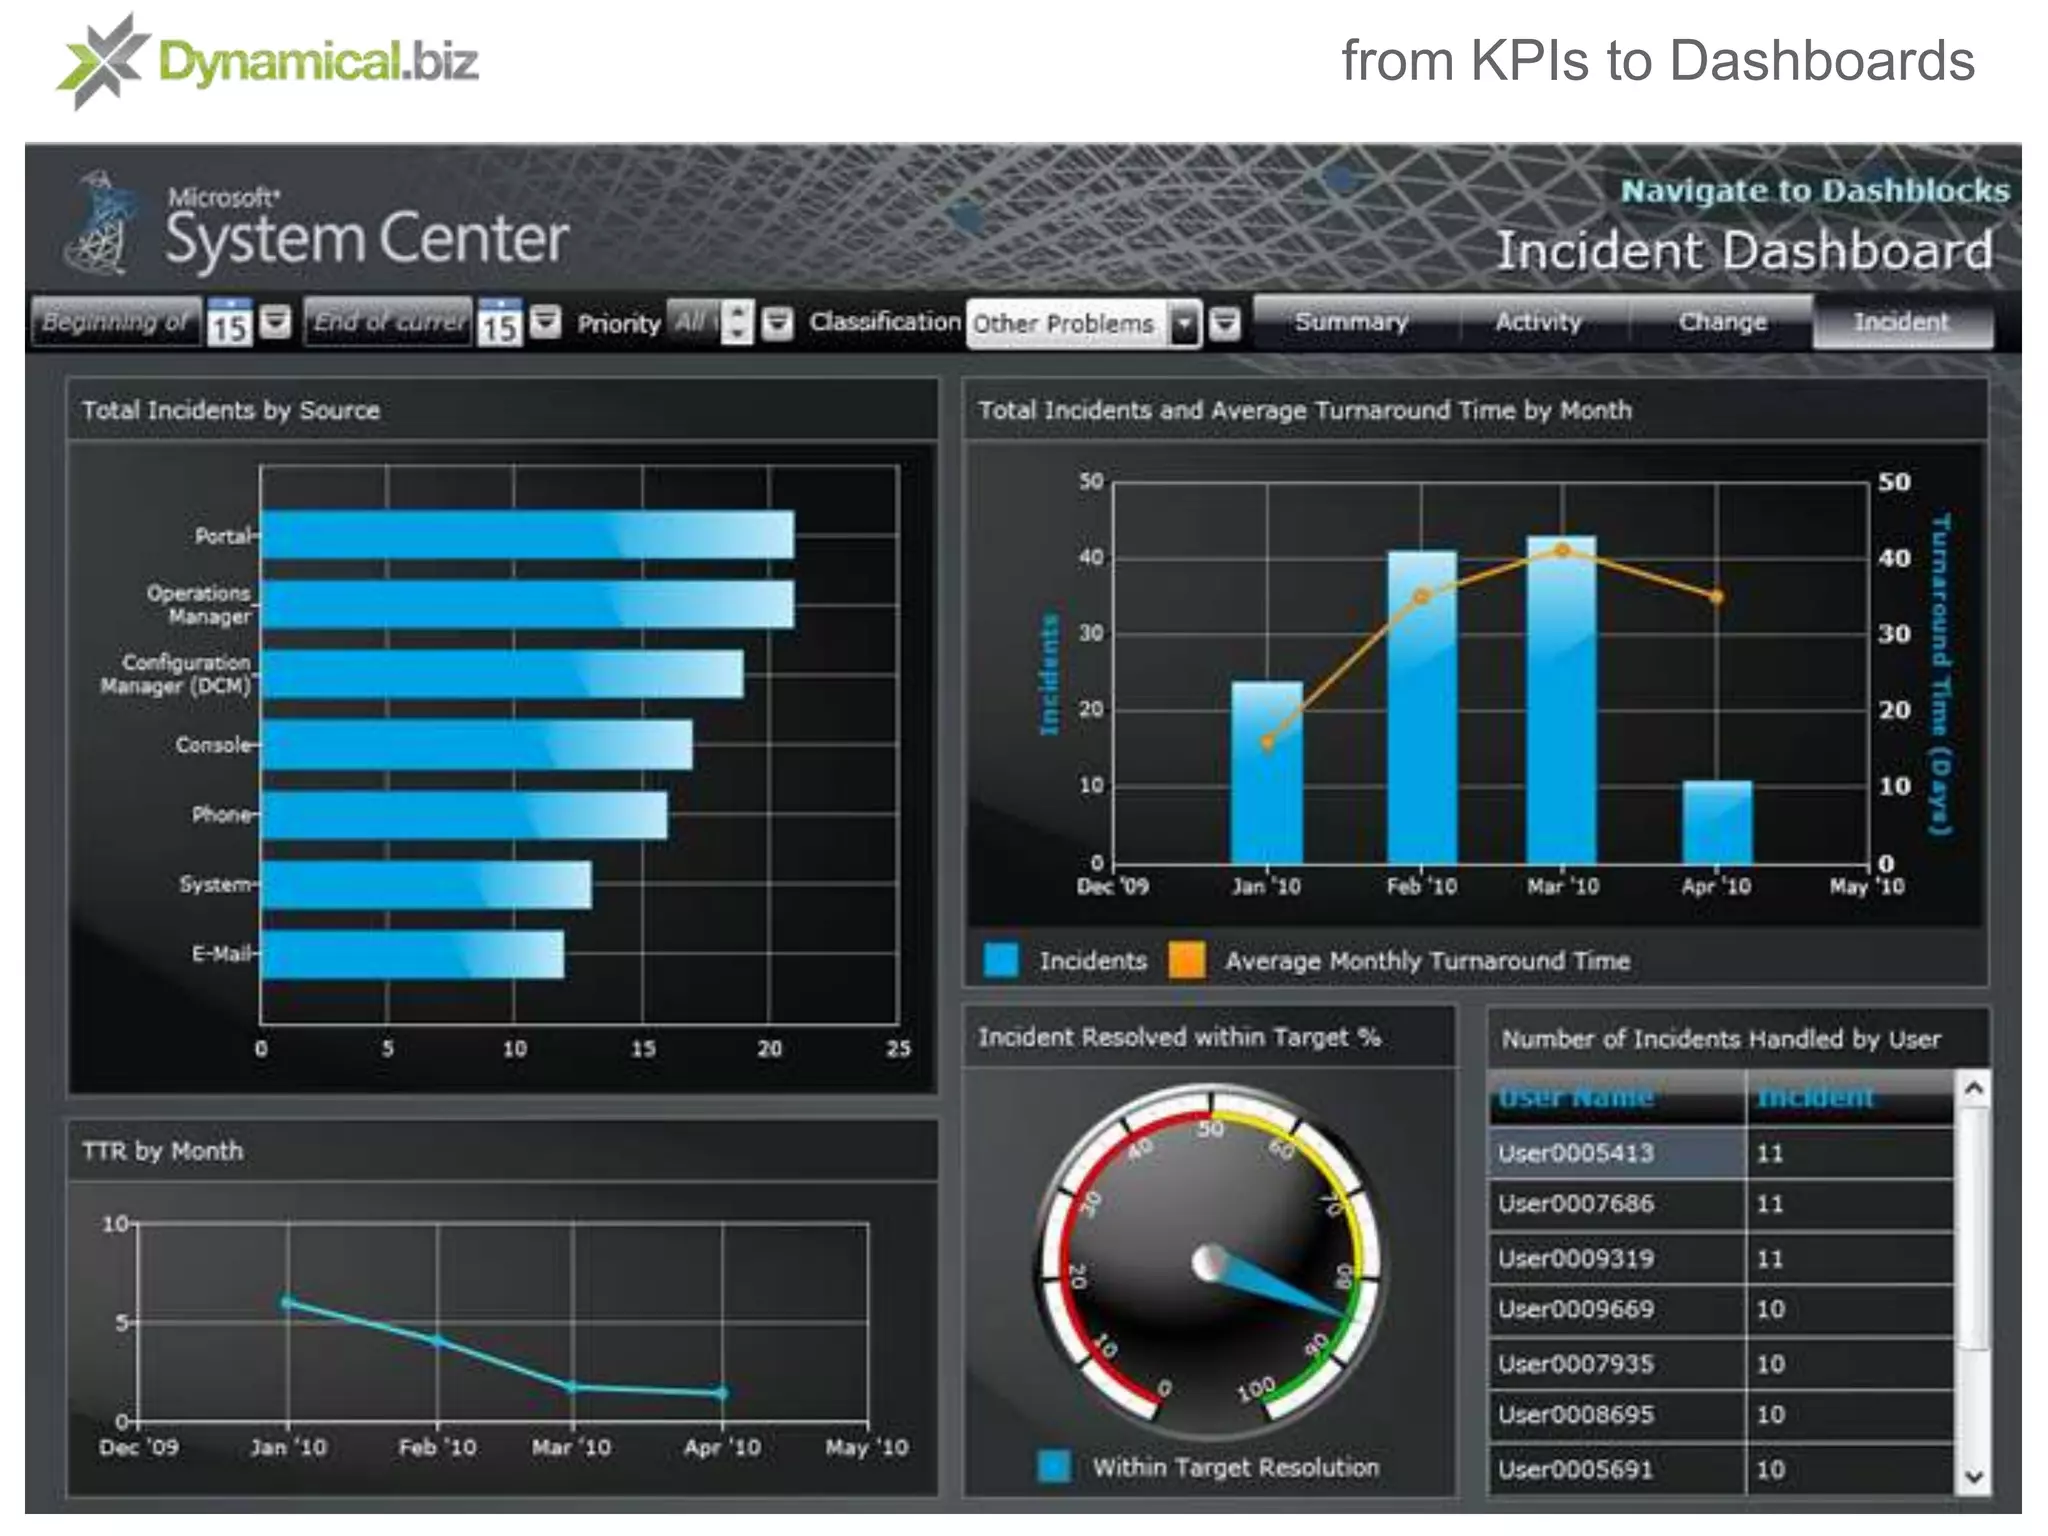

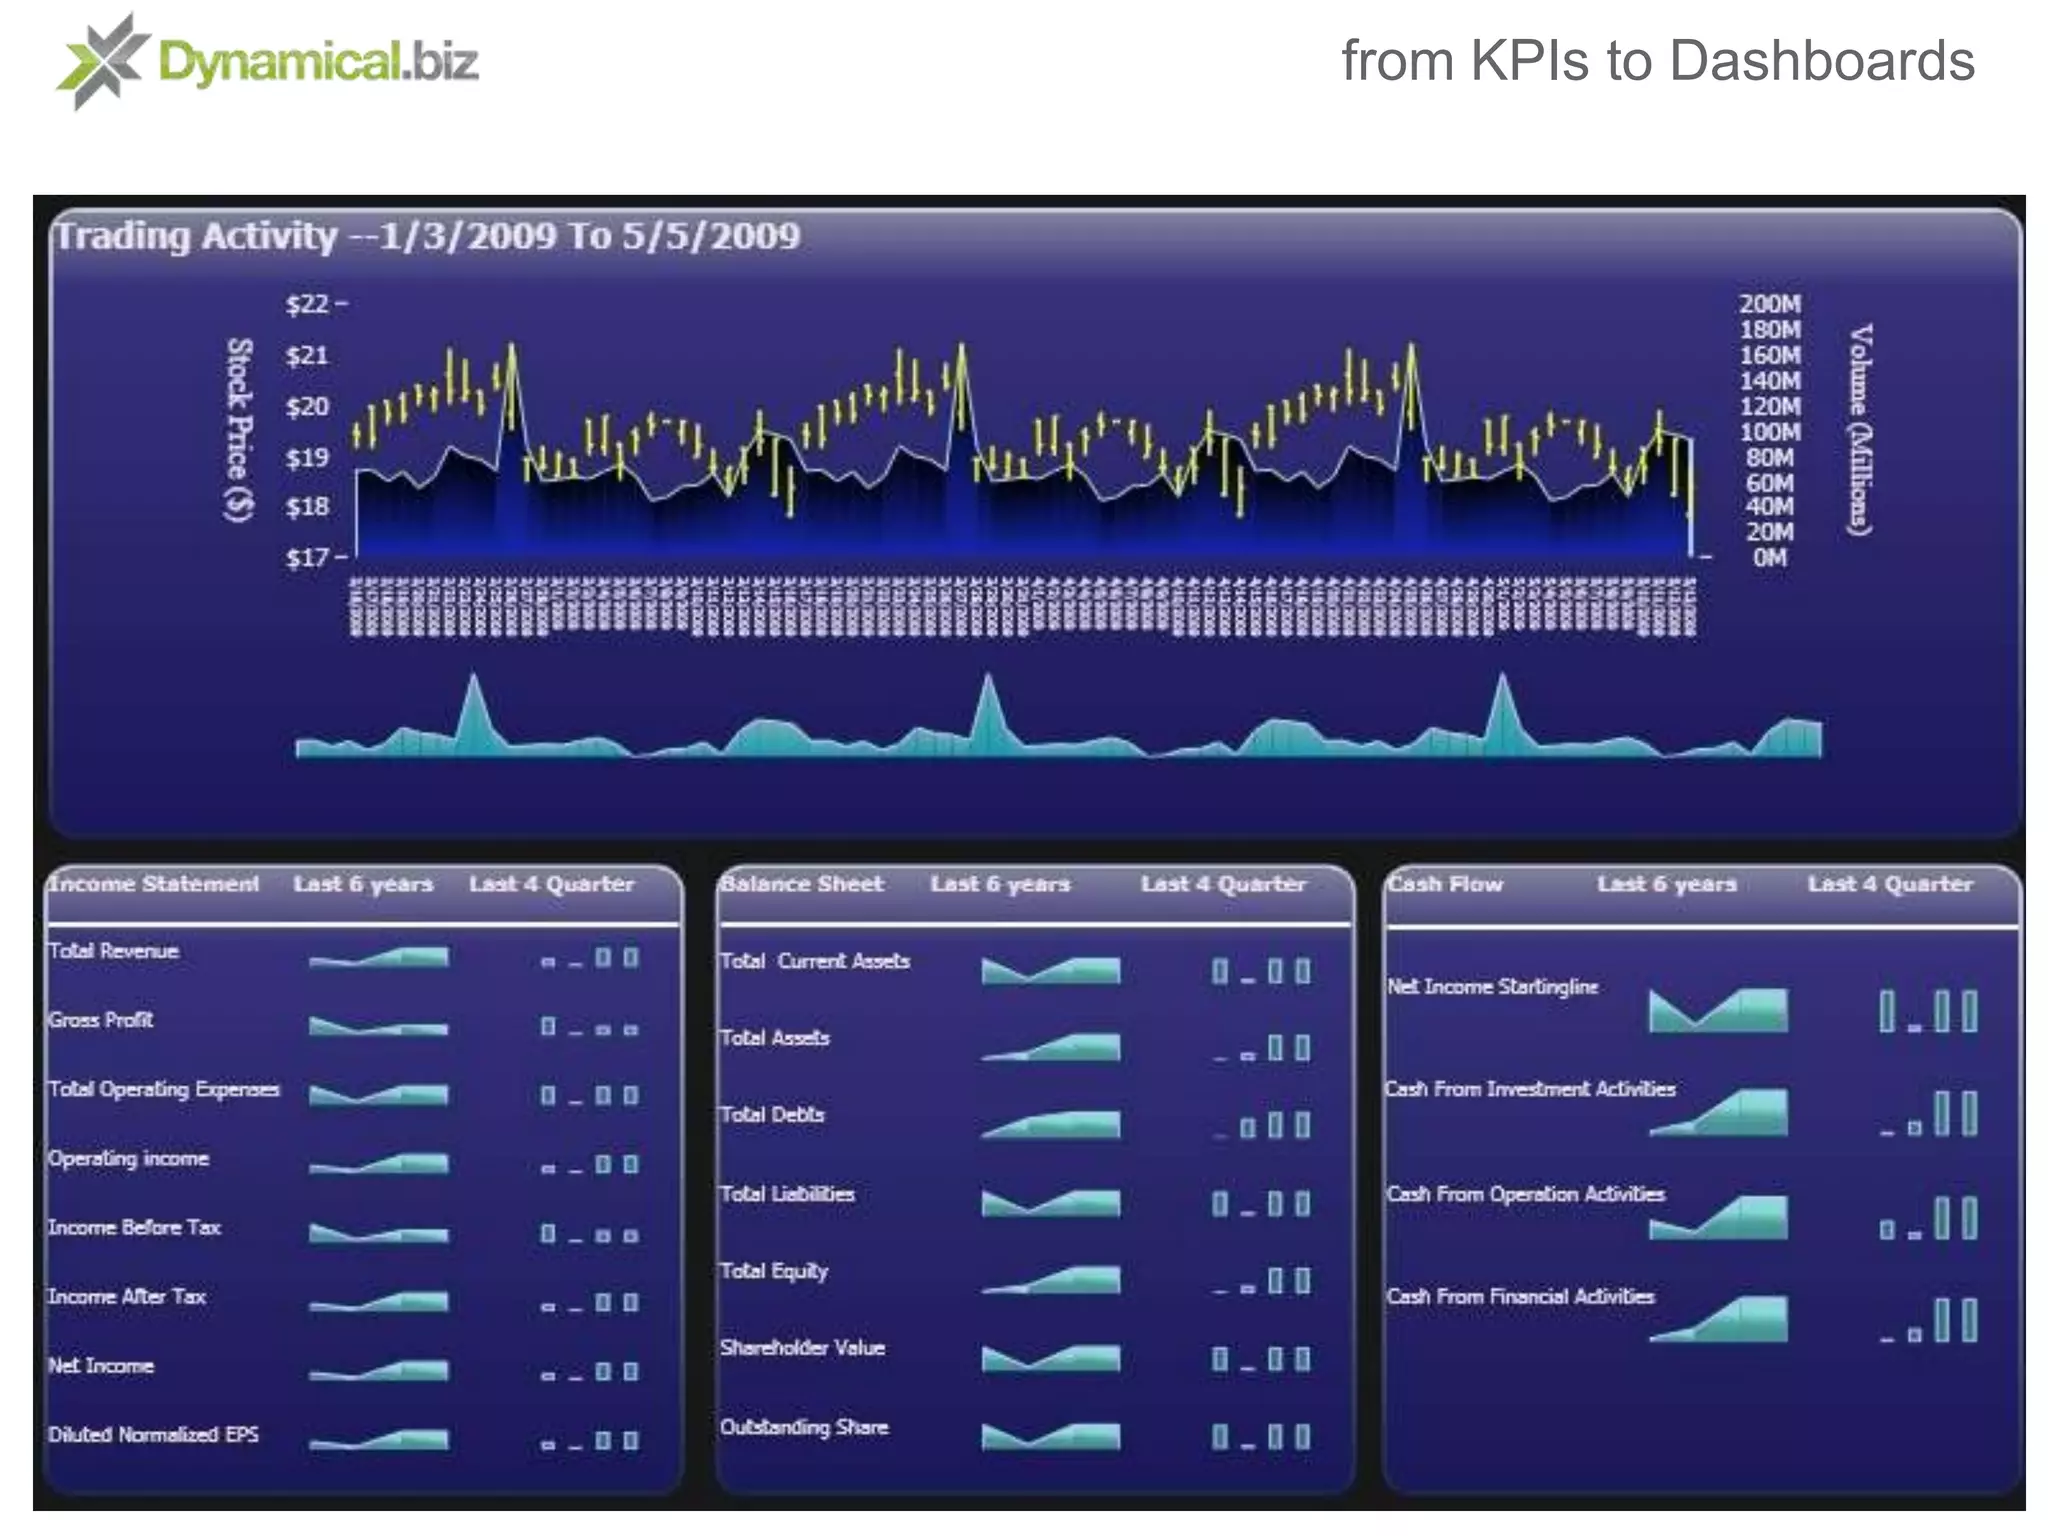
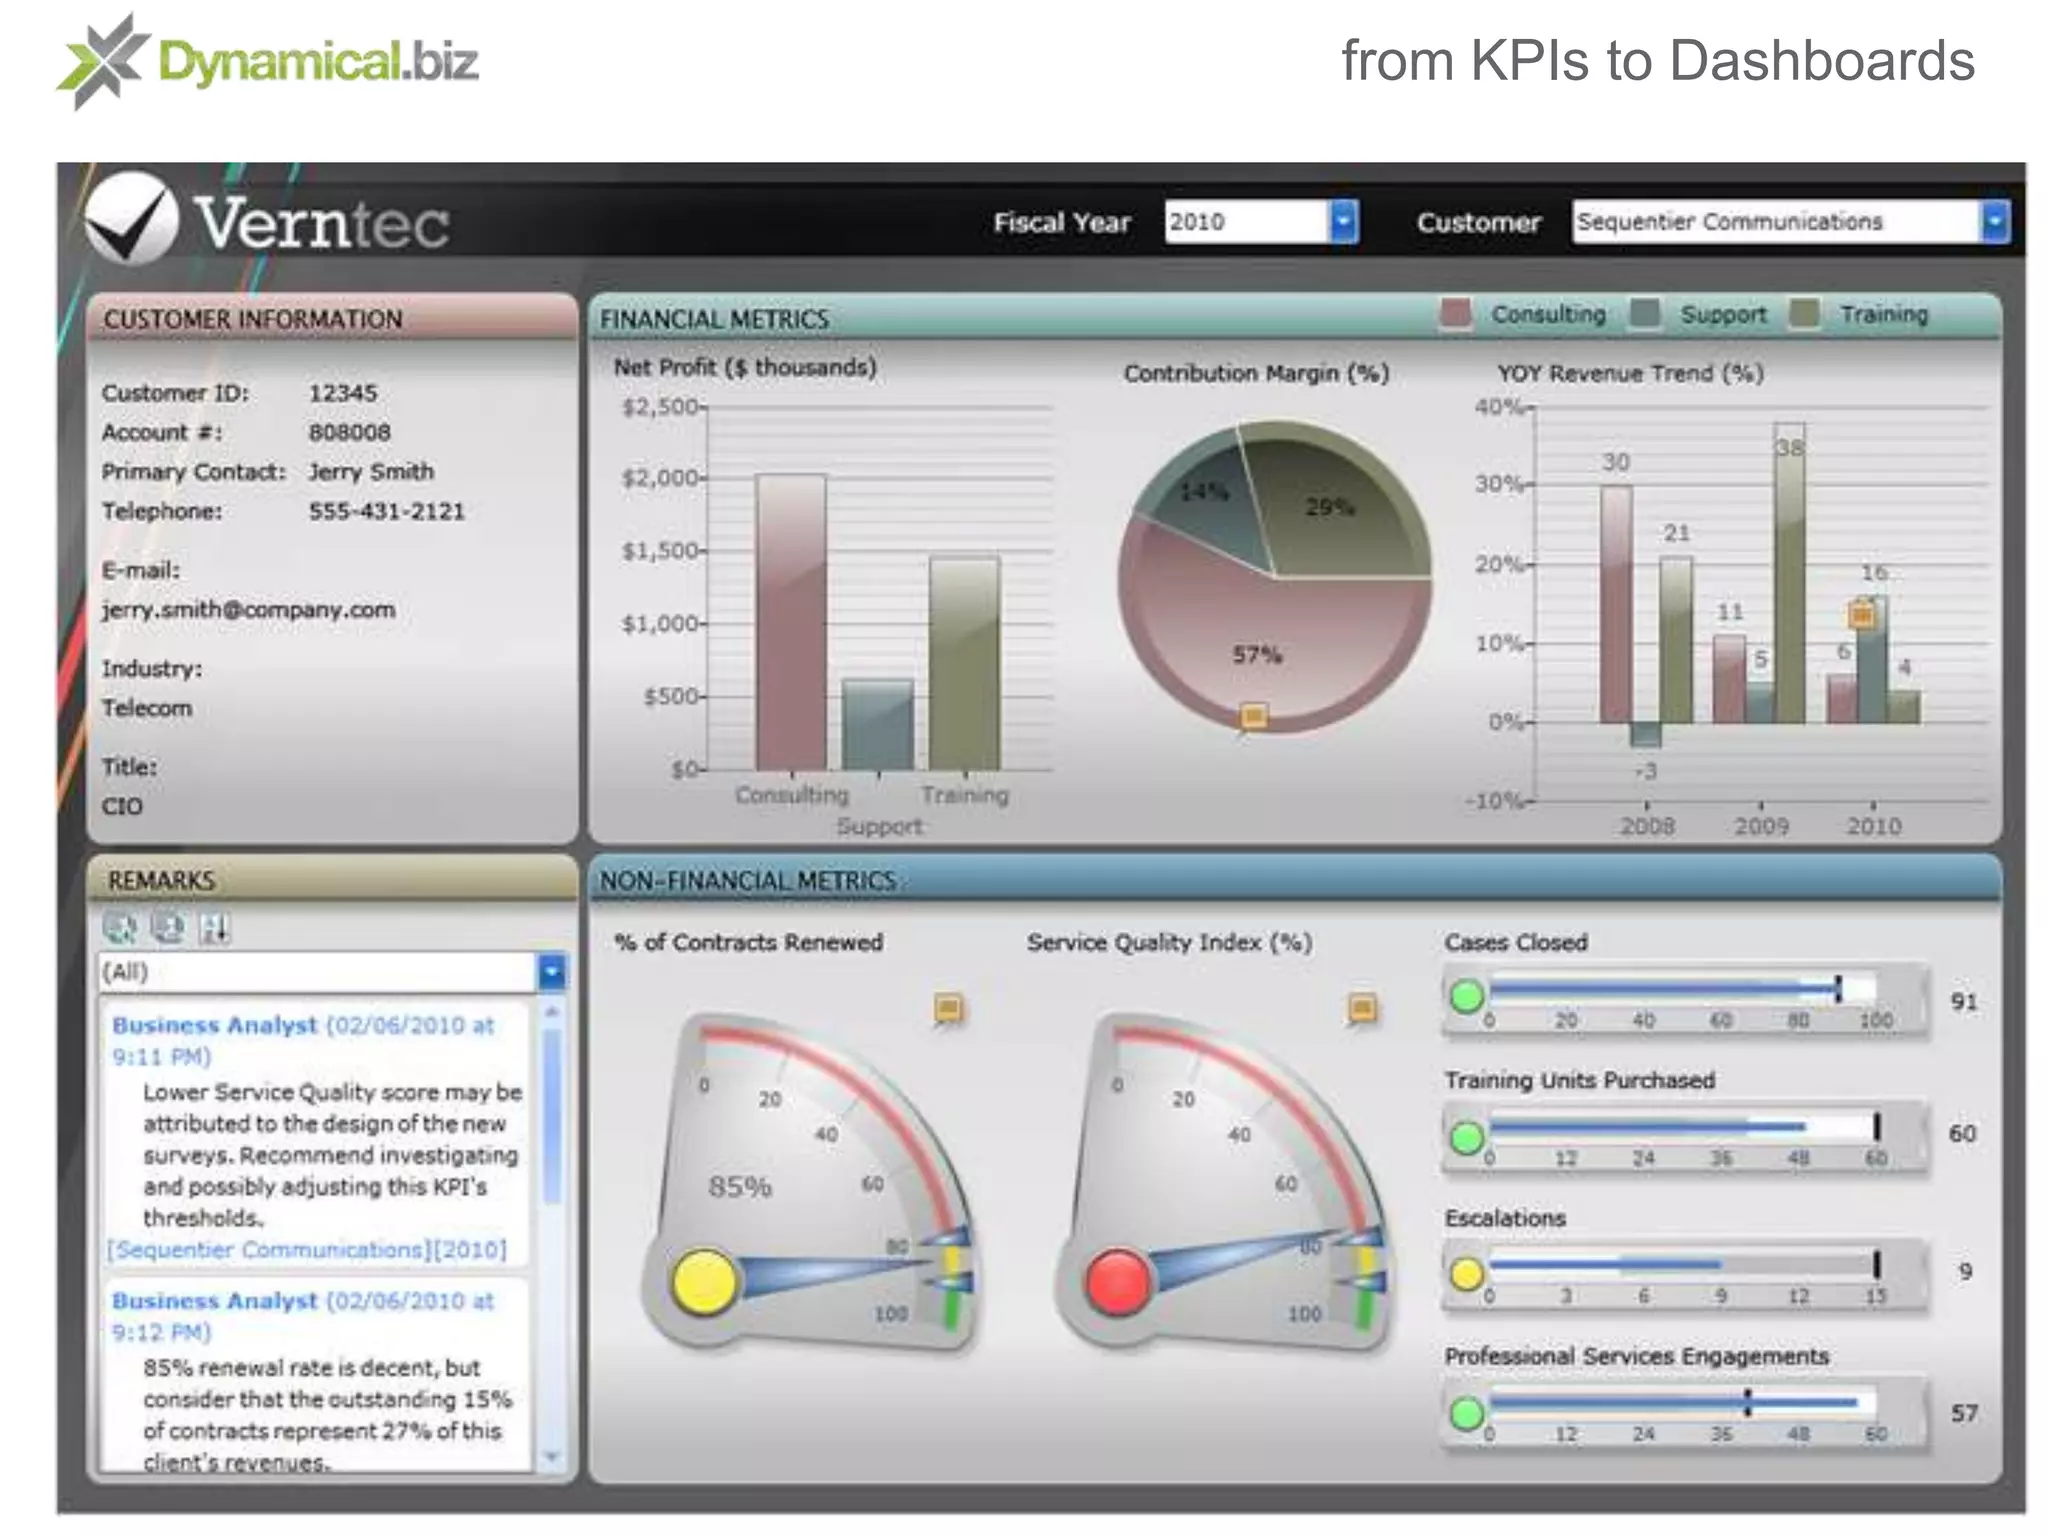

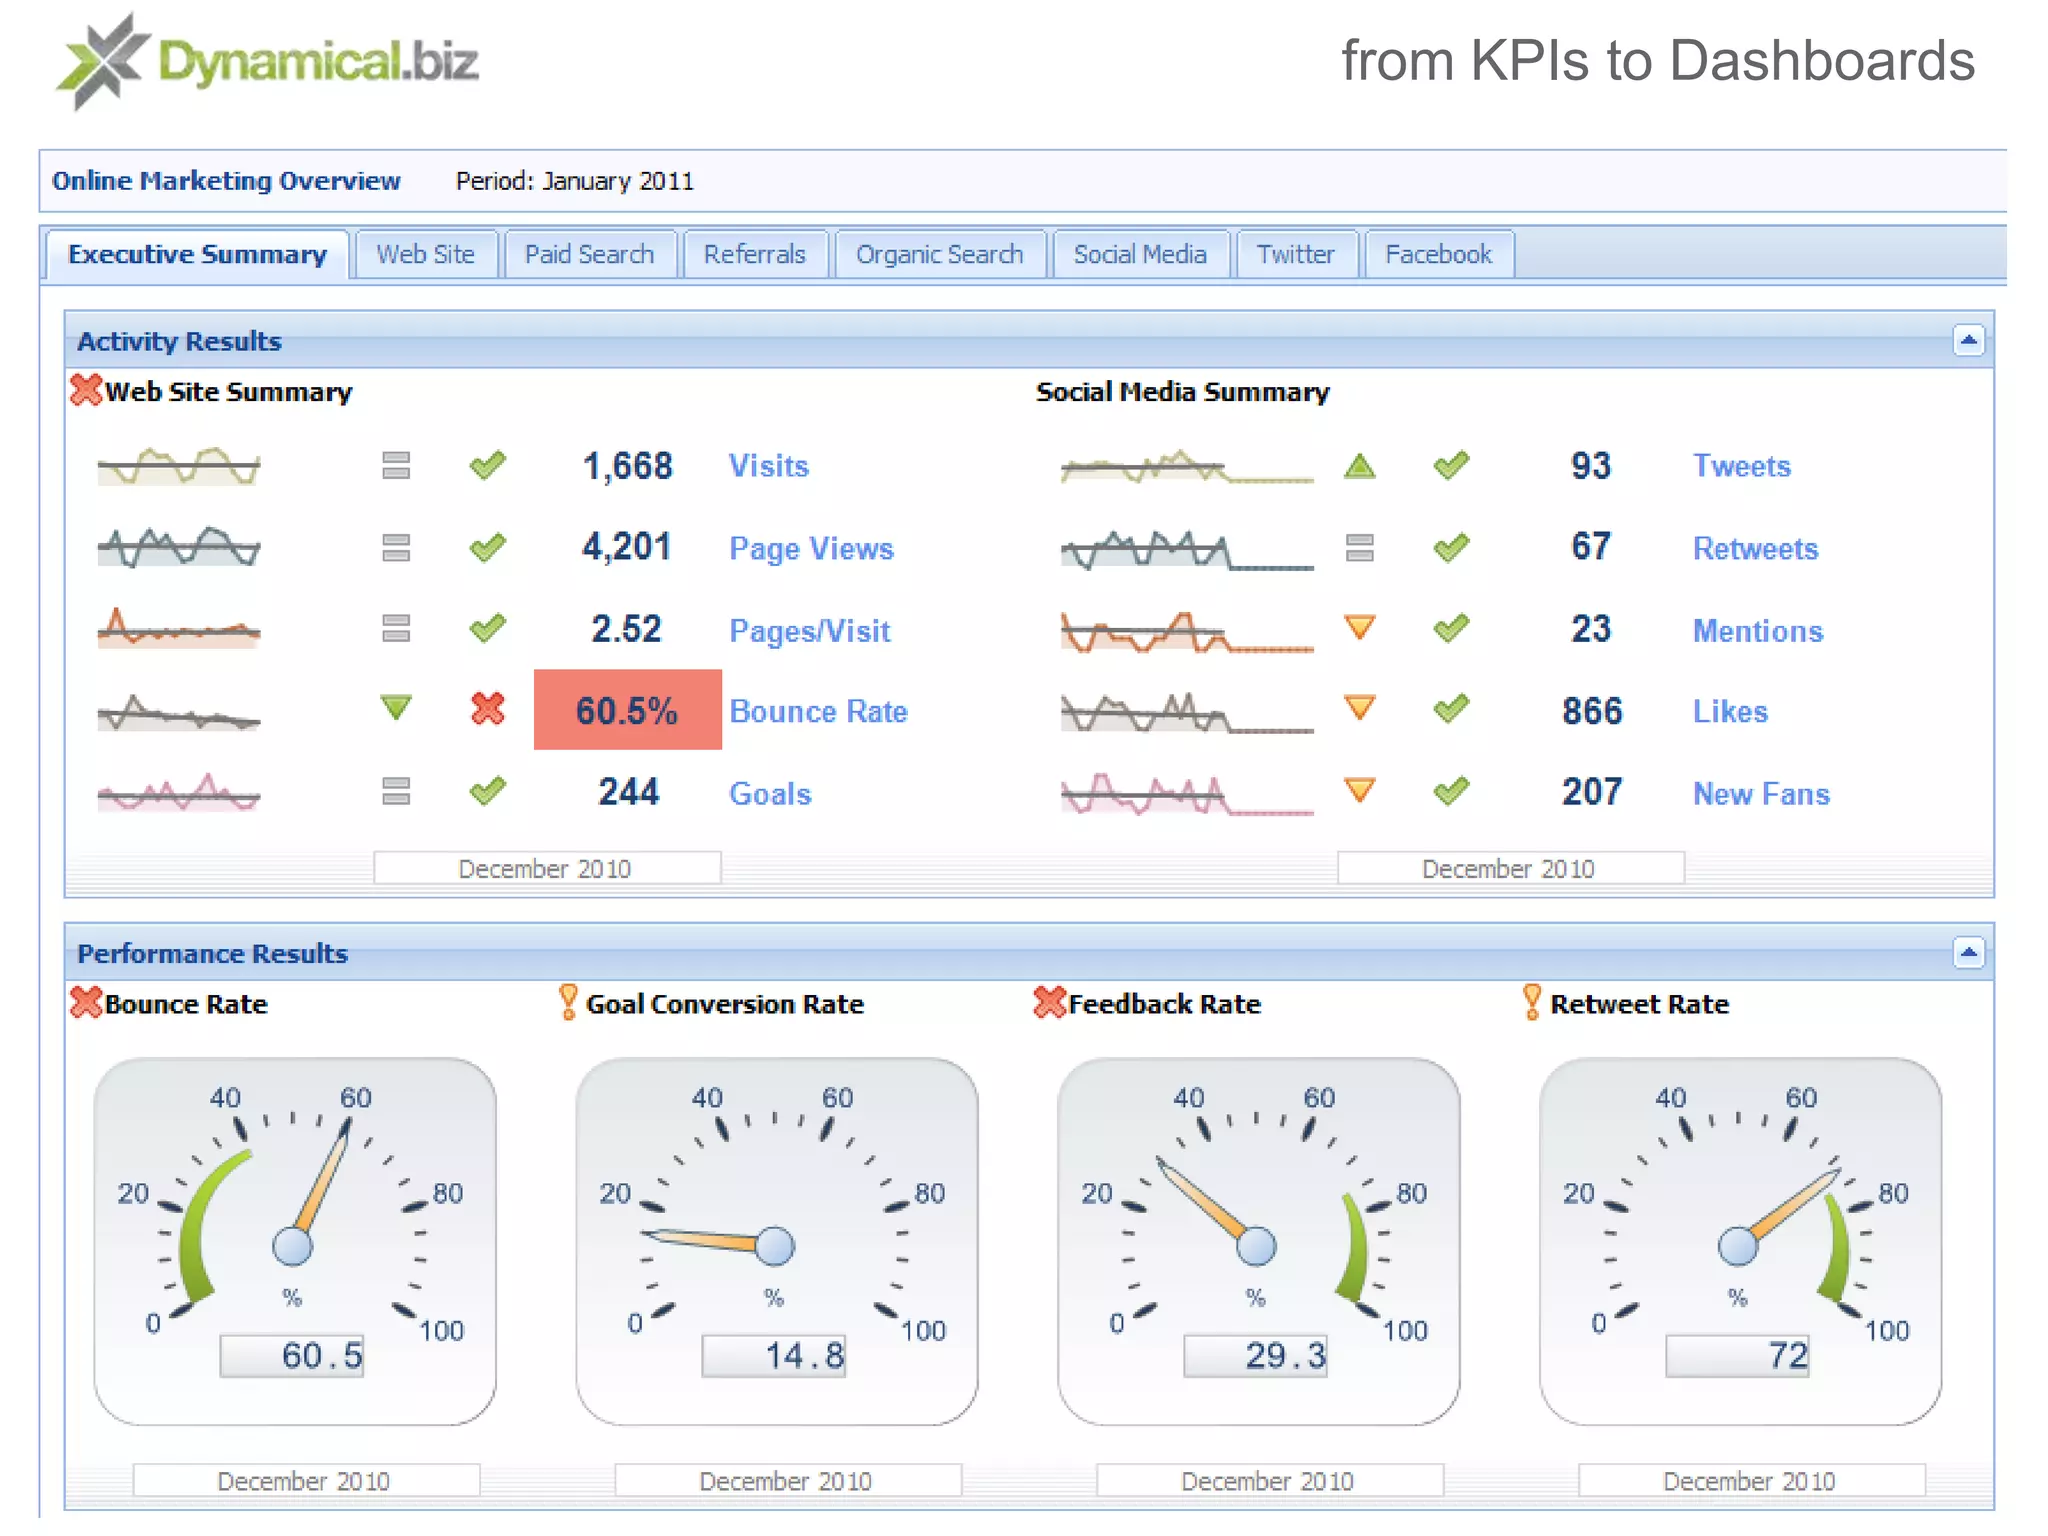
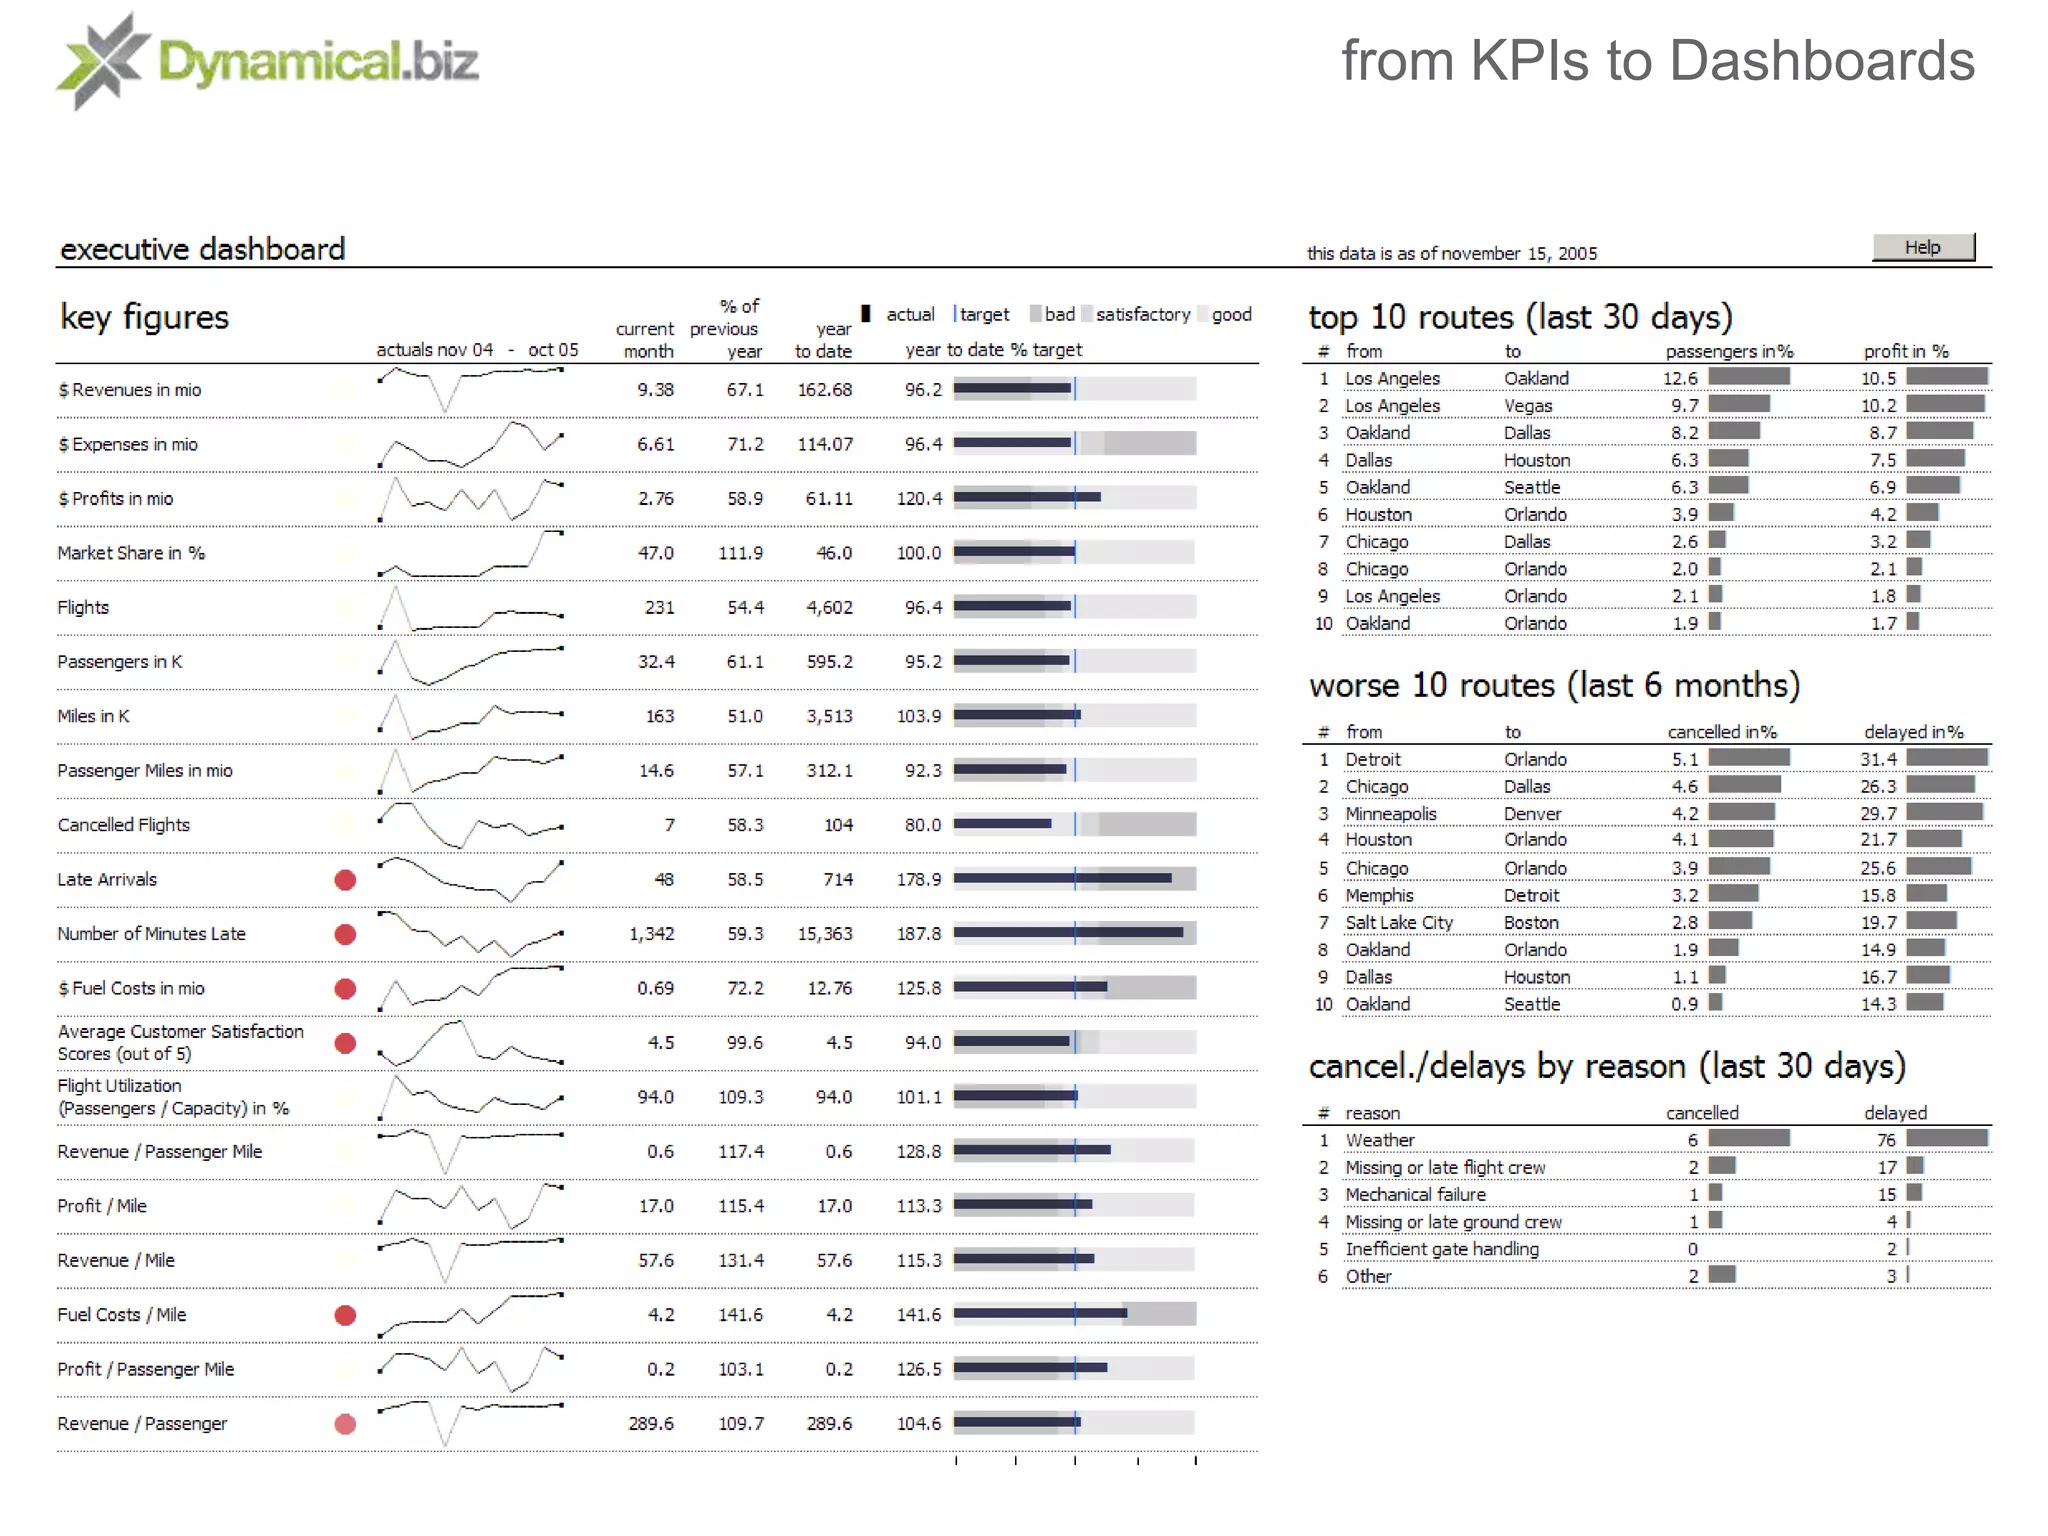
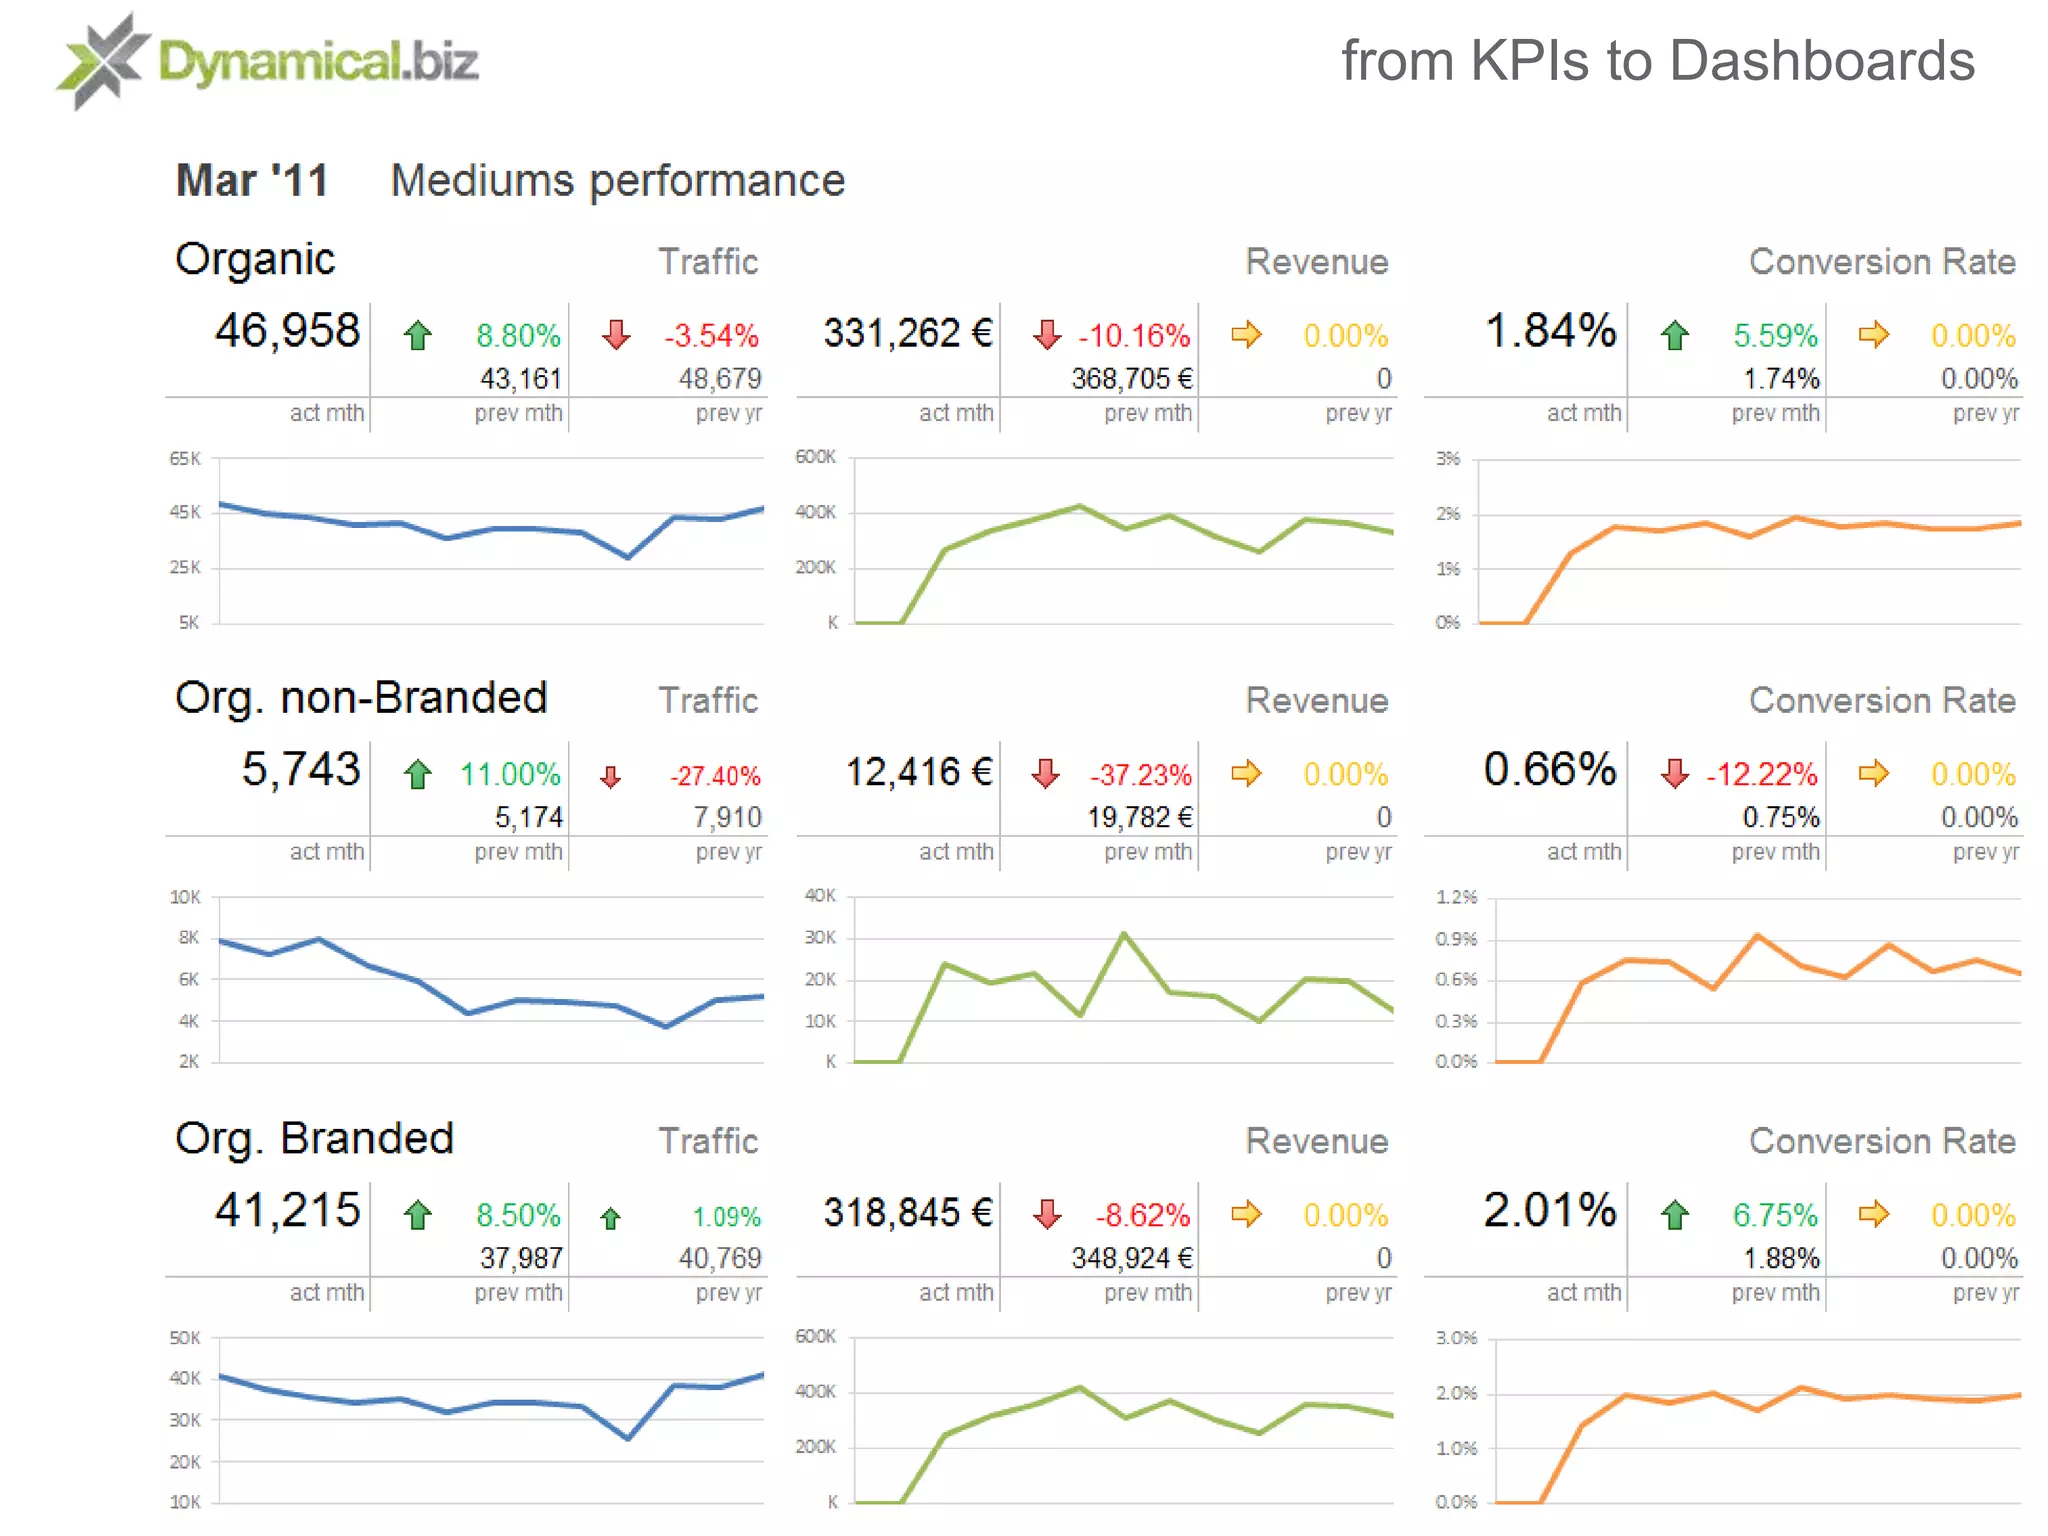
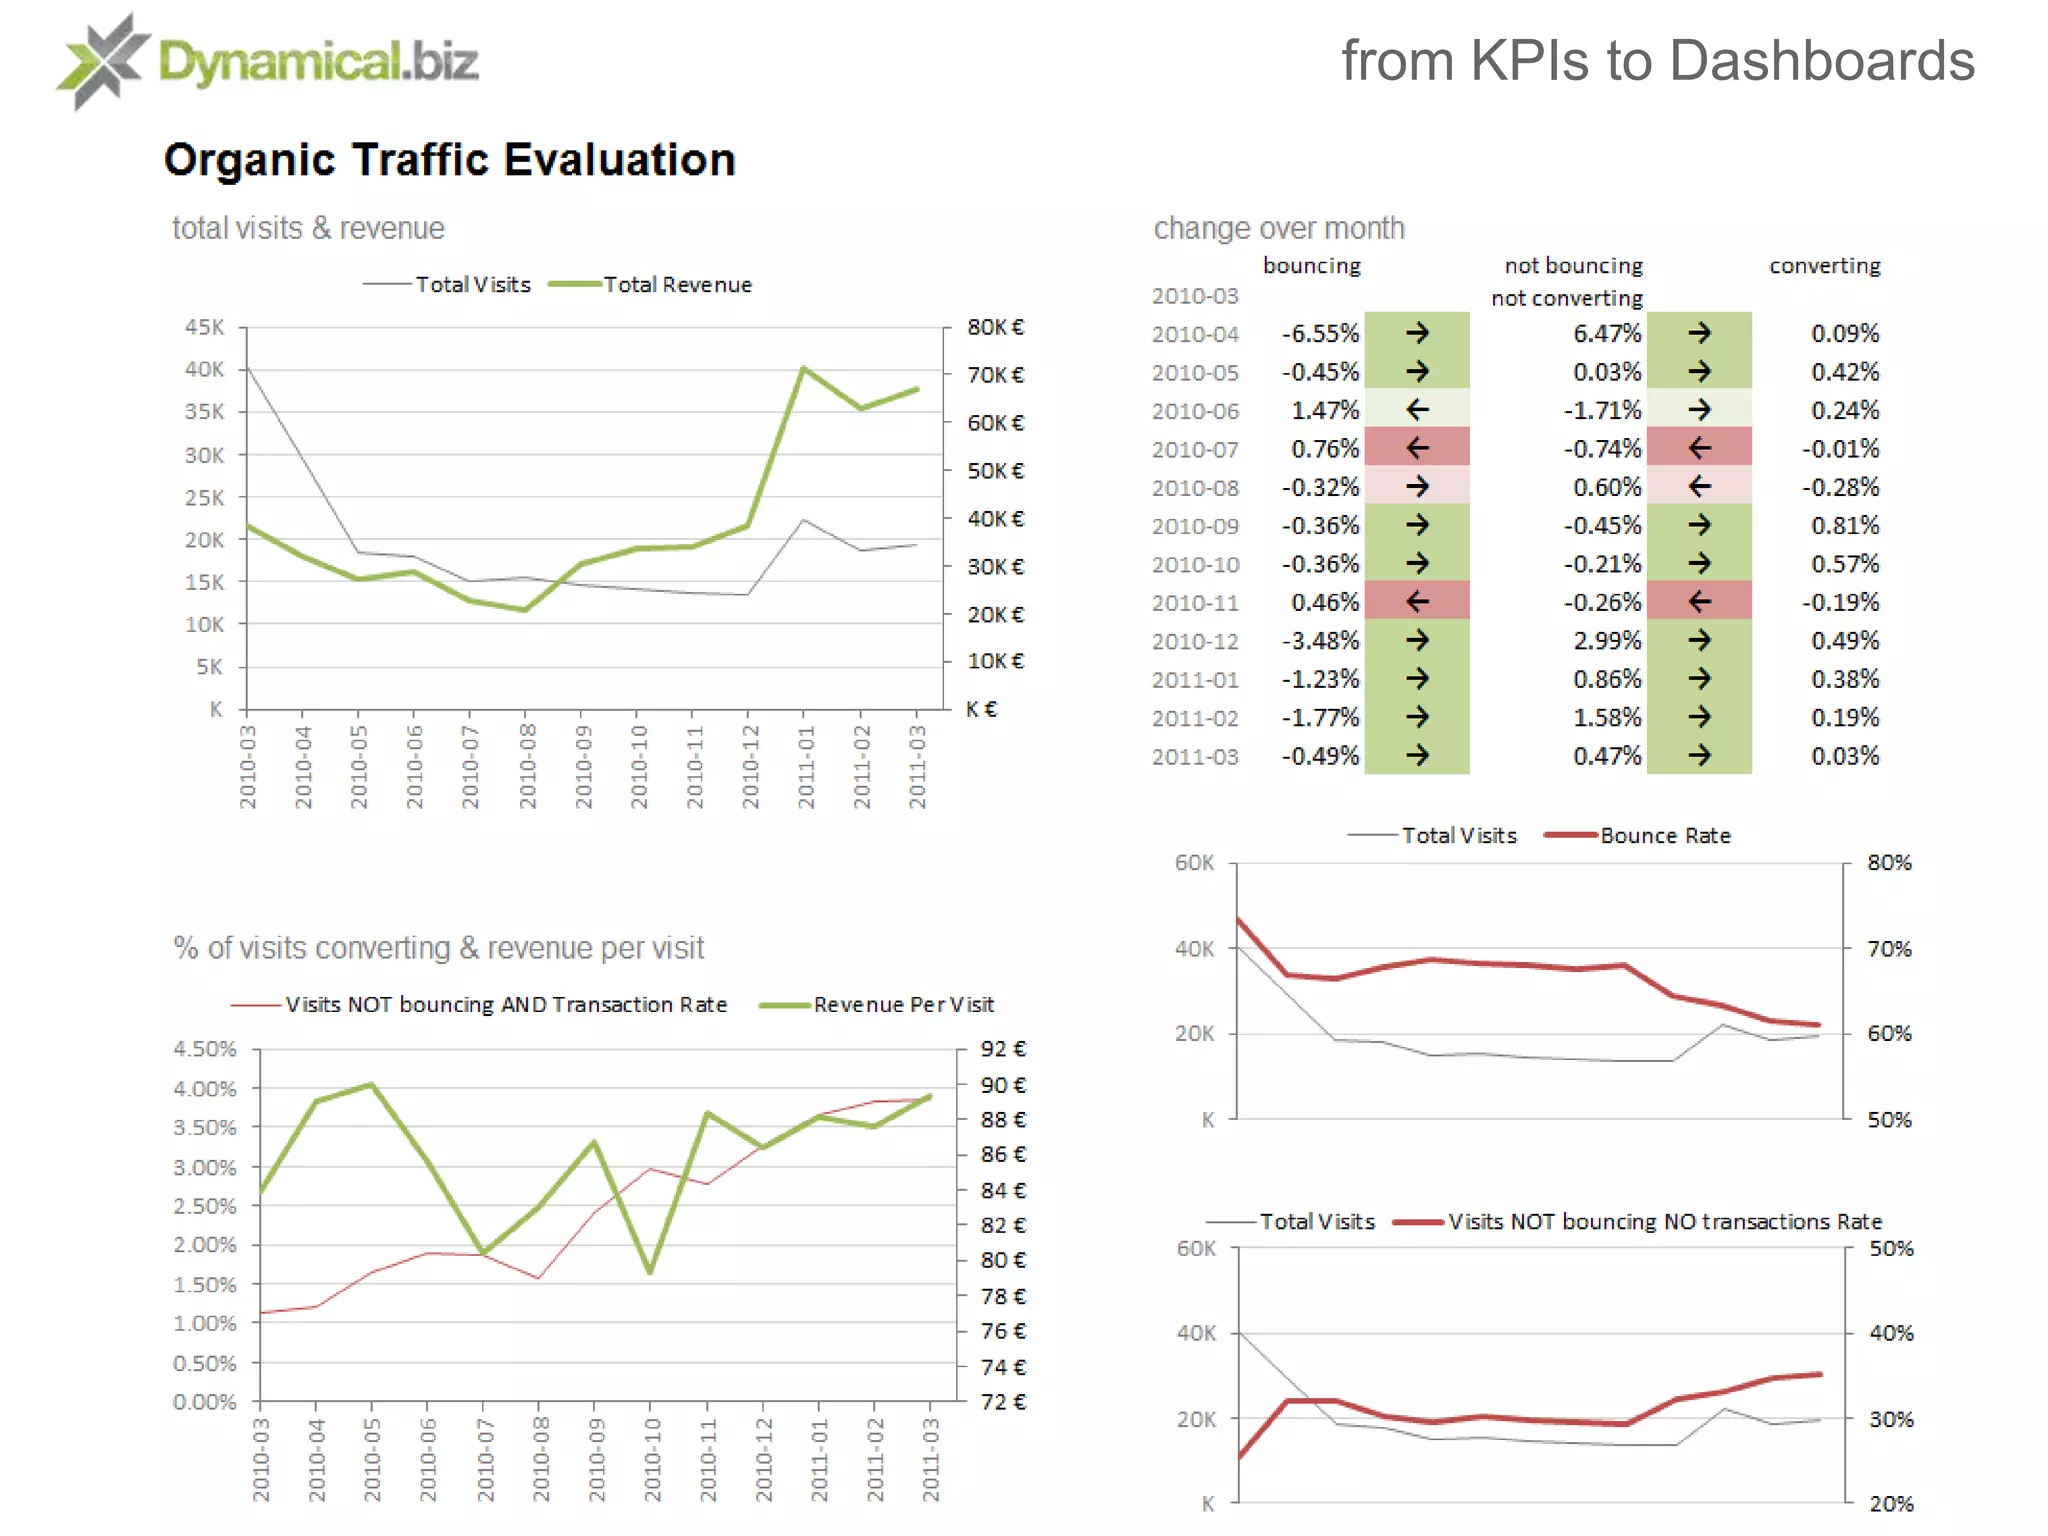
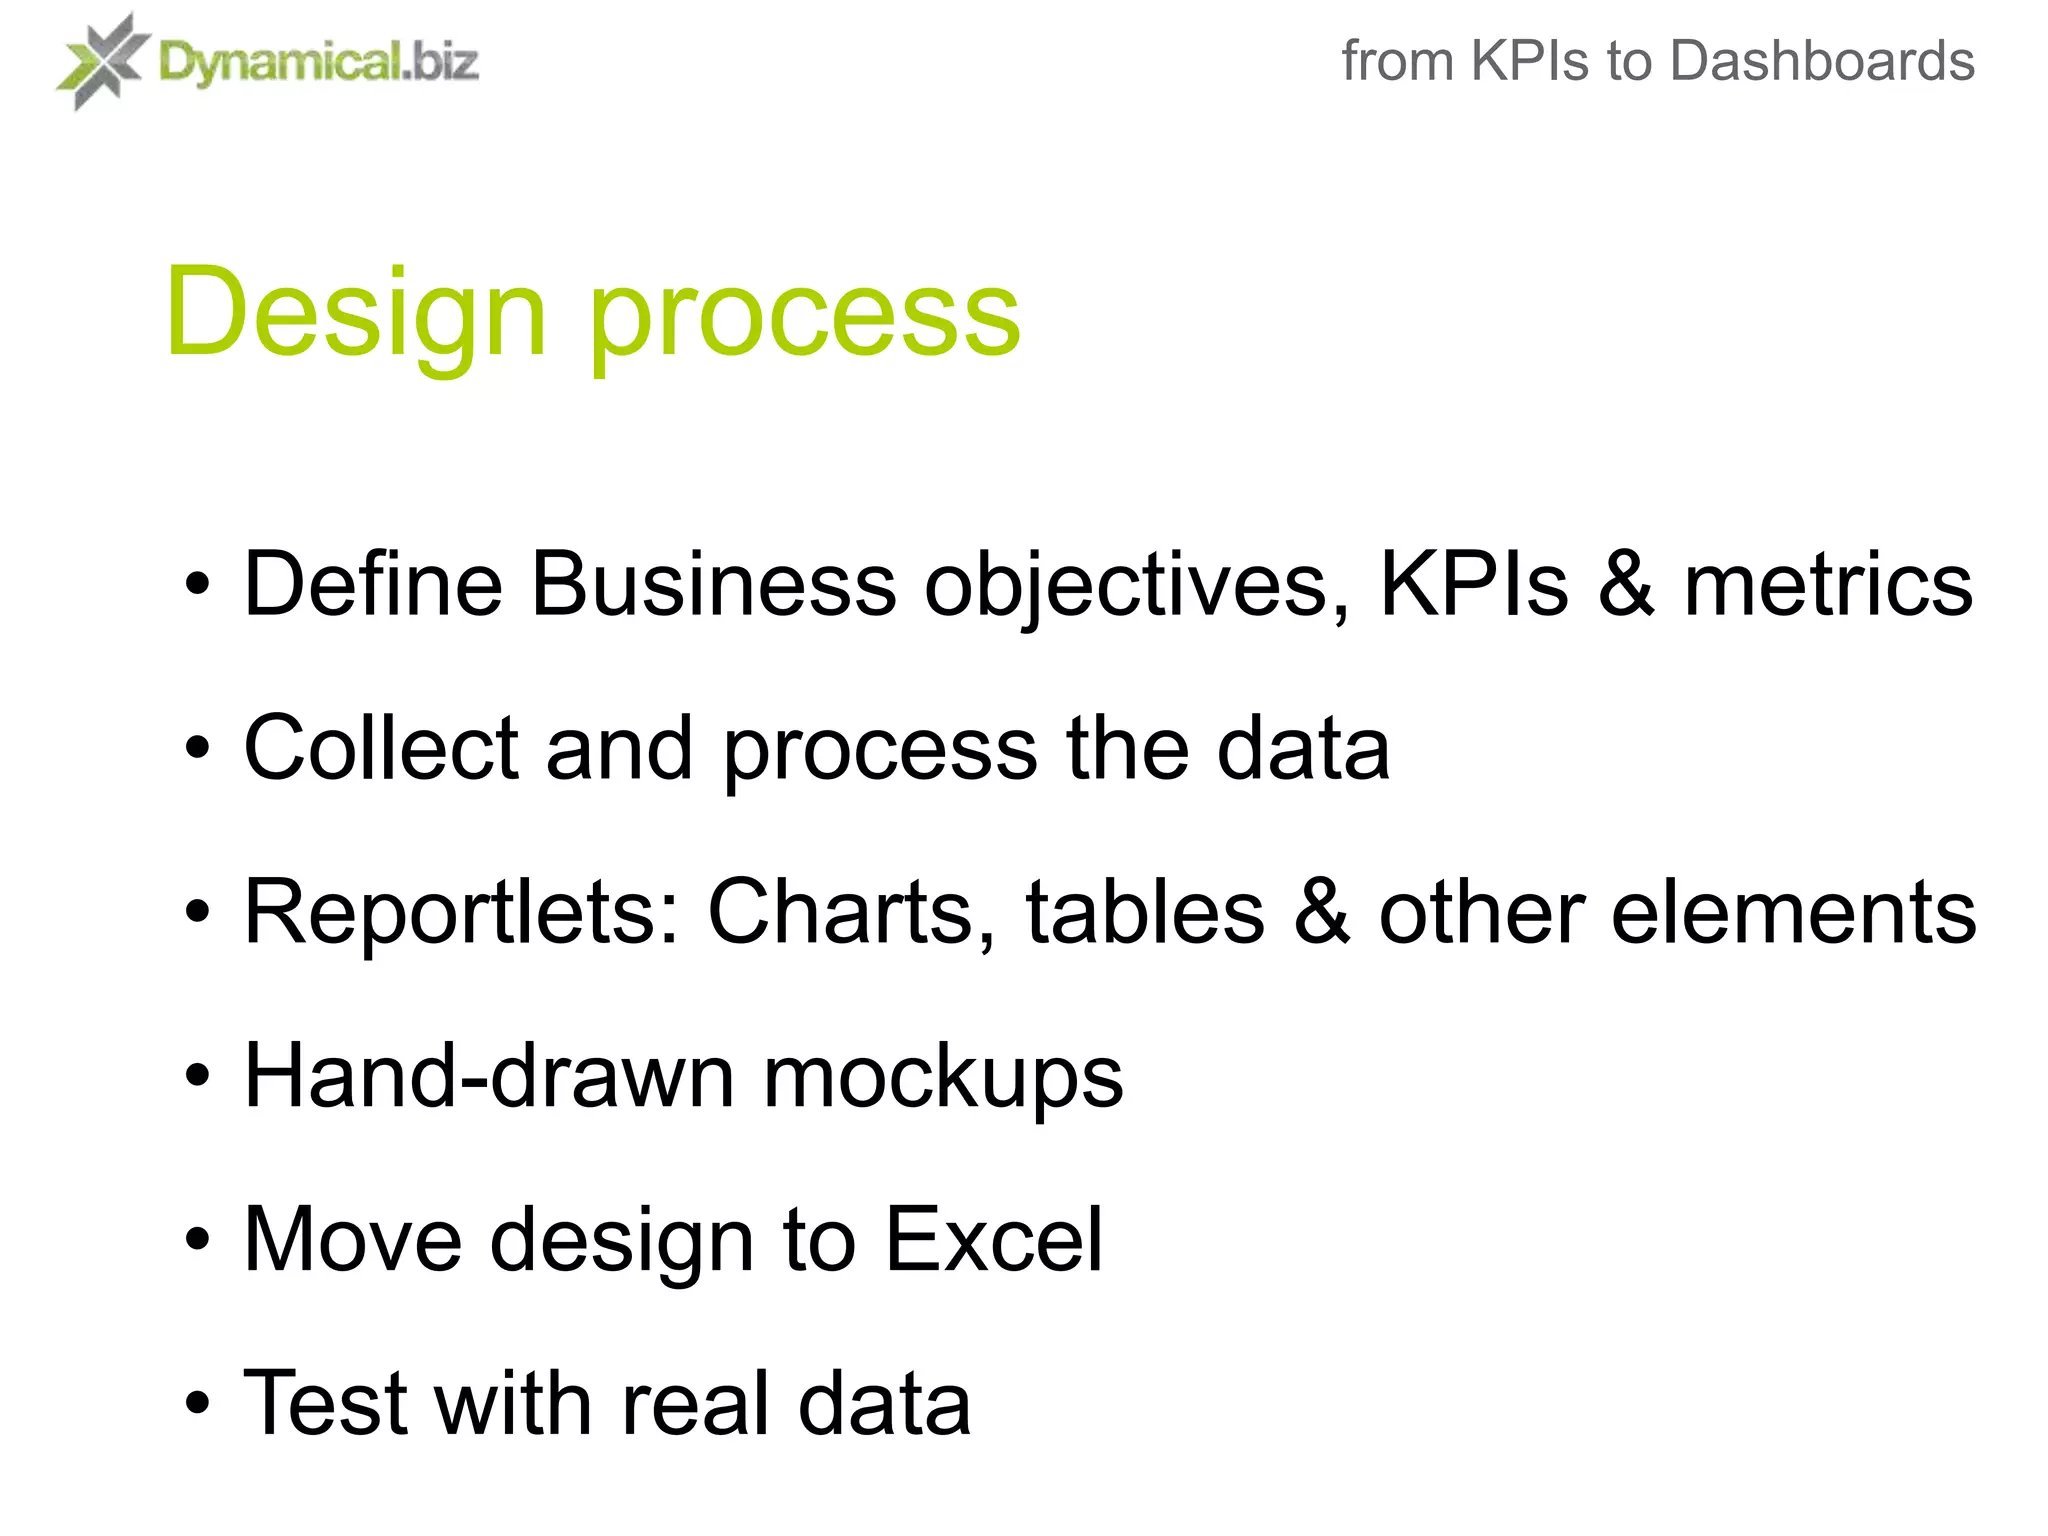
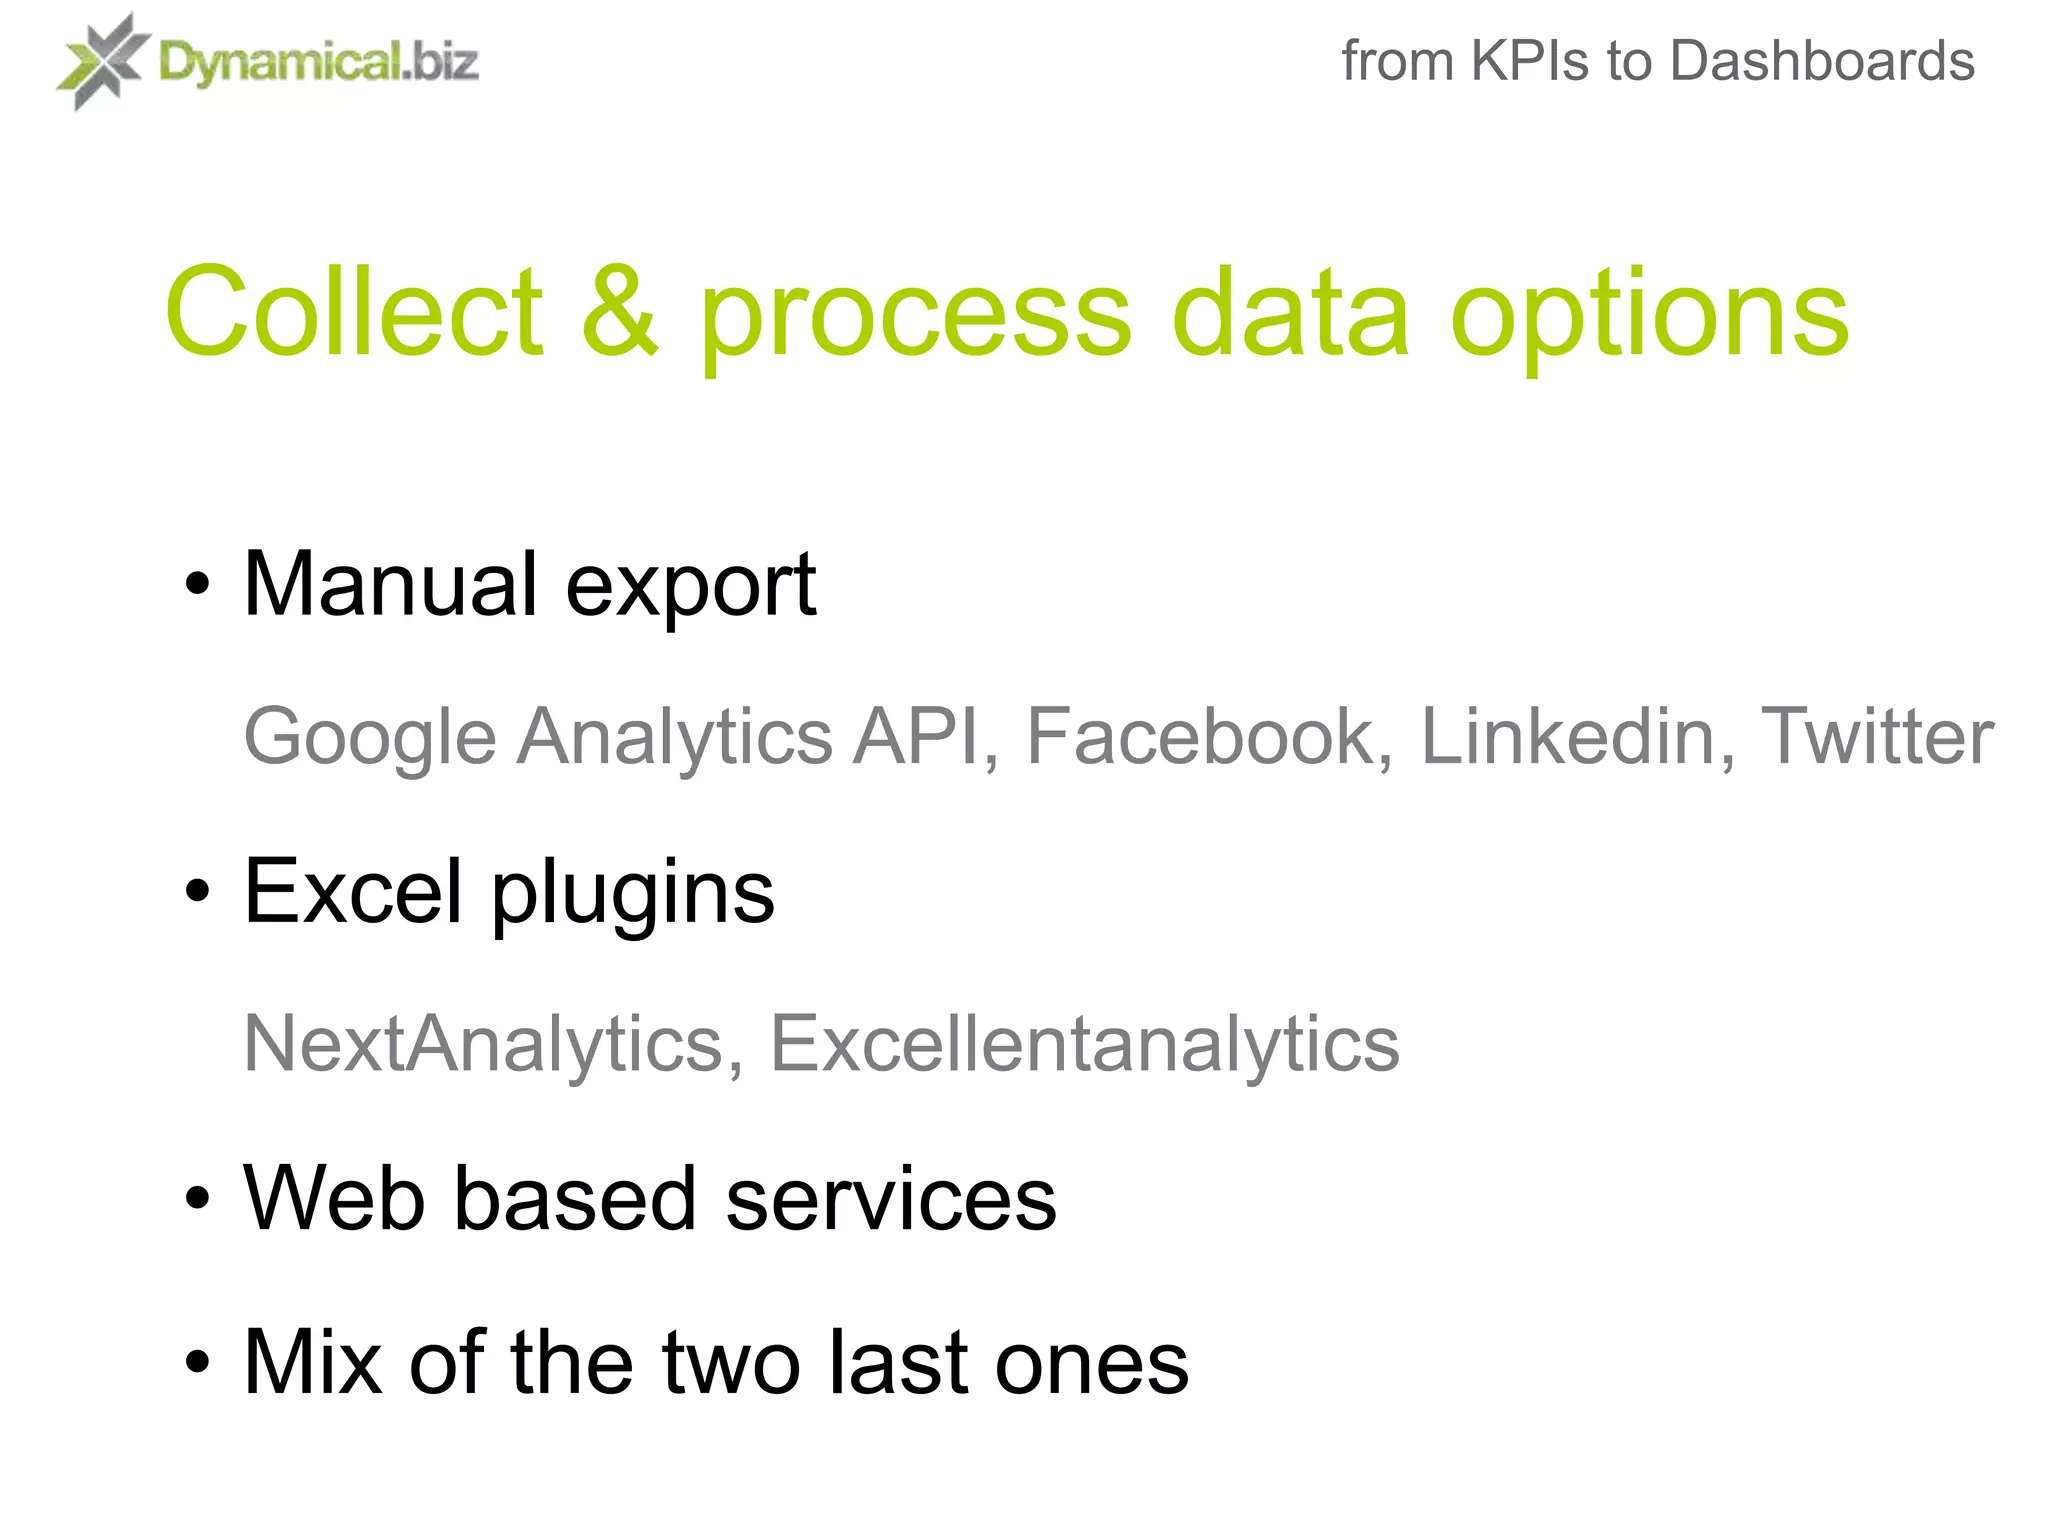
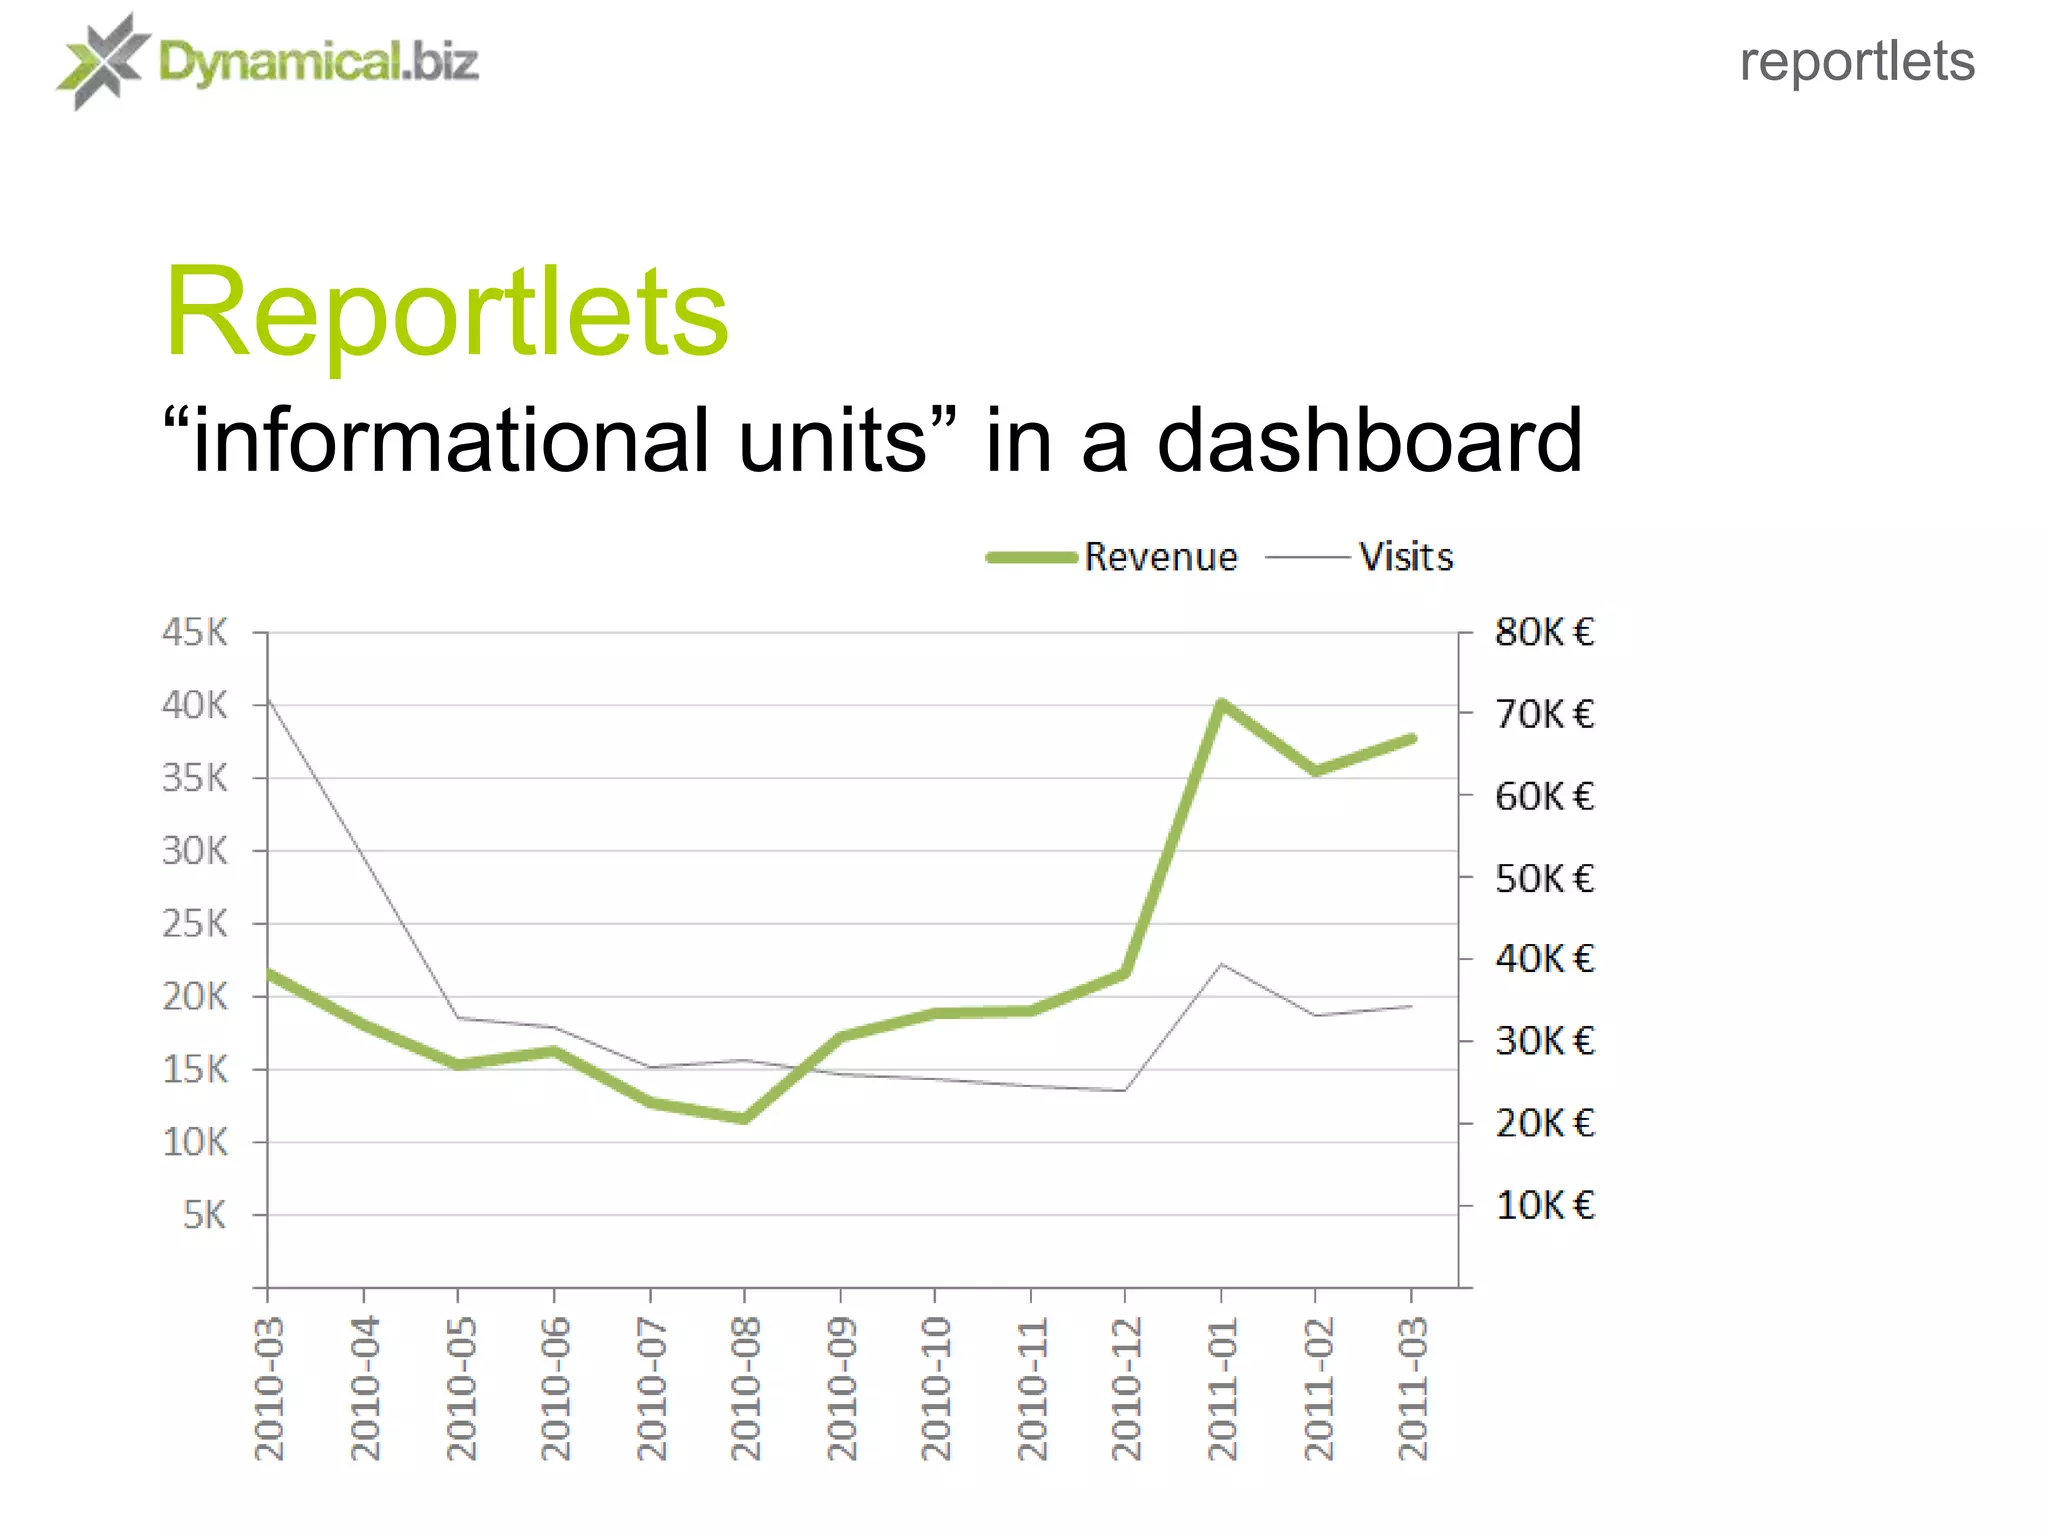
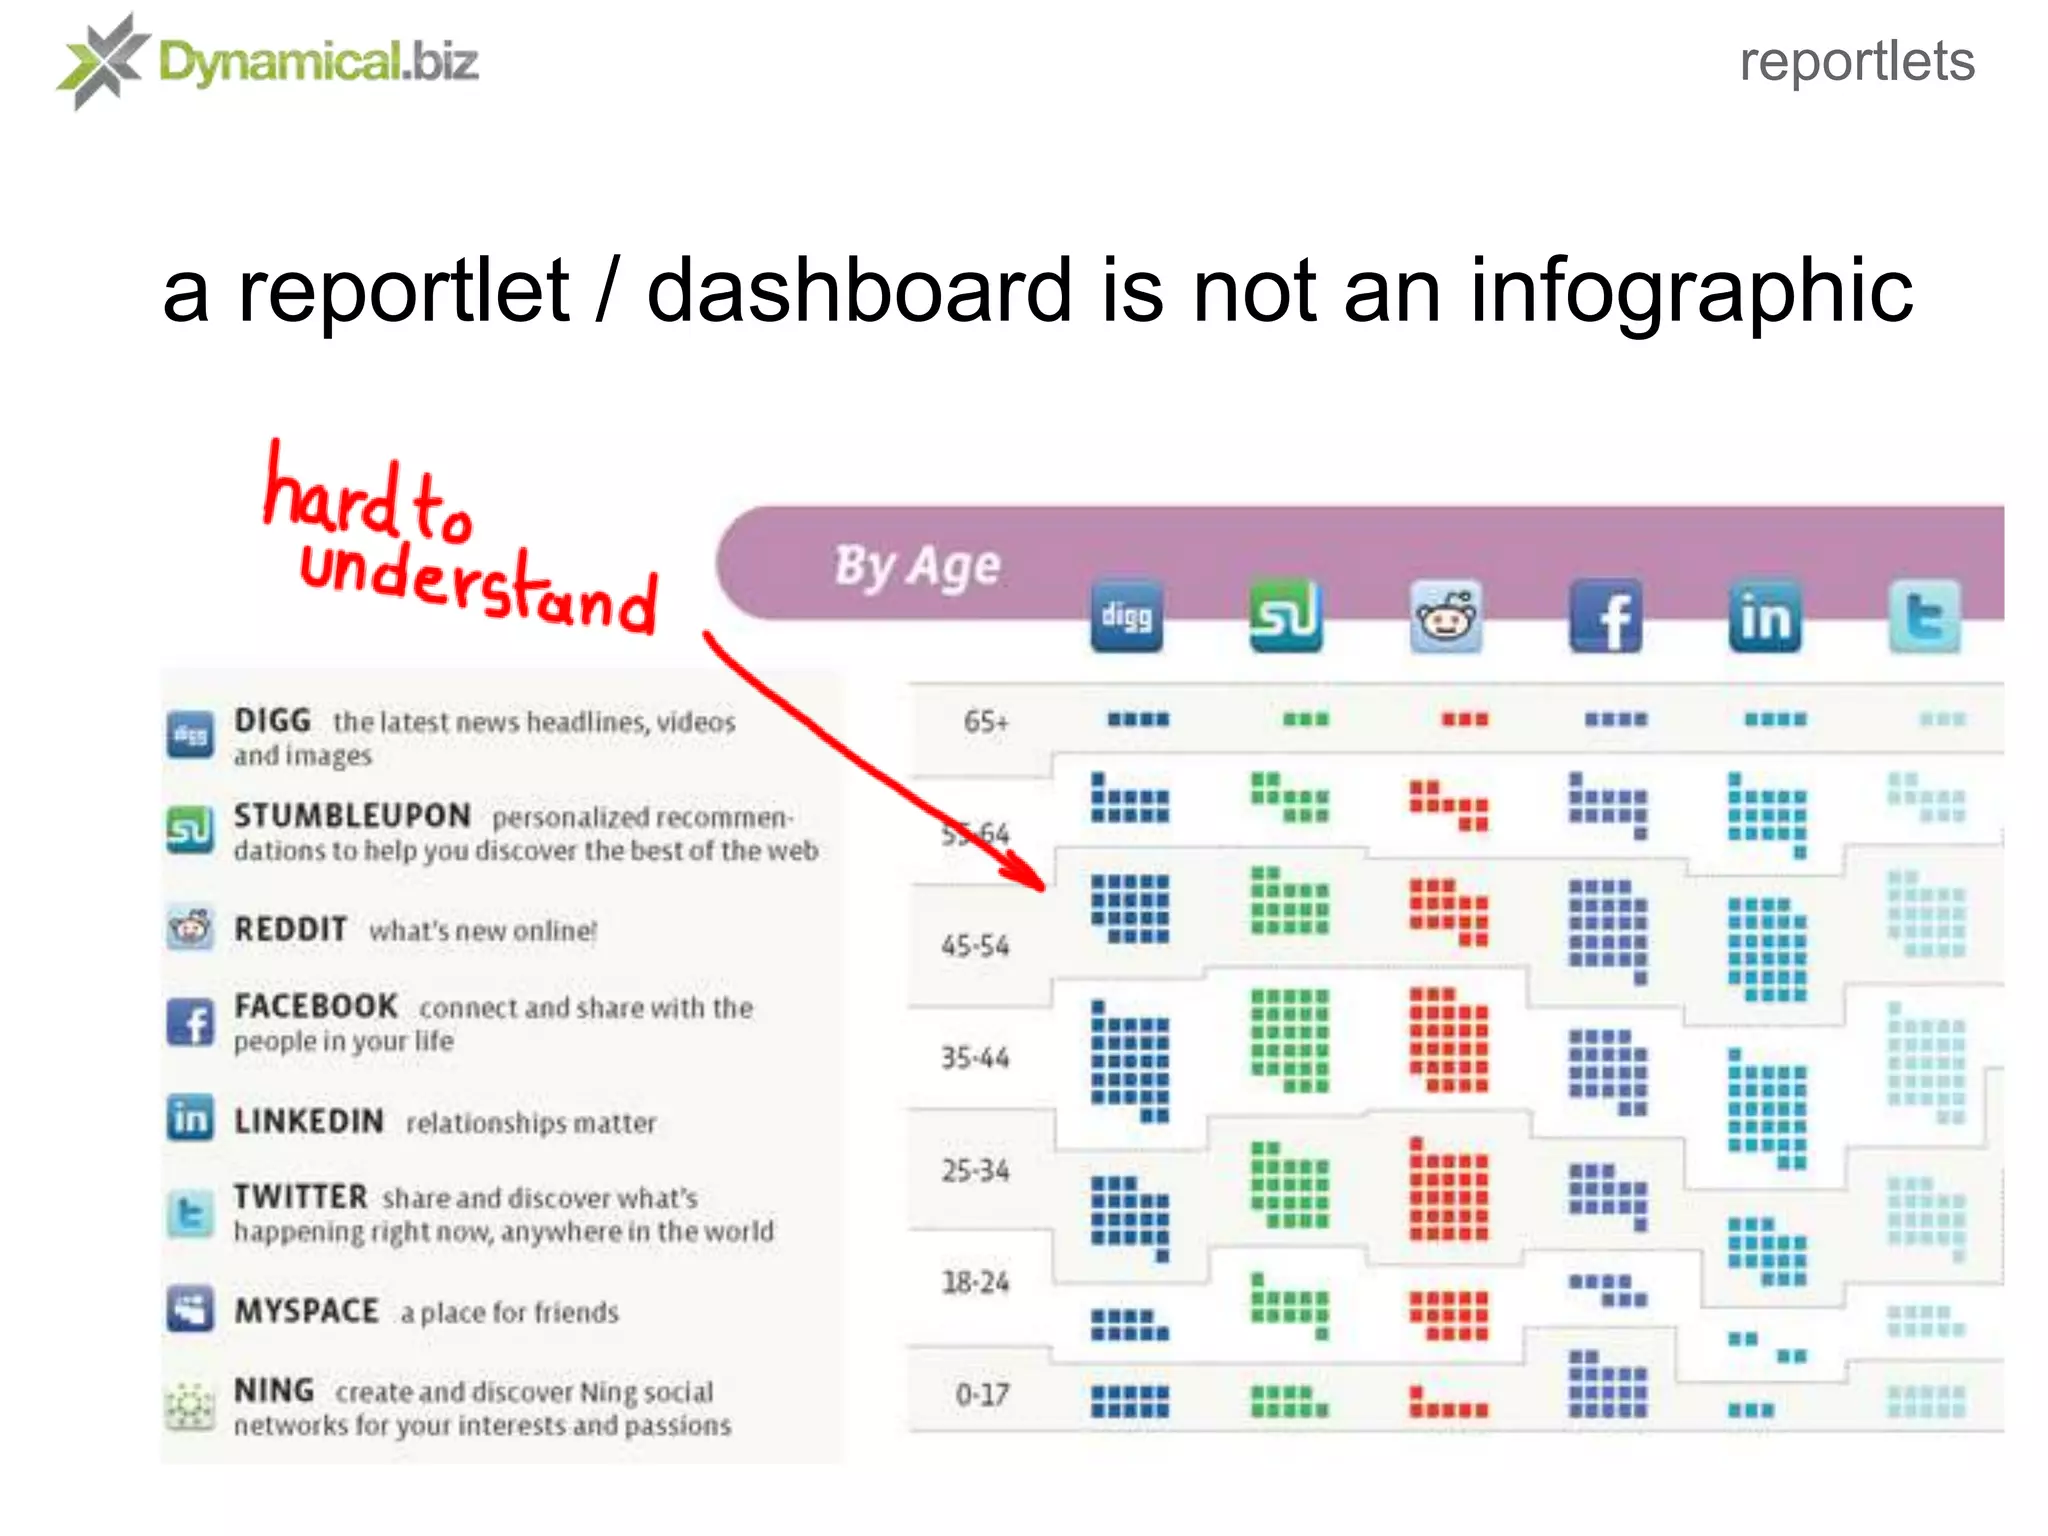
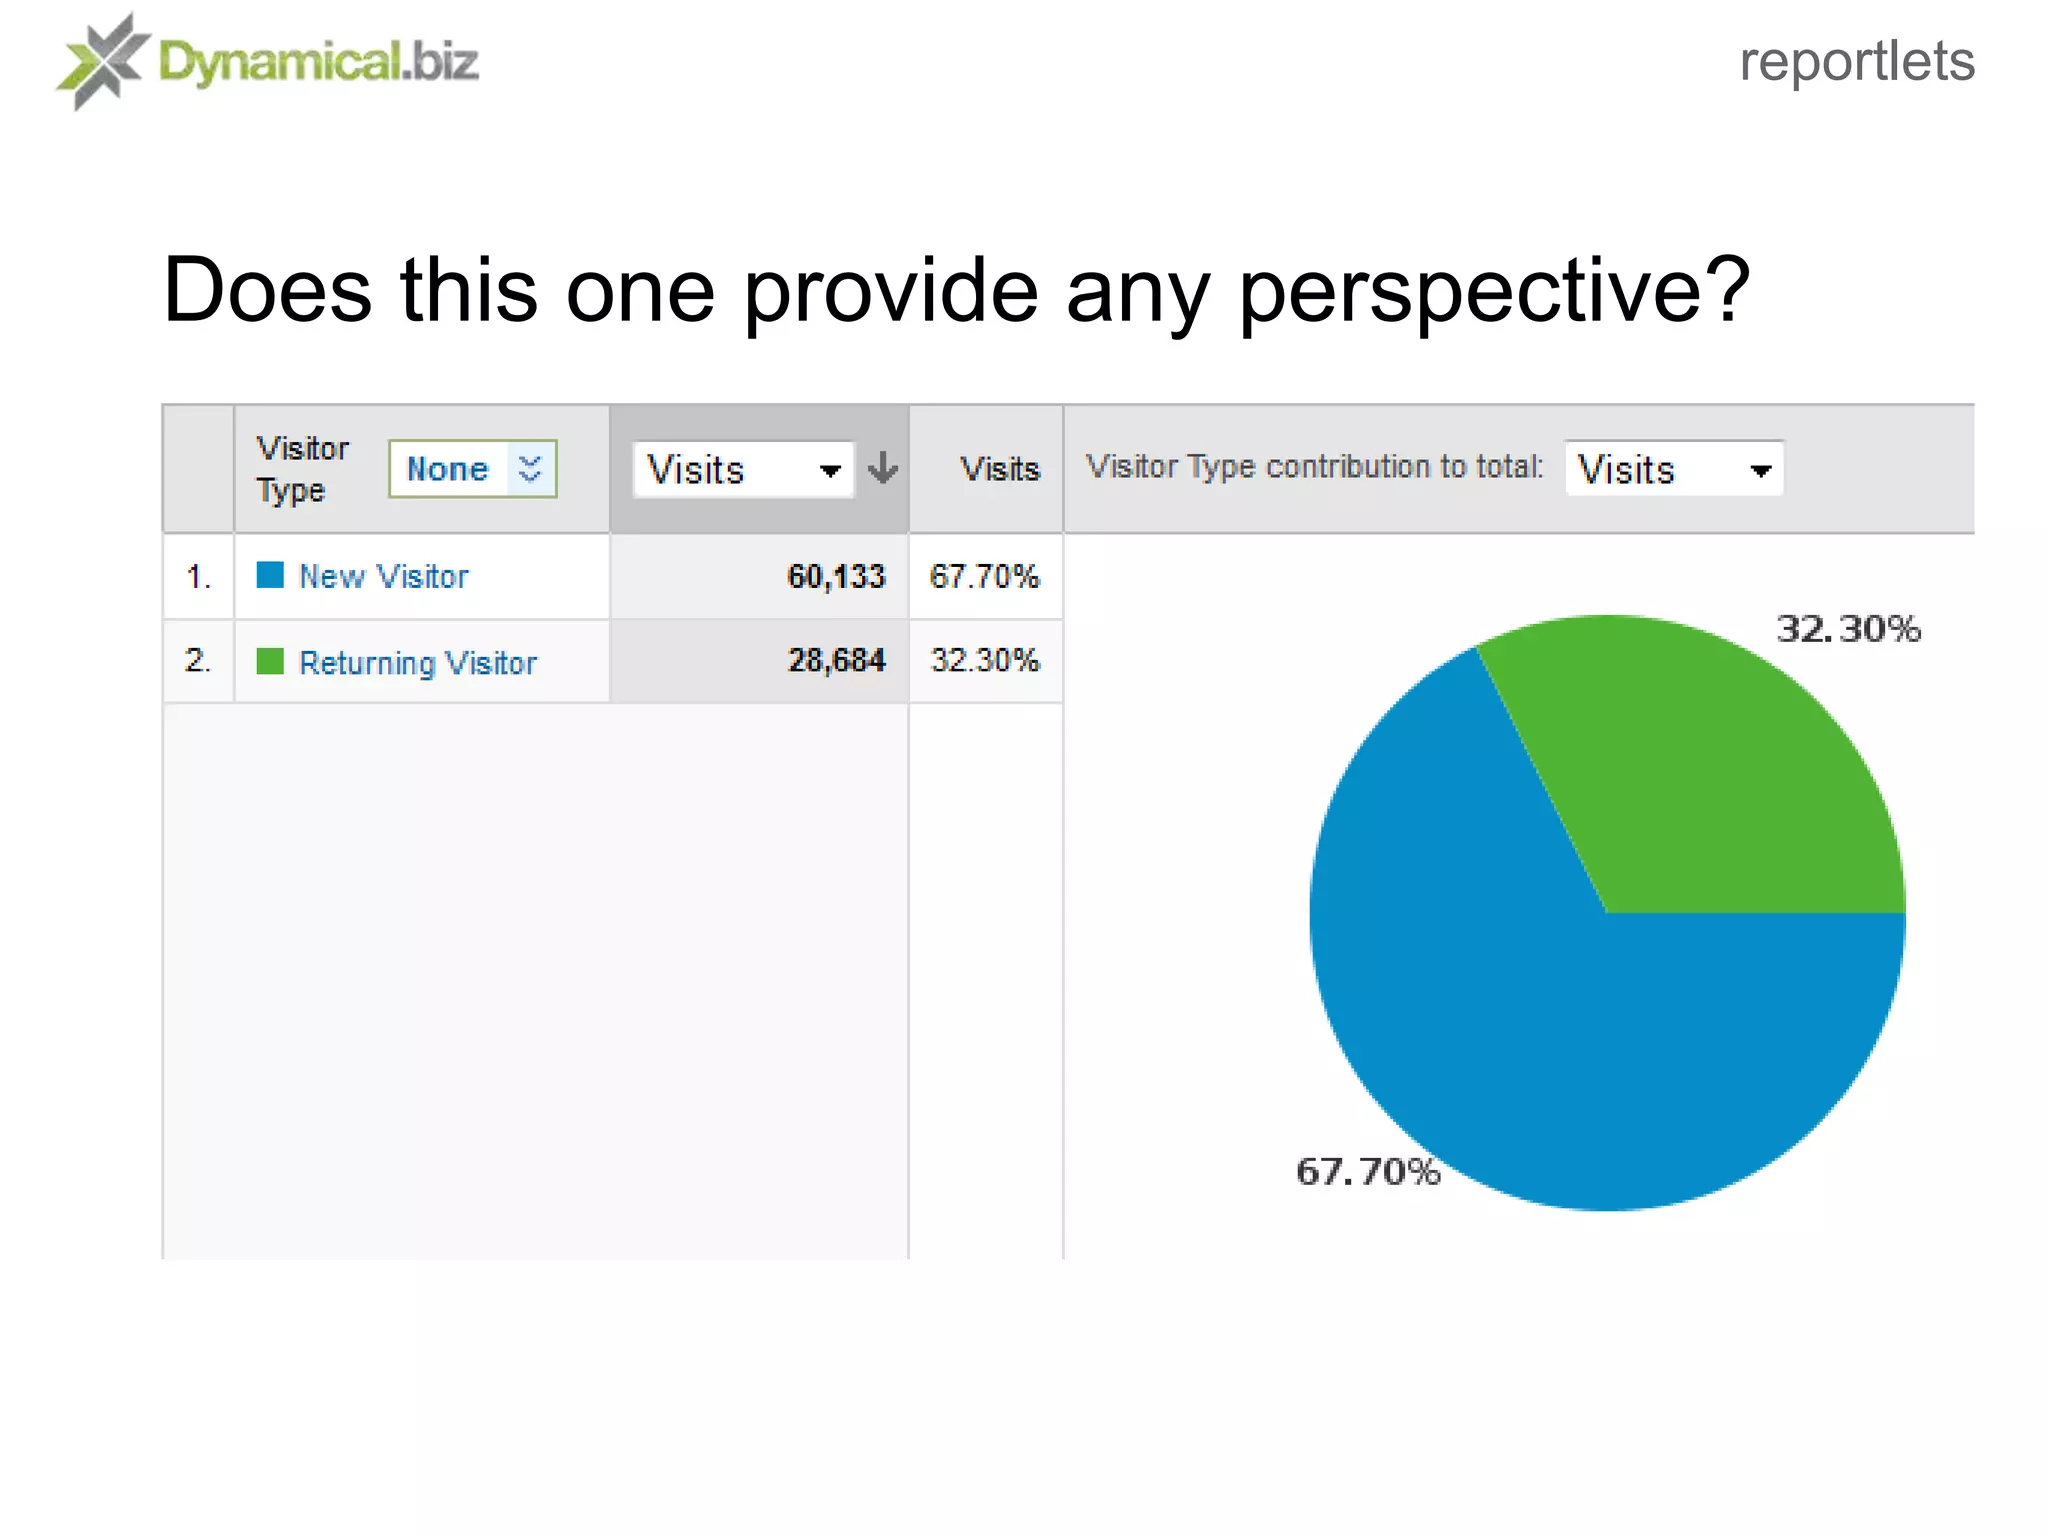
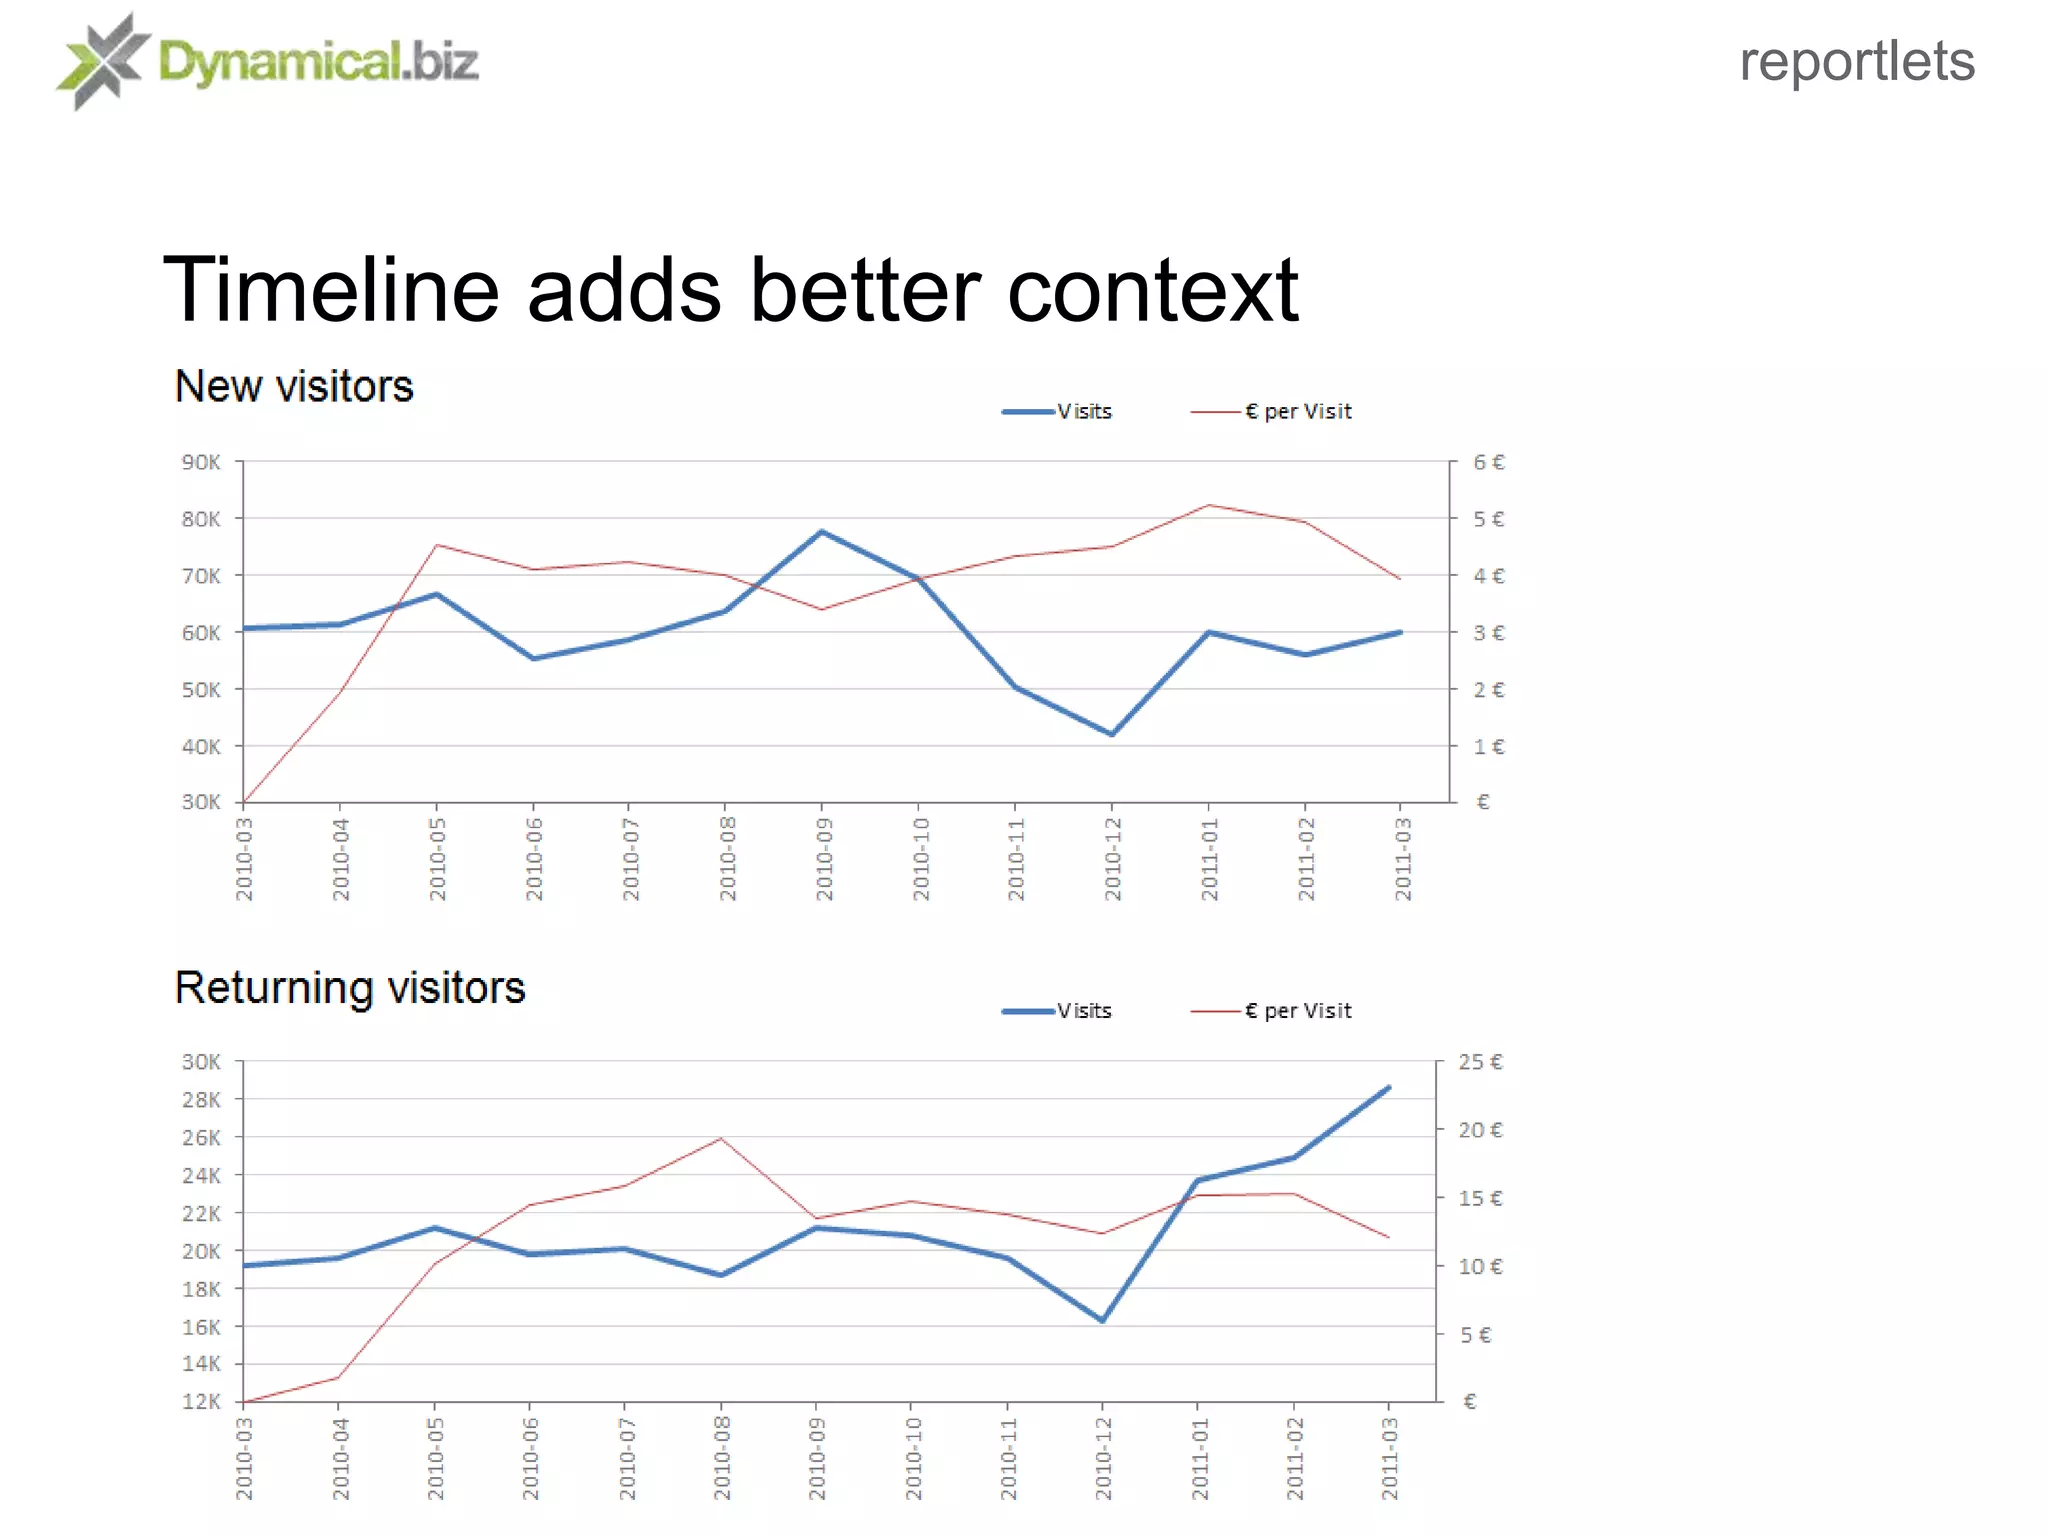
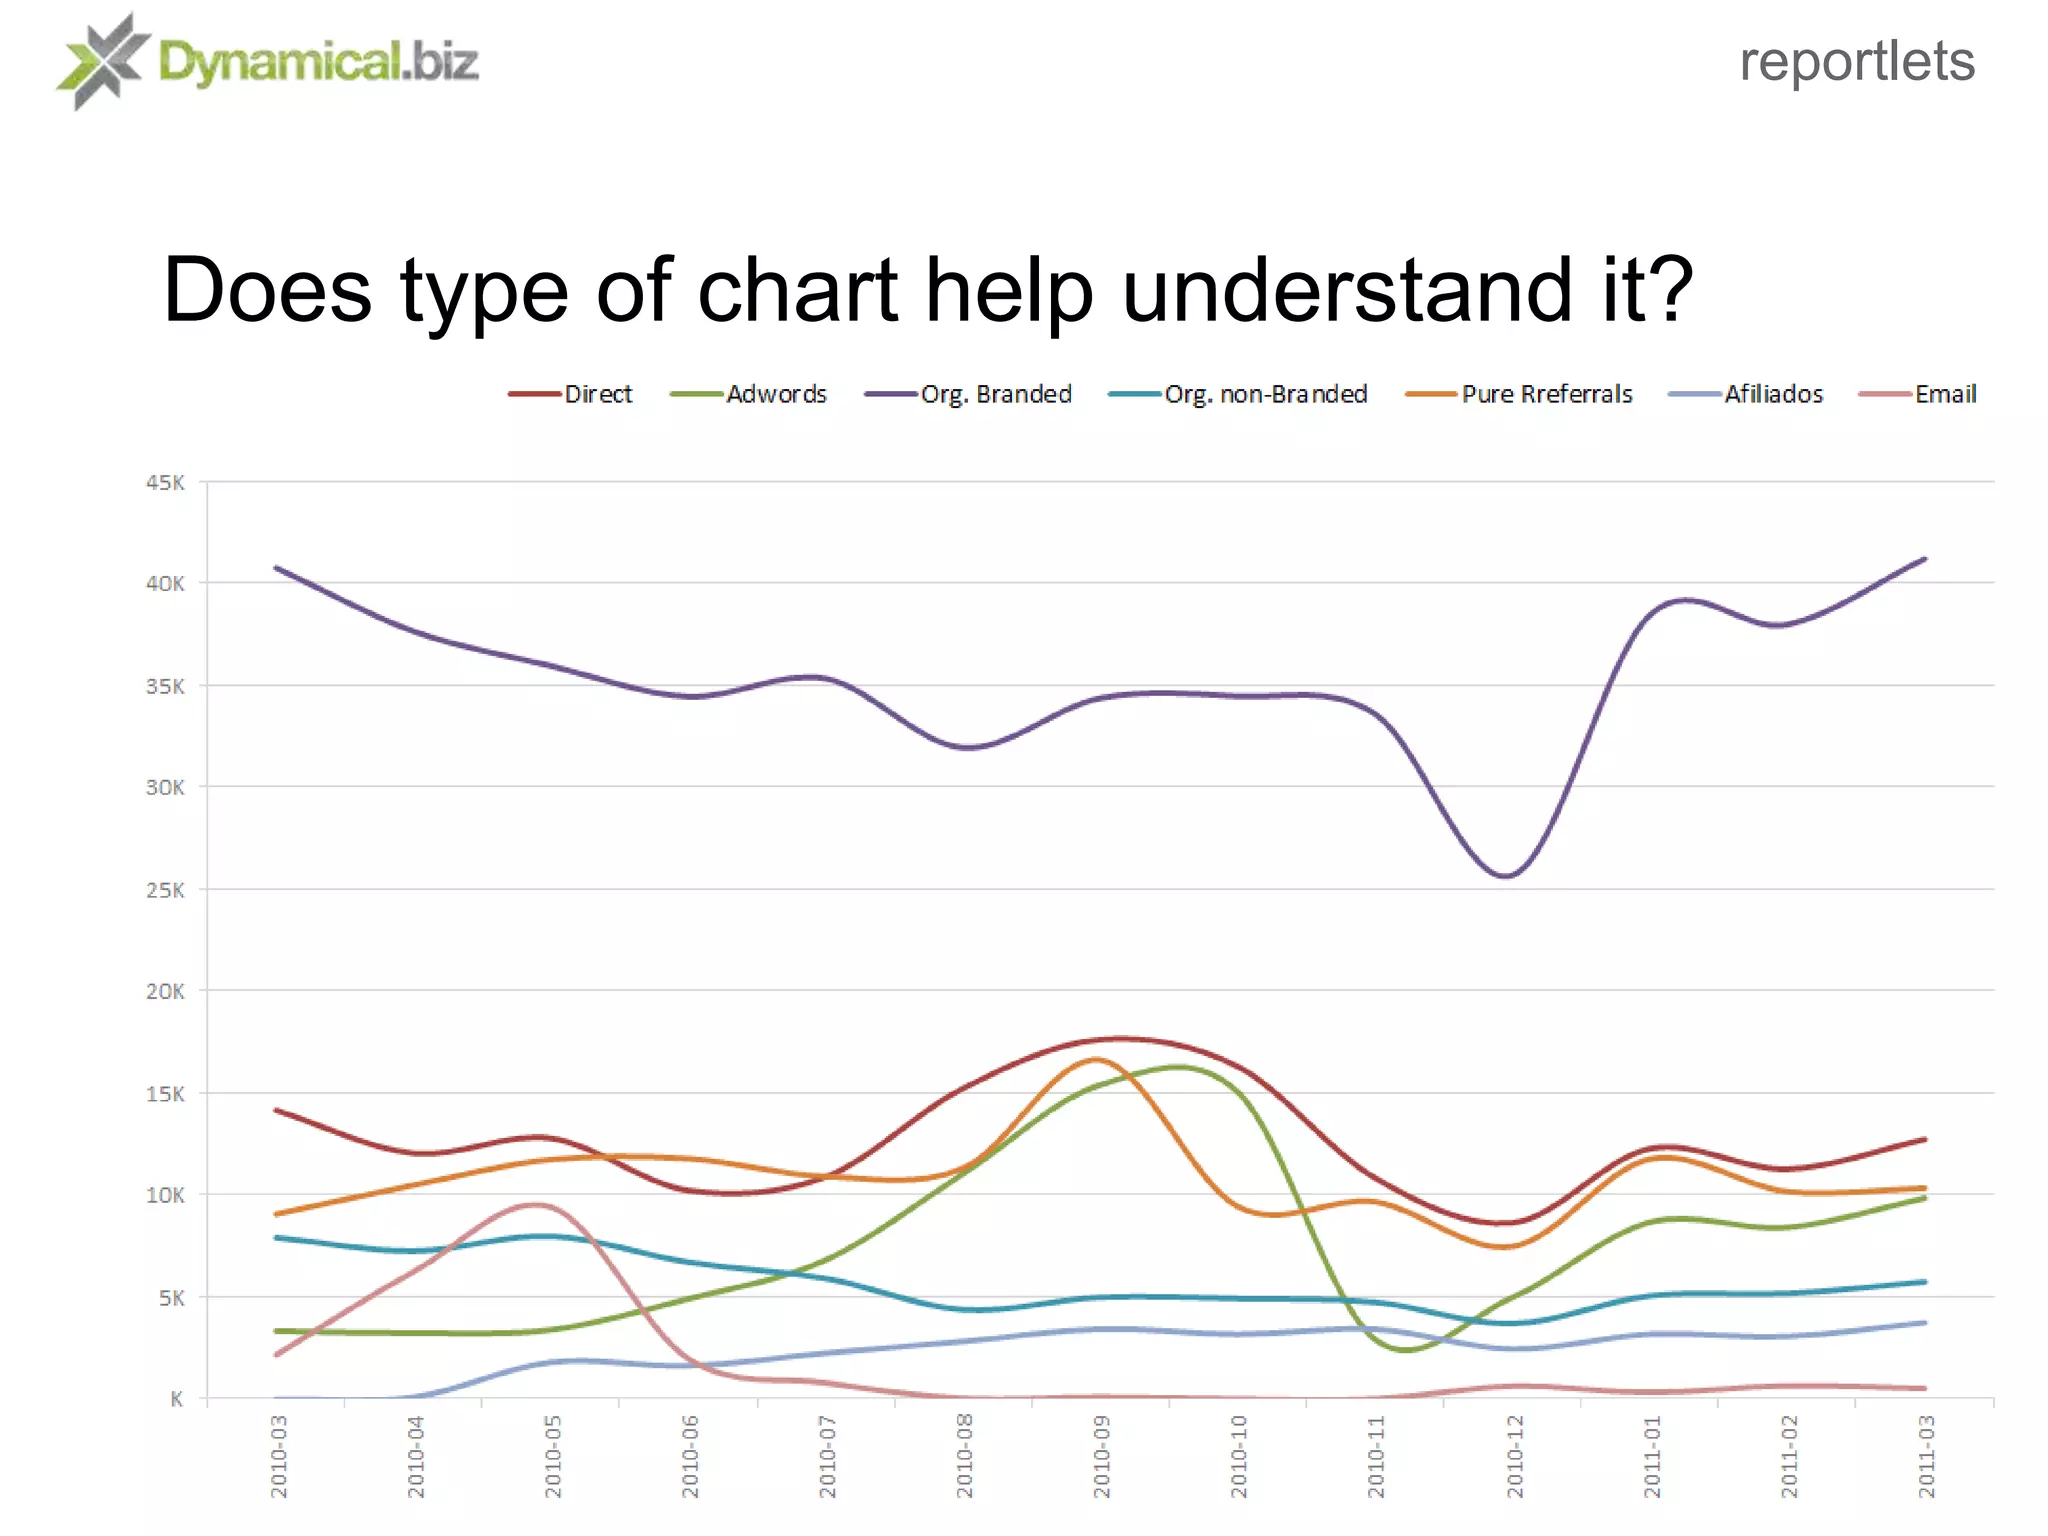
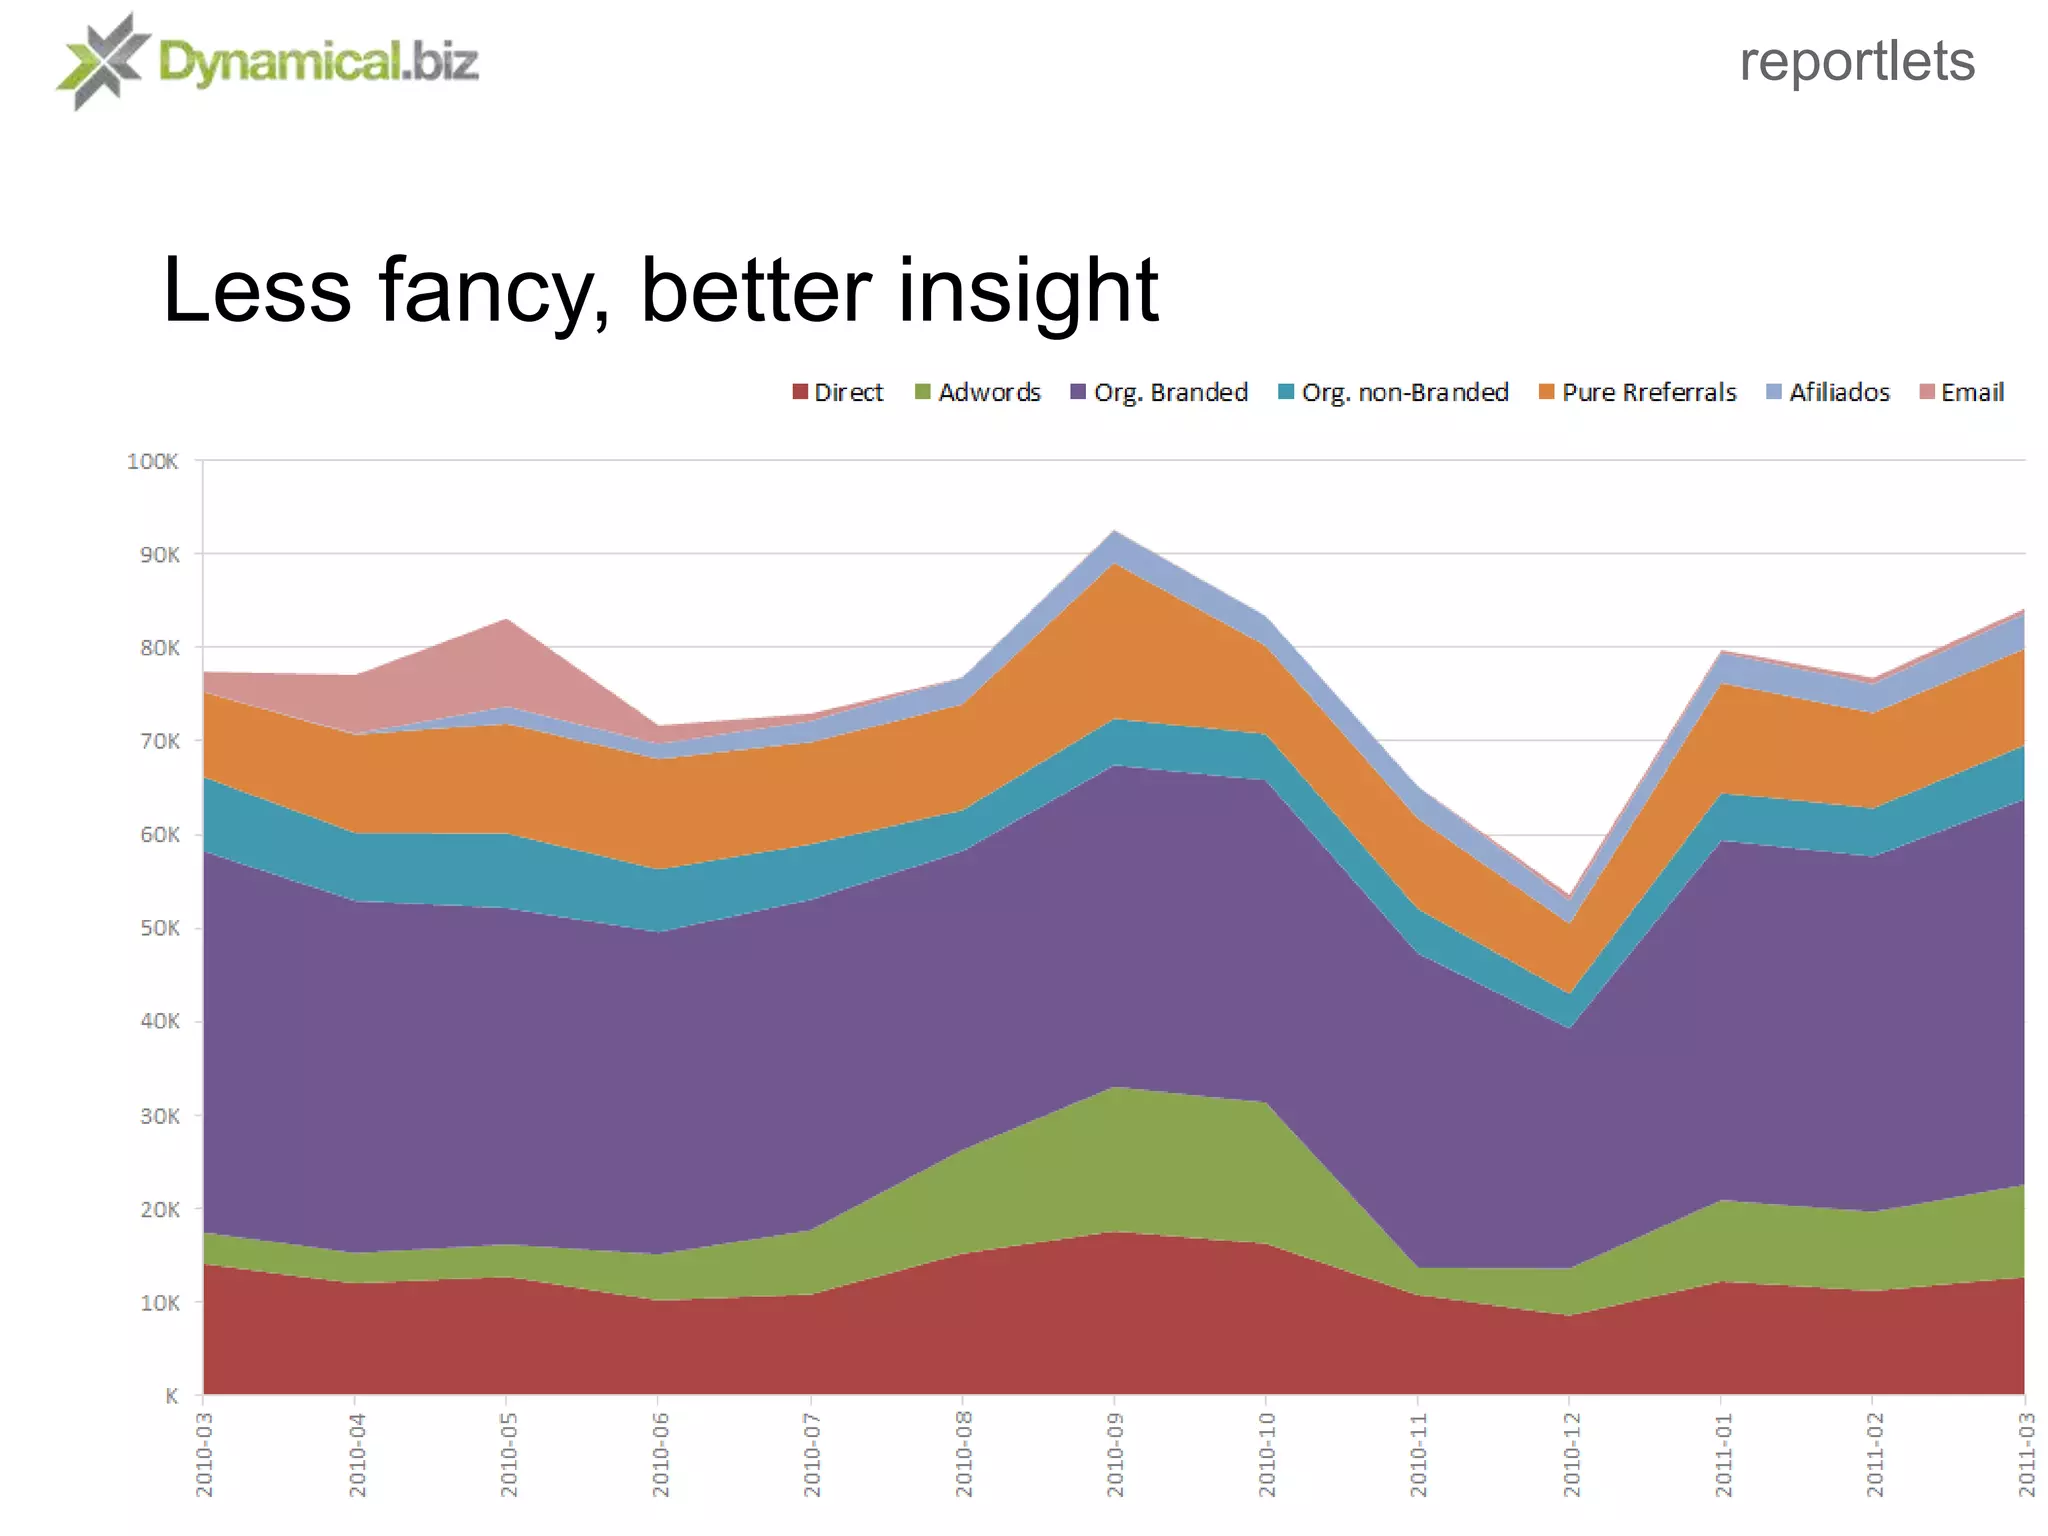
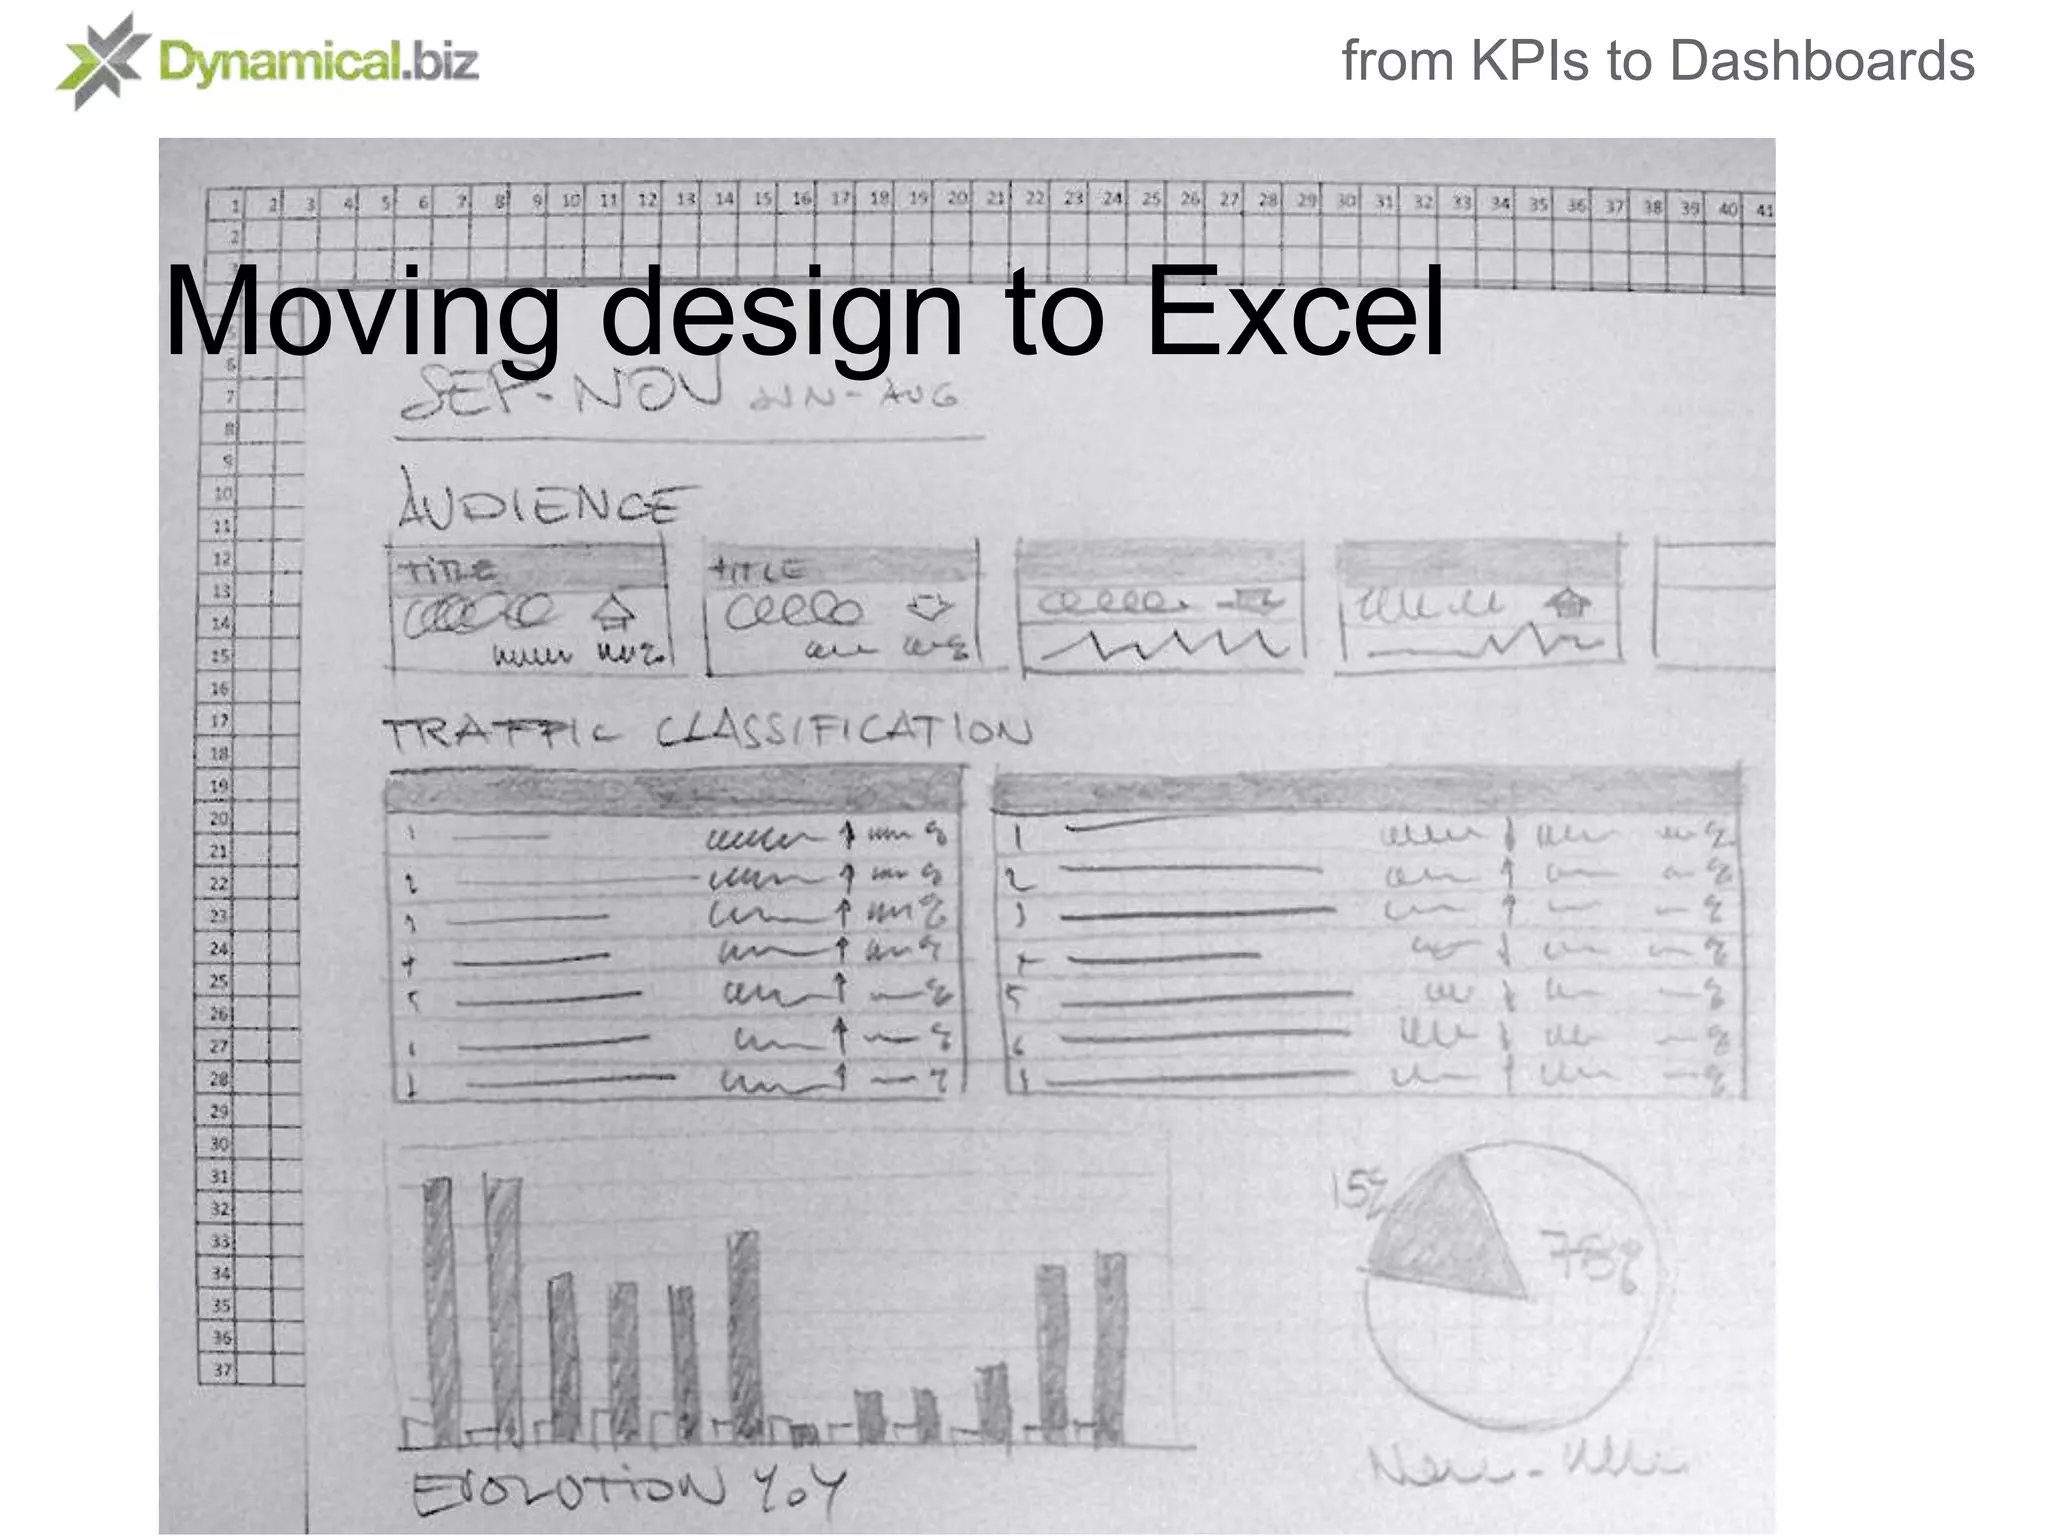
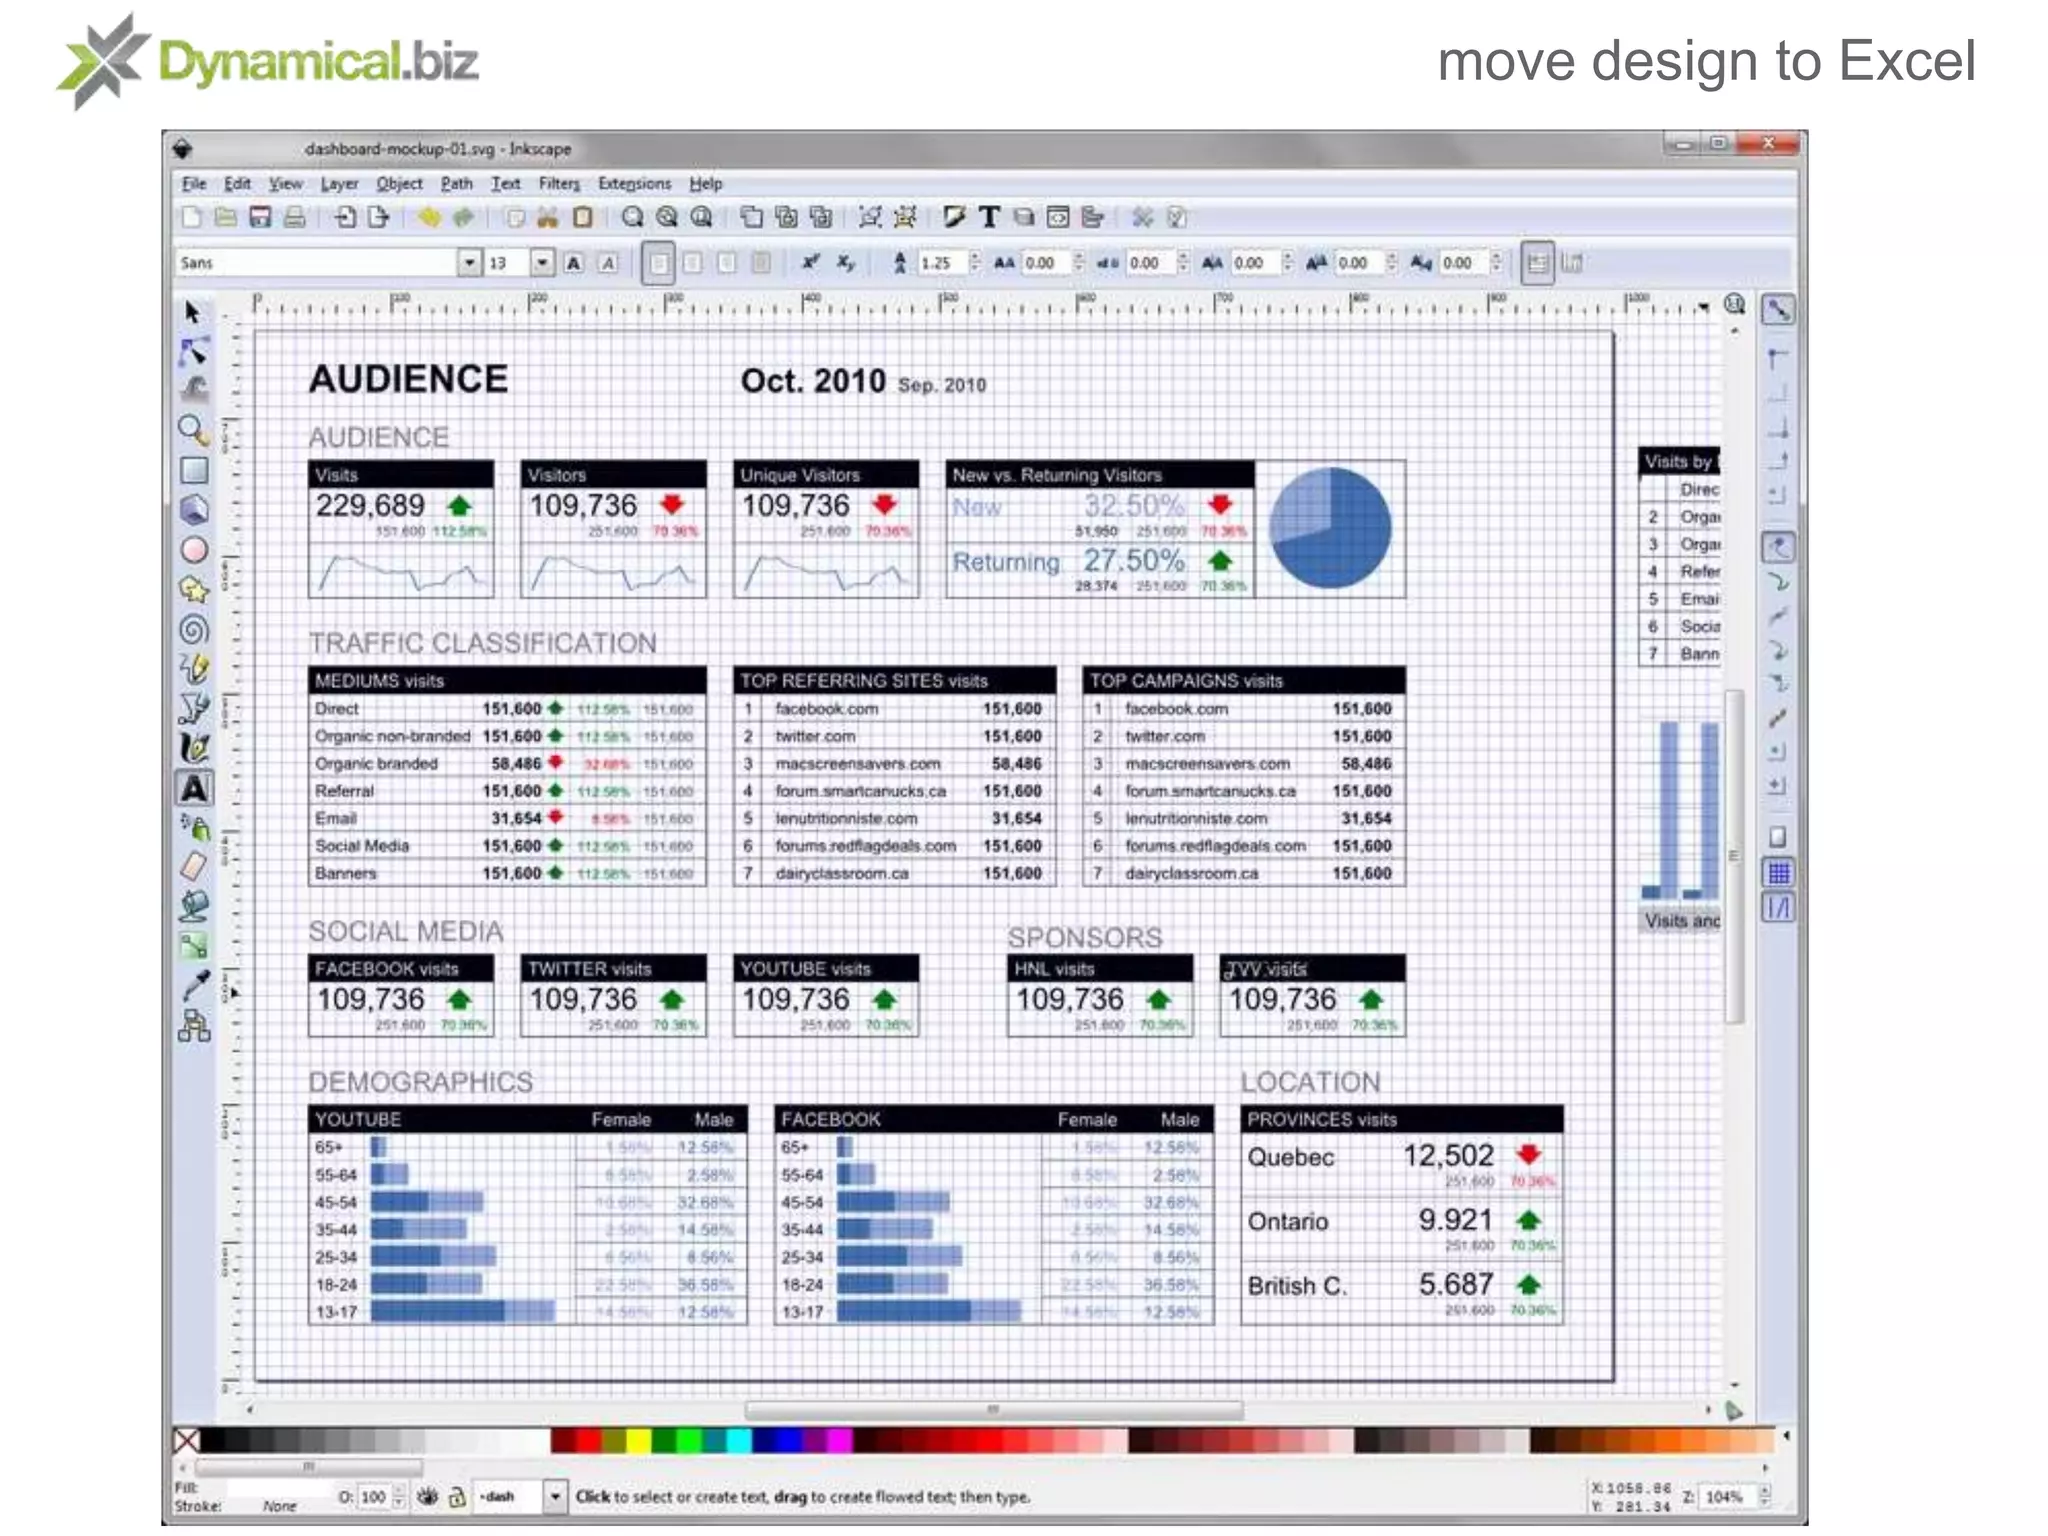
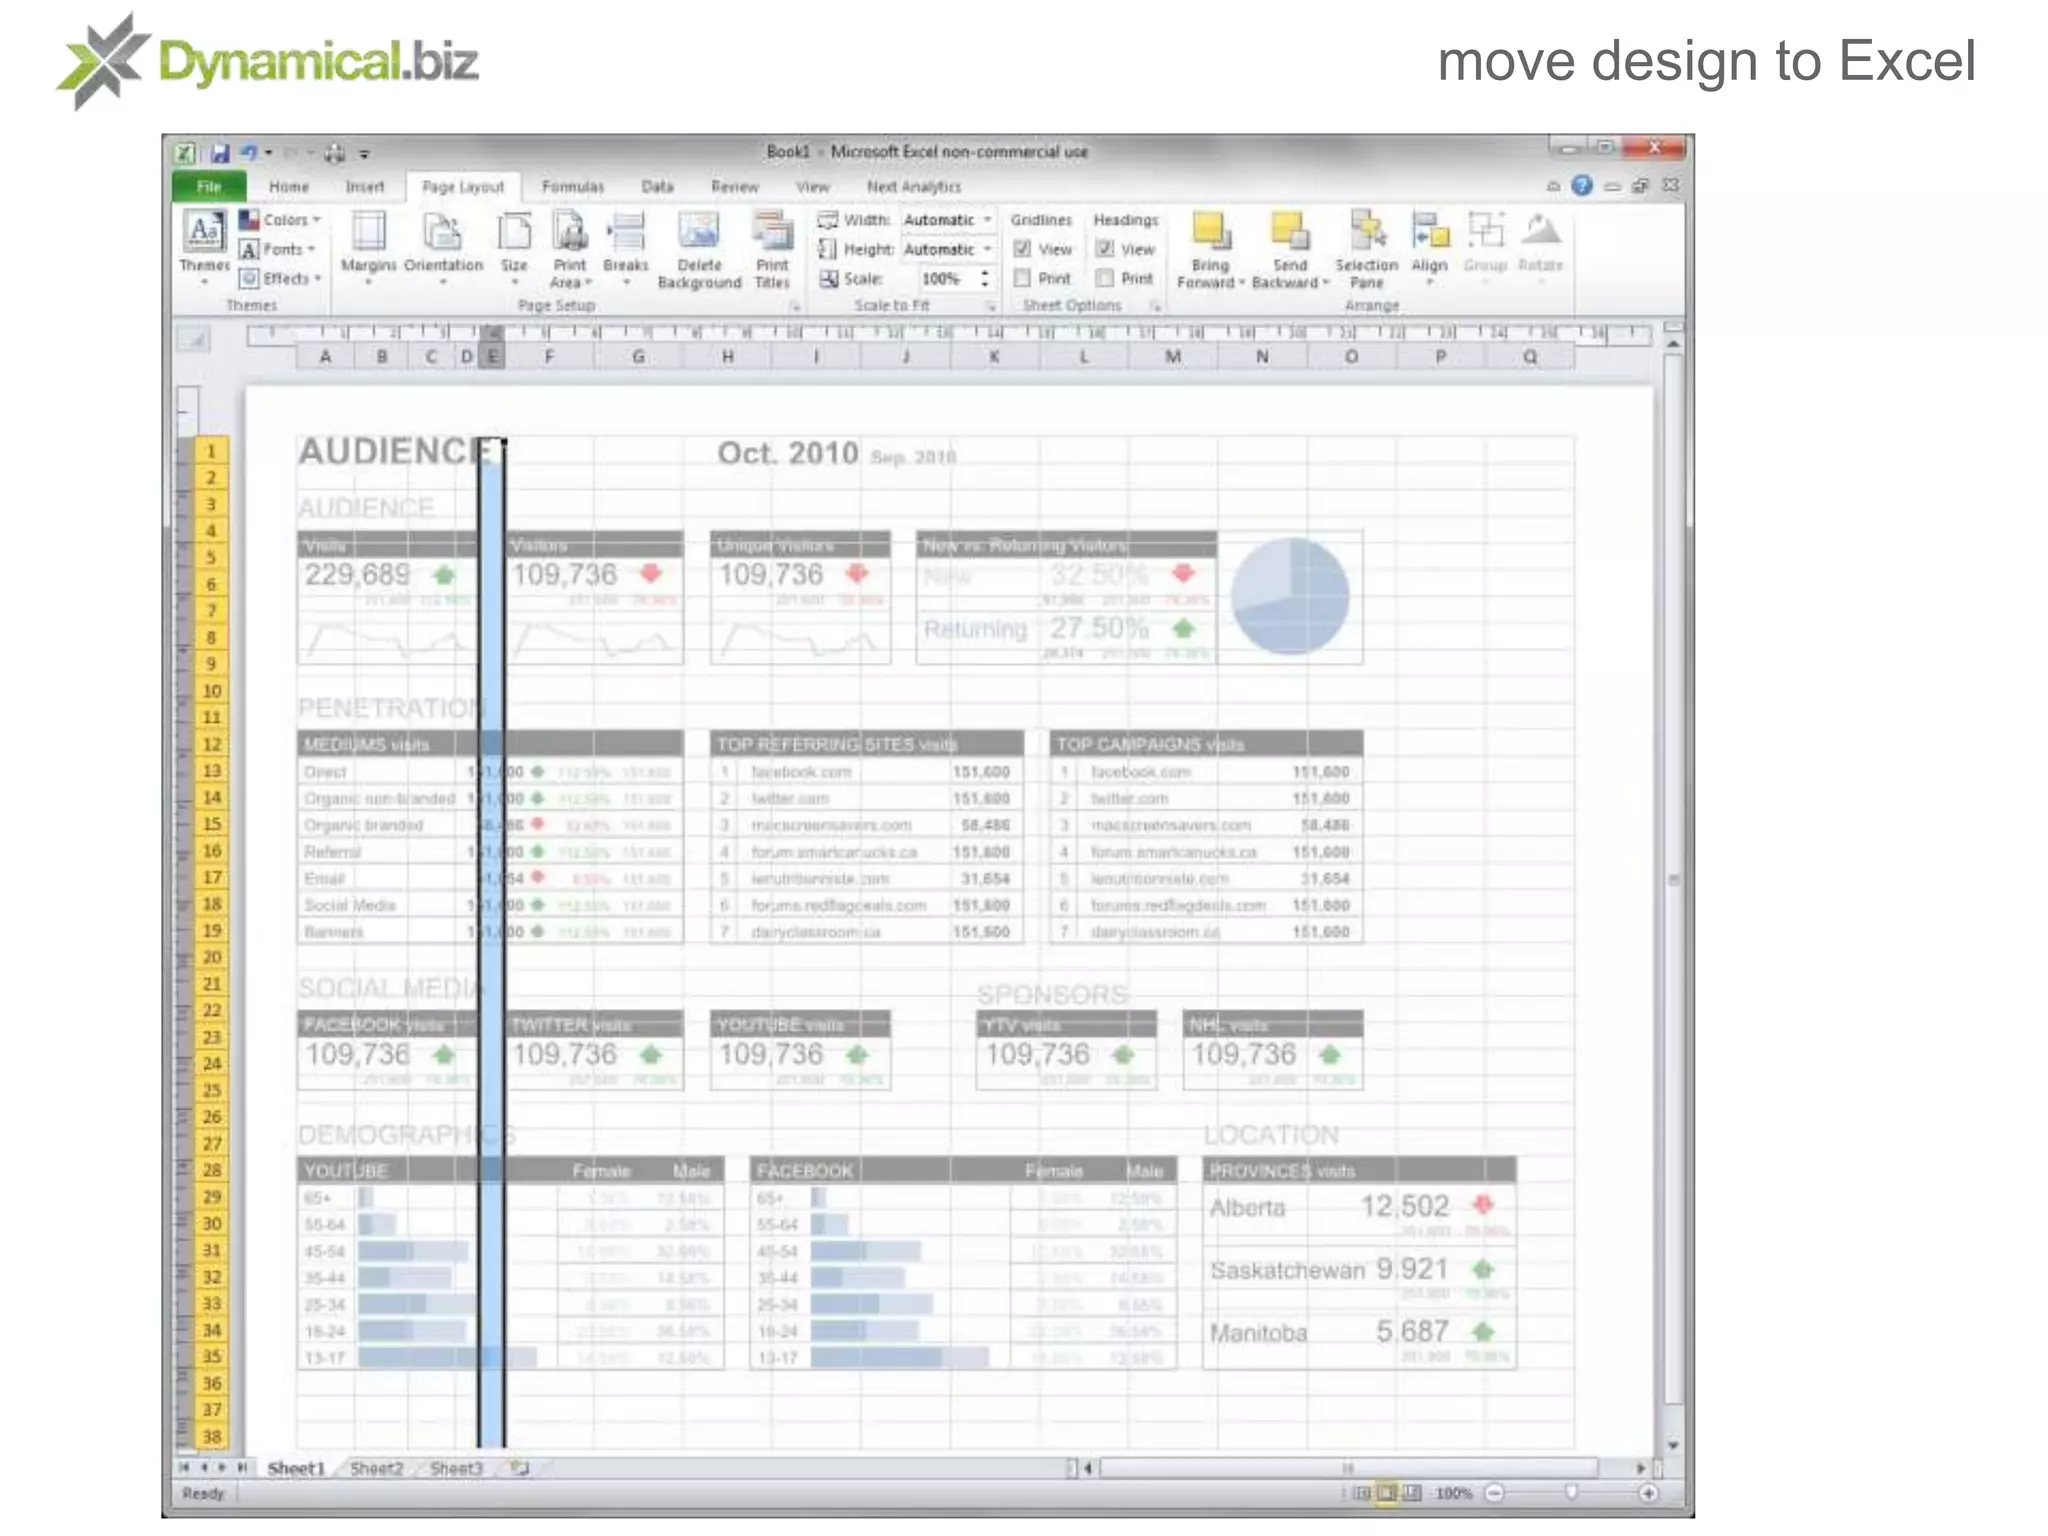
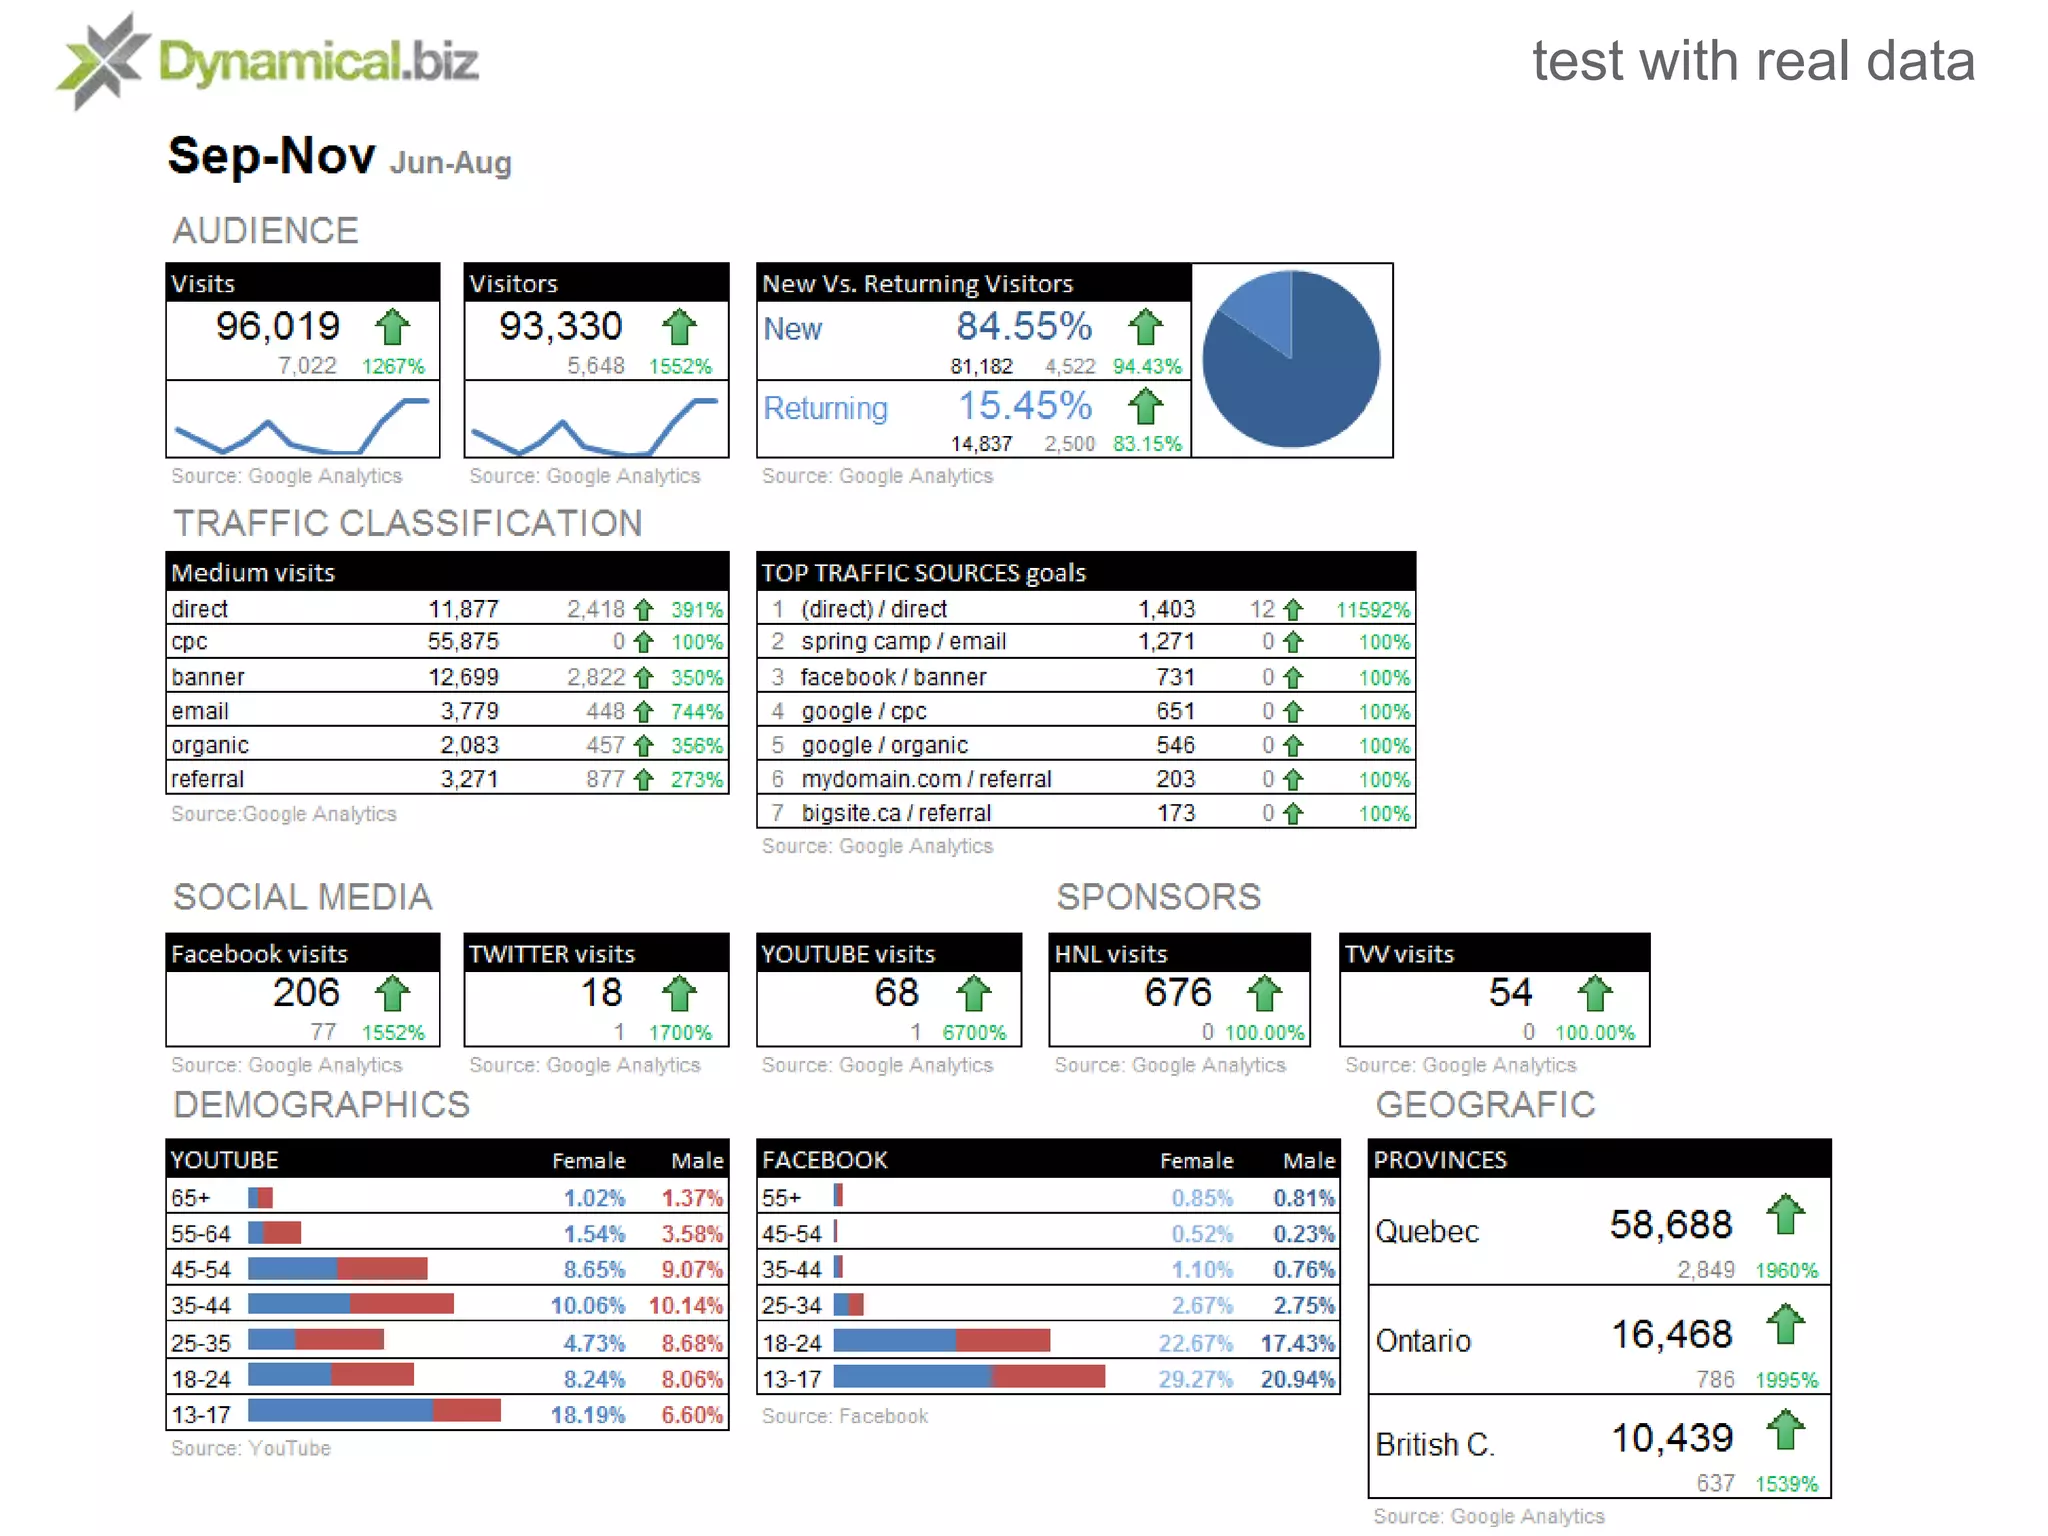
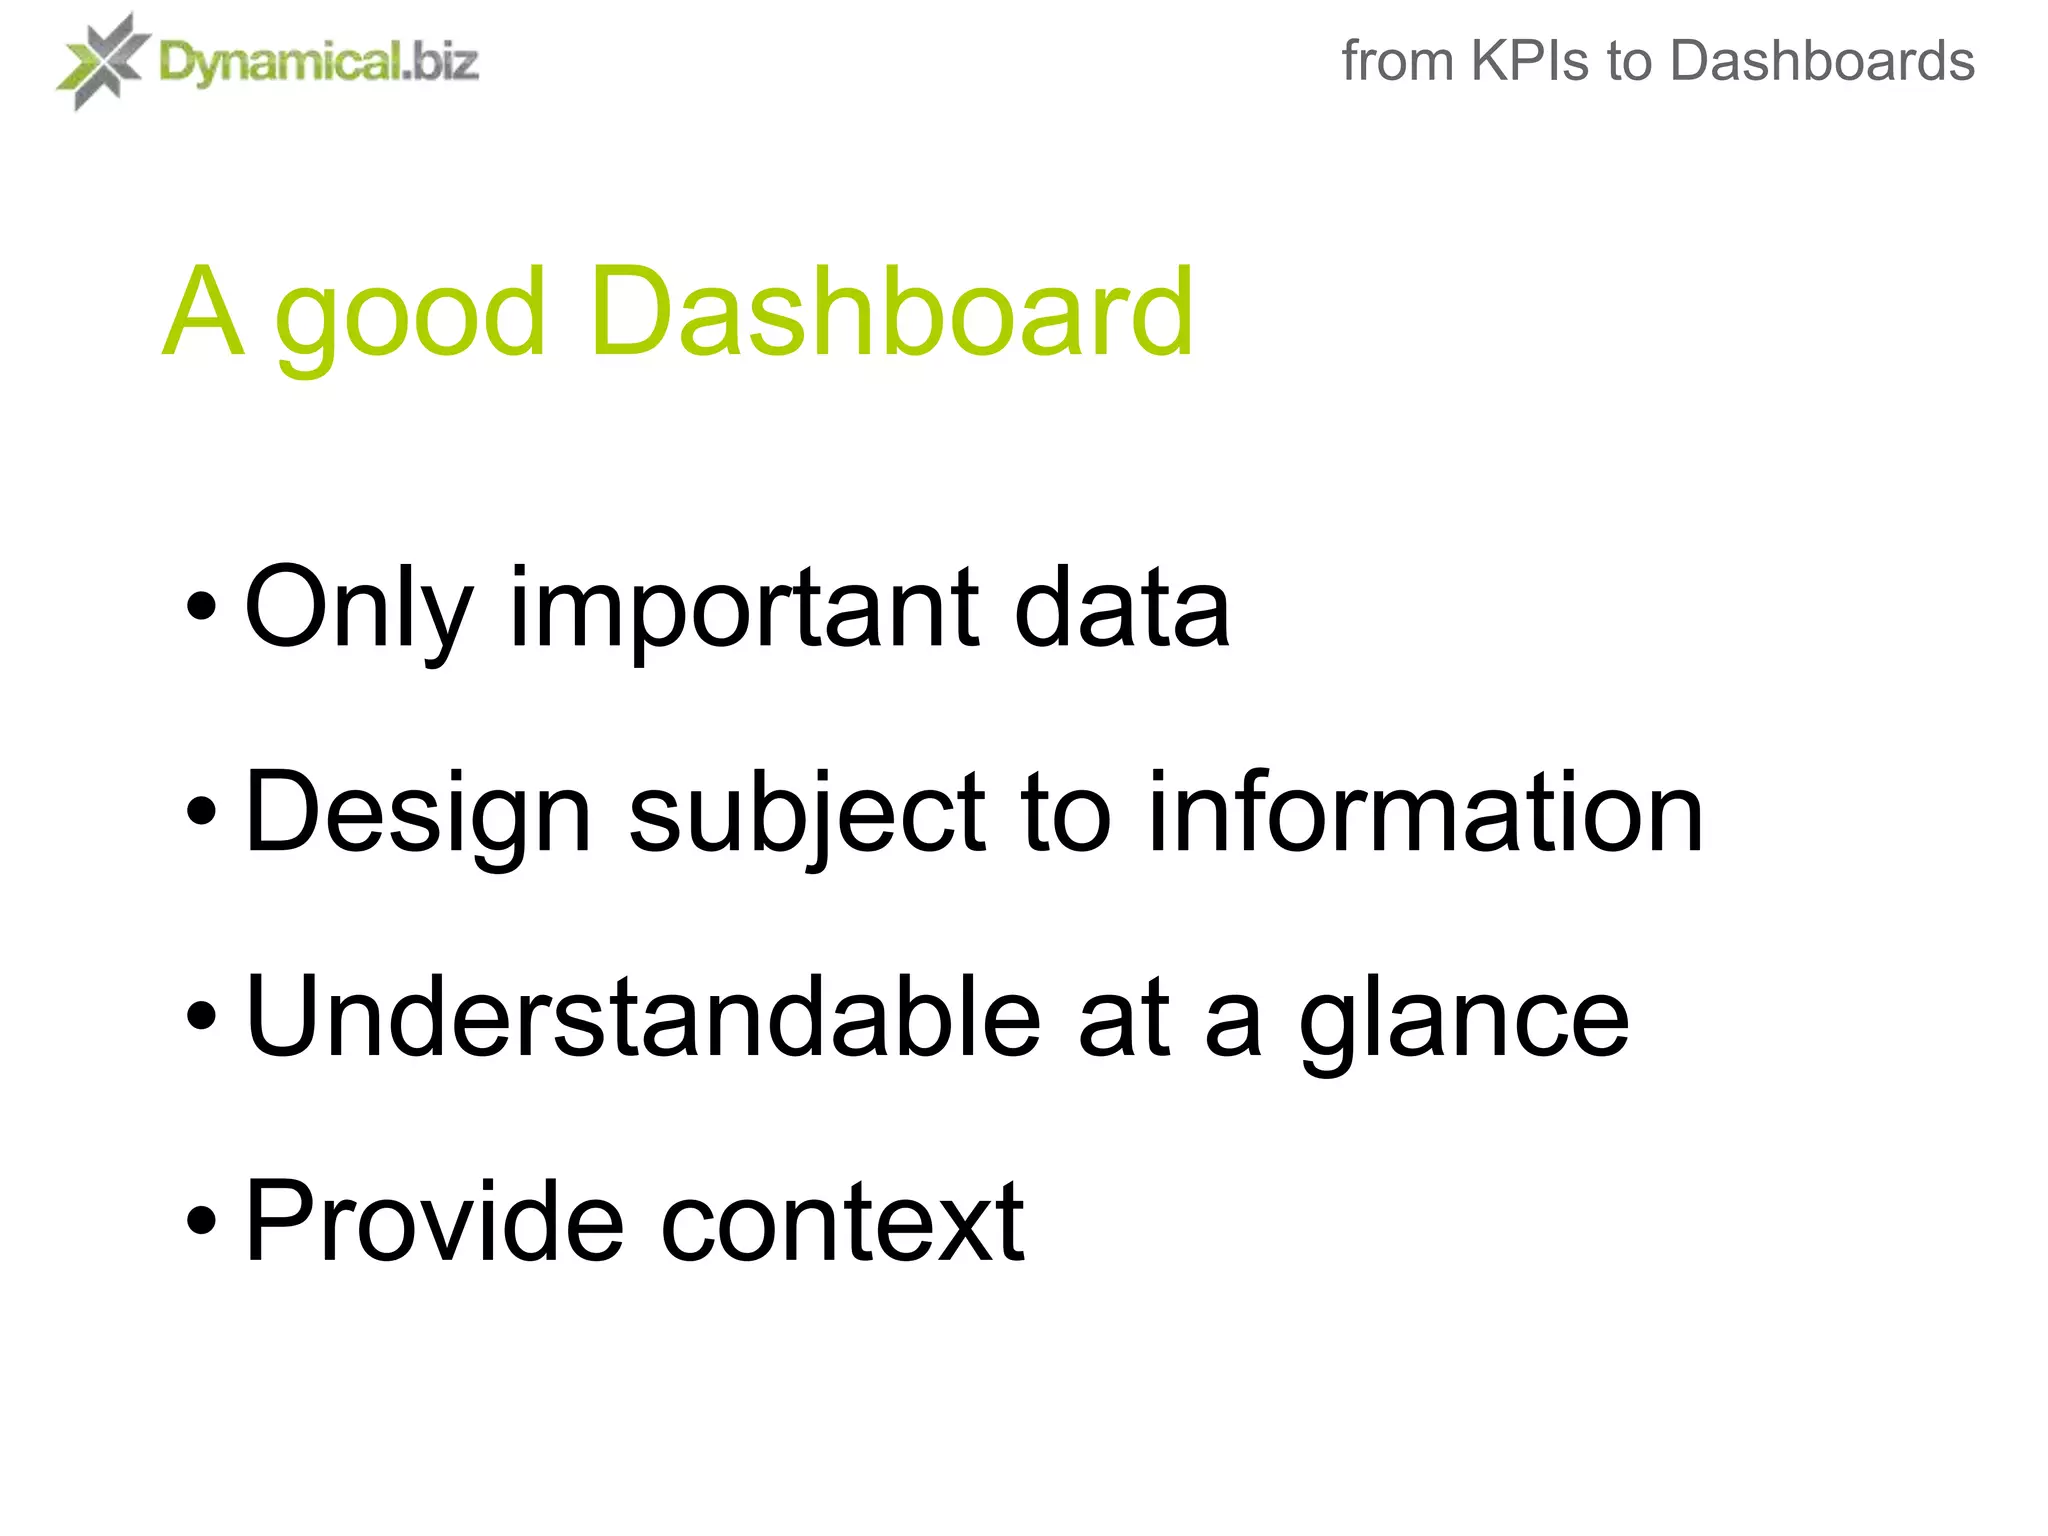
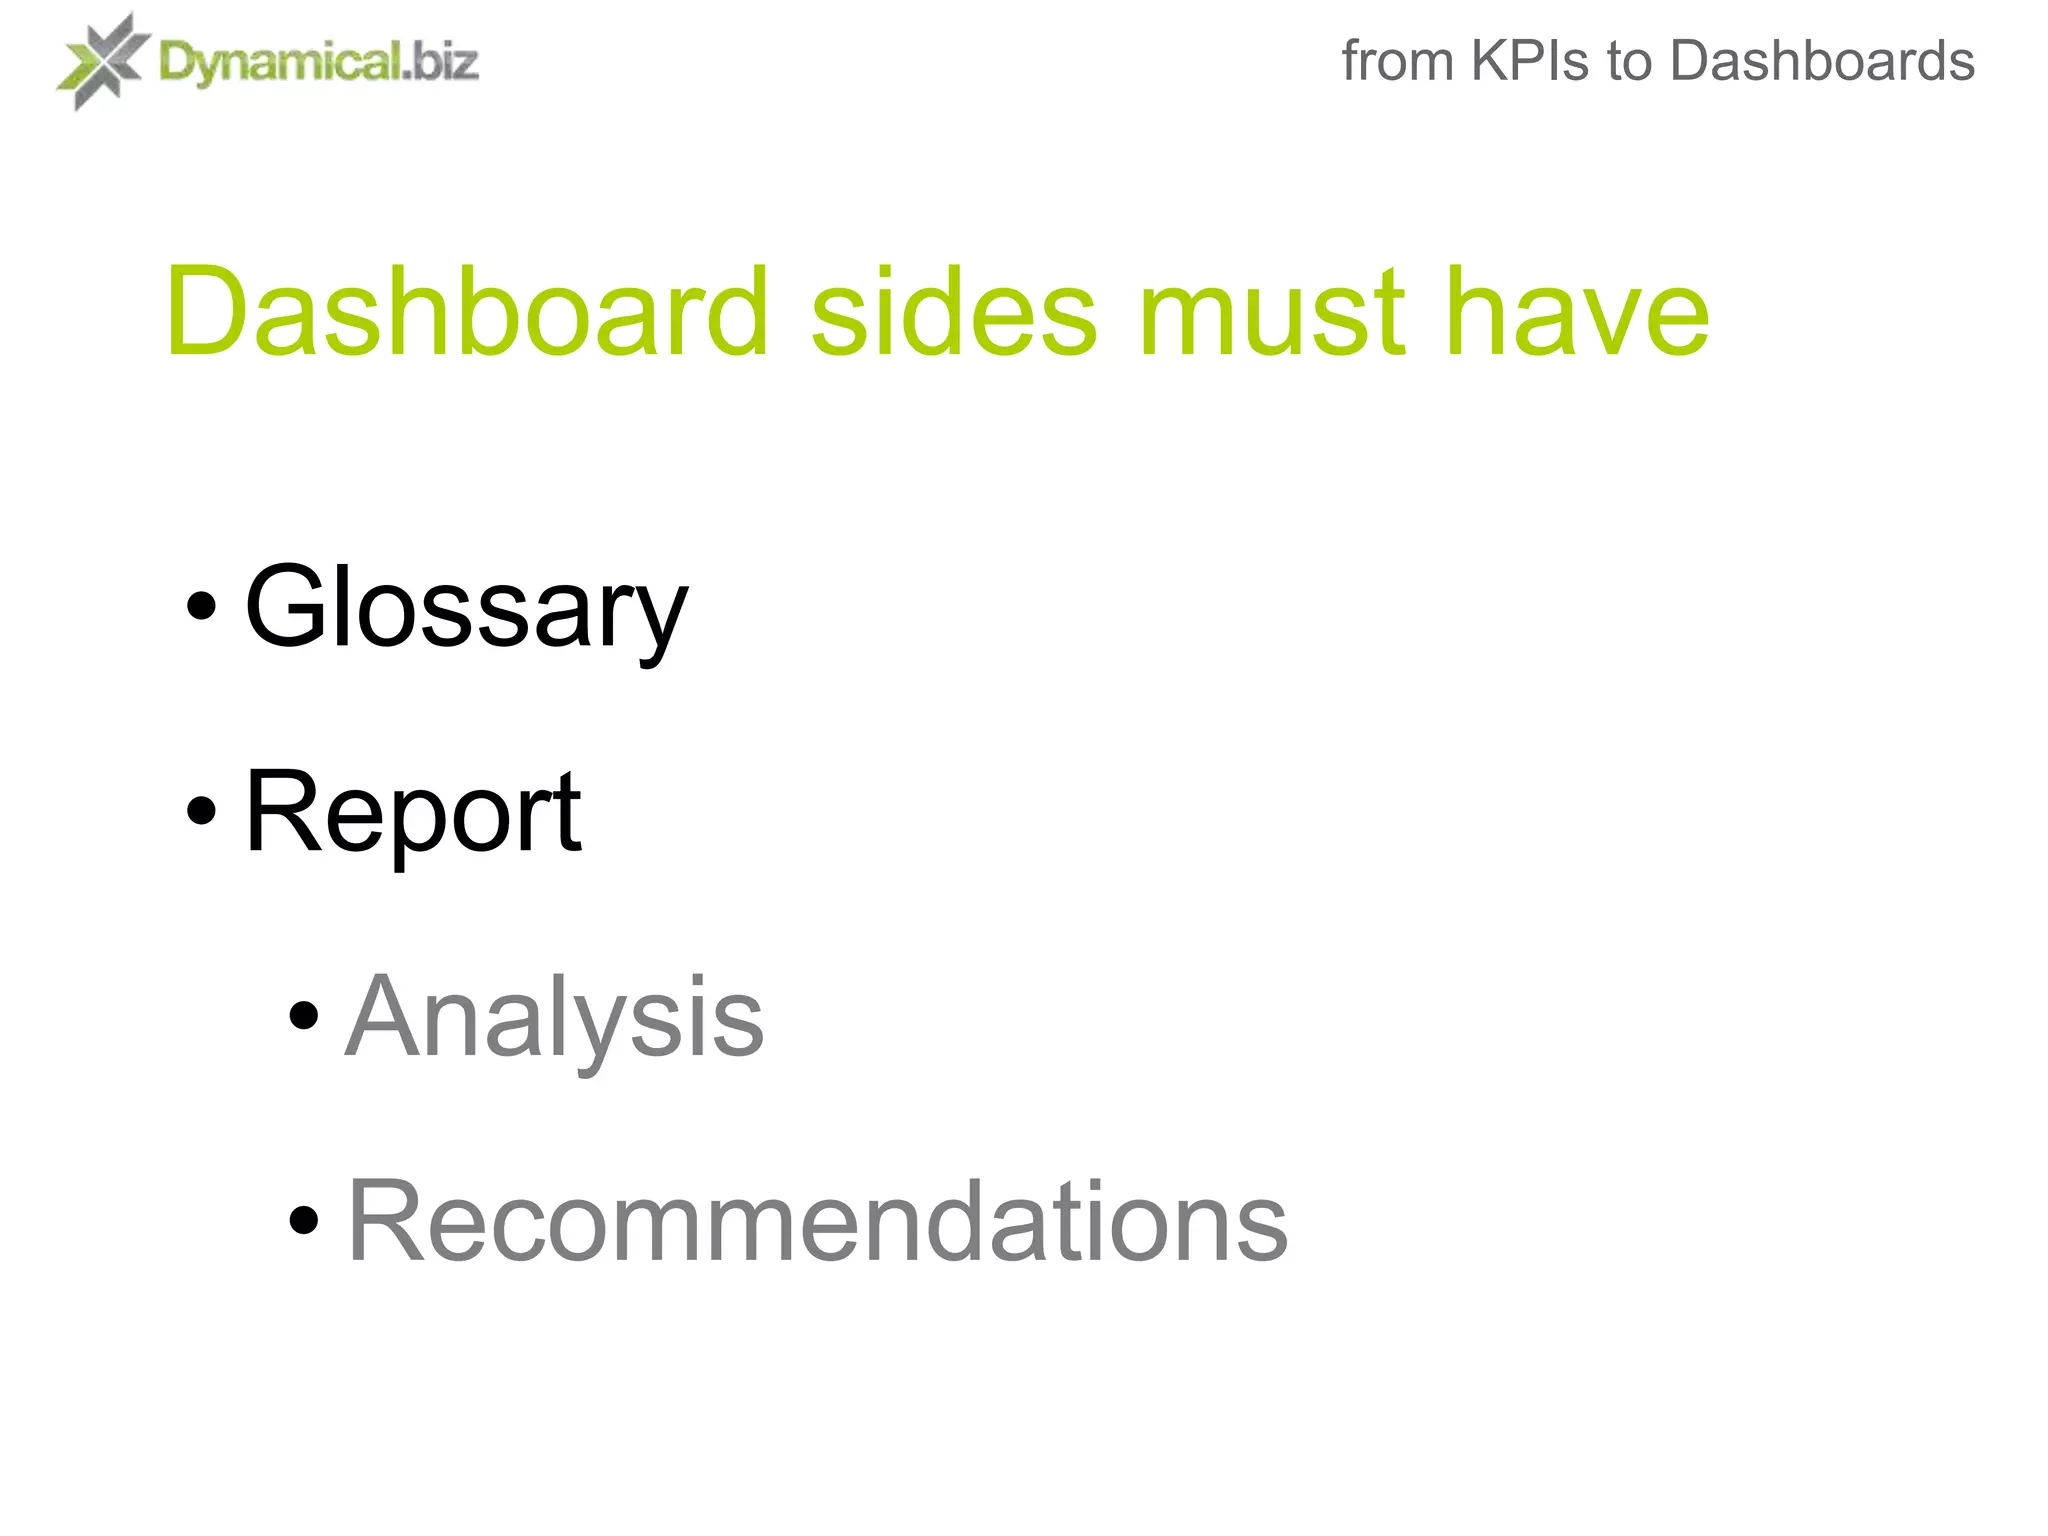


The document discusses the importance of dashboards in web analytics, highlighting their role in measuring business performance through key performance indicators (KPIs). It outlines the design process for creating effective dashboards, including defining objectives, collecting data, and utilizing reportlets for better insights. Additionally, it emphasizes that dashboards should present essential information clearly and concisely for informed decision-making.


![Vibe Coding vs. Spec-Driven Development [Free Meetup]](https://cdn.slidesharecdn.com/ss_thumbnails/vibecodingvsspecdrivendevelopment-251209105622-43f455e7-thumbnail.jpg?width=640&height=640&fit=bounds)


