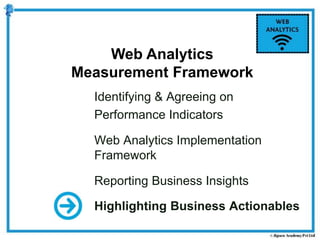
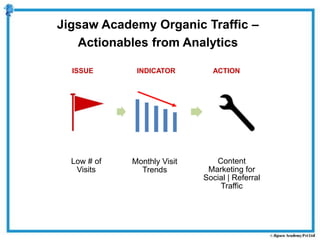
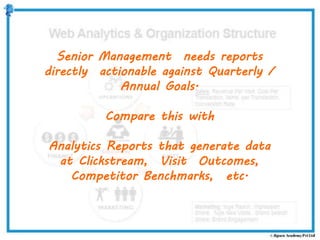
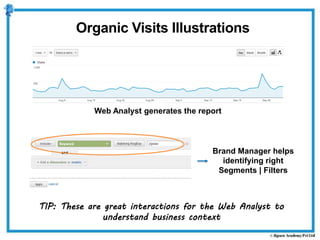
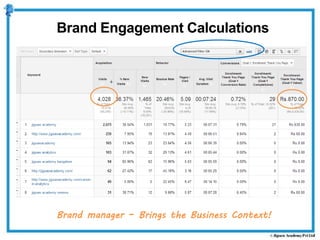
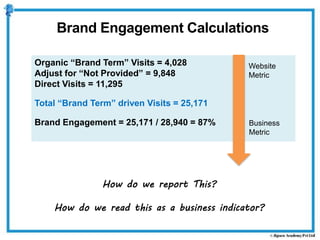
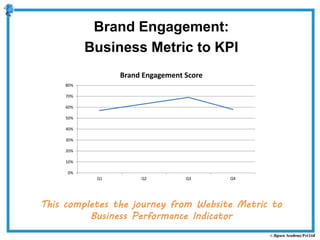
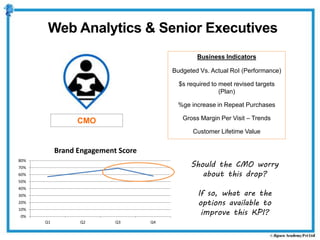
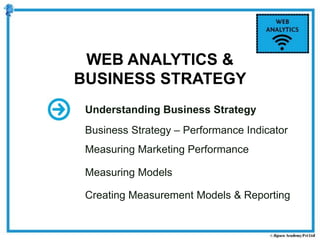
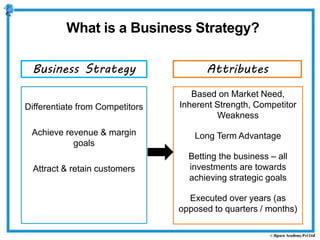
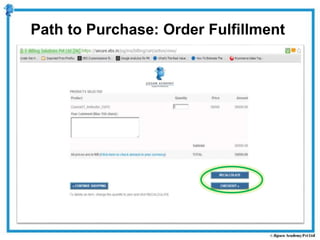
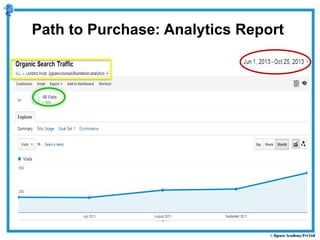
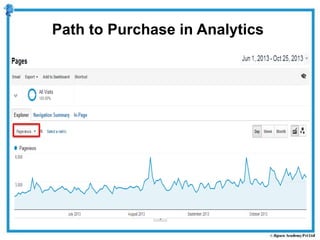
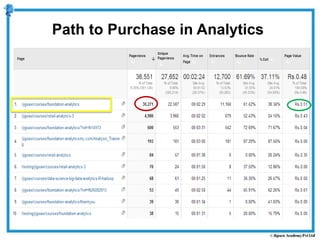
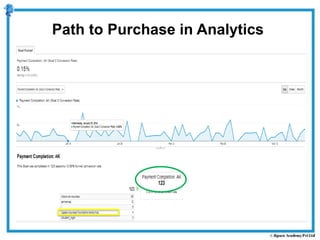
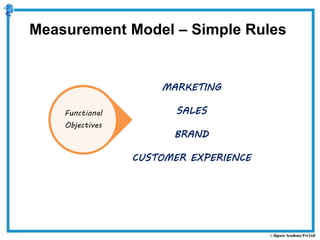
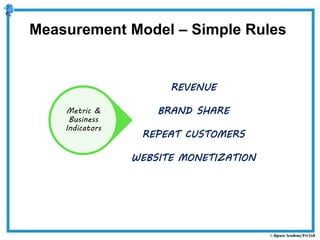
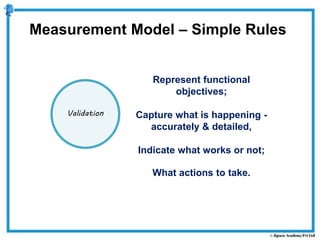
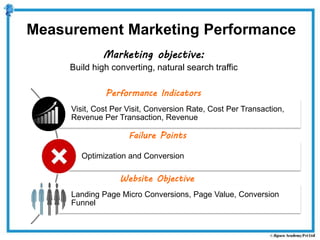
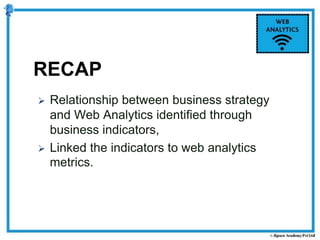
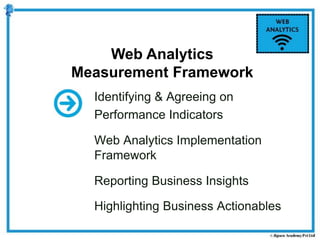
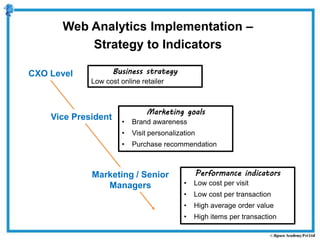
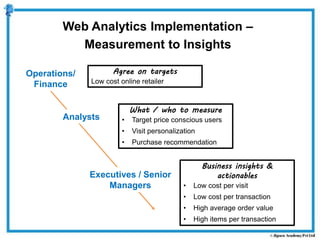
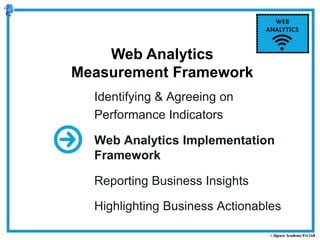
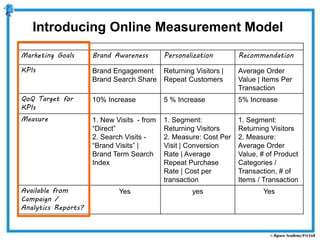
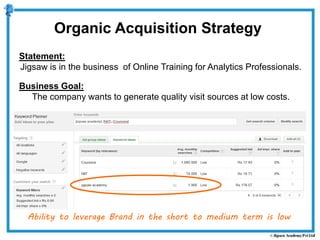
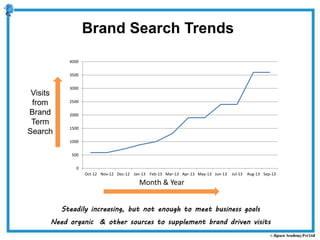
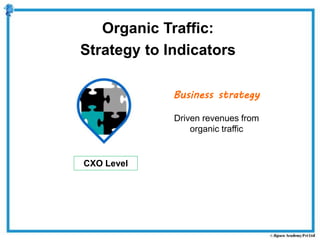
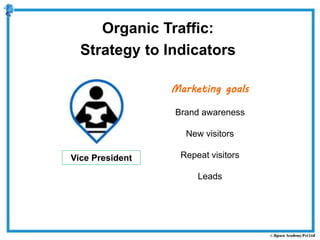
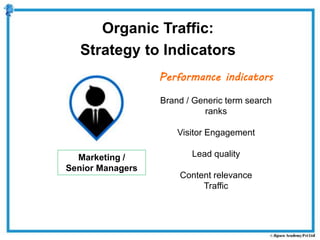
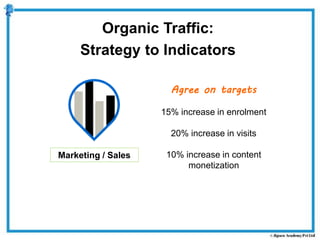
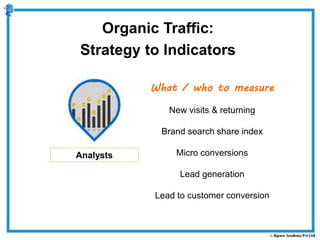
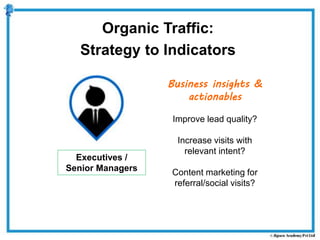
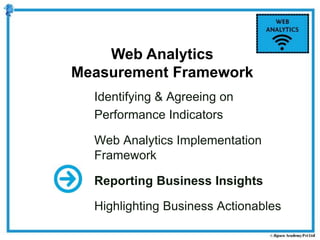
The document discusses implementing a web analytics measurement framework. It recommends identifying key performance indicators aligned to business strategy. An online measurement model is introduced linking marketing goals to key performance indicators and targets. Reporting is designed to highlight business insights and actionables based on web analytics data. The framework provides a way to track performance and calibrate actions based on data-driven insights.


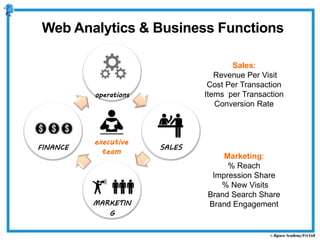
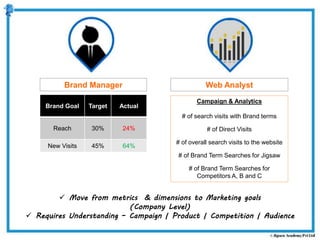

![CMO Brand Manager
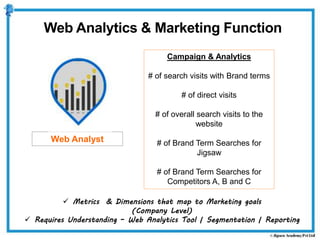
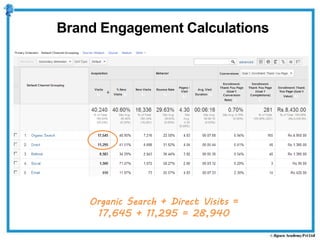
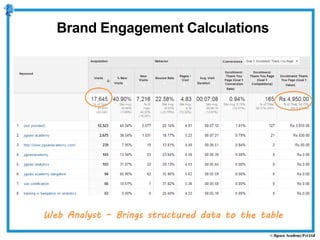
• (# of Brand Term Search Visits + # of Direct Visits) /
(# of Search Visits + # of Direct visits)
Brand
Engagement
• (# of Brand Term Searches for Jigsaw) / (# of Brand
Term Searches for [Jigsaw + Competitors])
Brand Search
Share Index
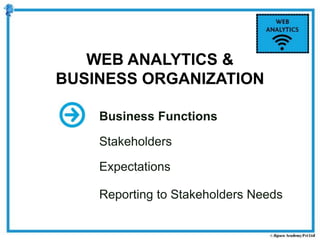
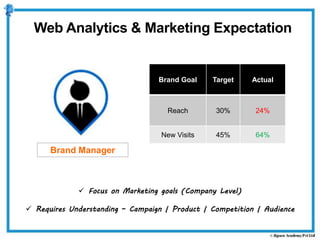
move from marketing metrics to business measures (industry perspective)
Take actions – requires business understanding
Web Analytics & Business Expectations](https://image.slidesharecdn.com/c2t1-t2-t3-140812064927-phpapp02/85/WebC2-t1-t2-t3-19-320.jpg)


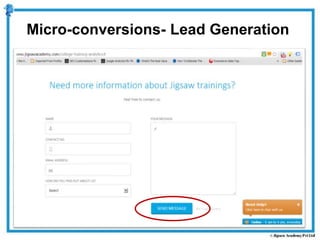


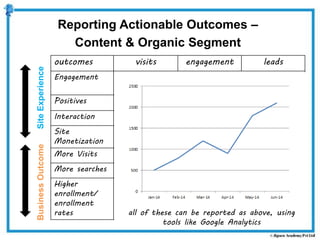
![Outcomes Company Product Blog
Engagement Time on Page, Bounce rates, Pages / Visit, Chats /
Visit
Positives Comments / Likes
Interaction Comments | Scroll Downs | Video Play
Site
Monetization
[Micro Conversions, Leads, Page] - $ Values / Visit
Visits # of First Time | Repeat Visitors
Leads # of Leads / Enquiries
Higher
Conversions /
Conversion
Rates
Visits to Leads| Leads to Purchase| # of Purchases |
Average Purchase Value
SiteExperienceBusinessOutcome
Reporting Actionable Outcomes –
Content & Organic Segment](https://image.slidesharecdn.com/c2t1-t2-t3-140812064927-phpapp02/85/WebC2-t1-t2-t3-81-320.jpg)