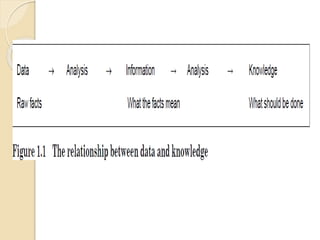
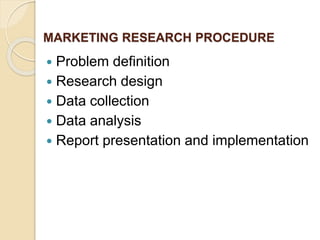
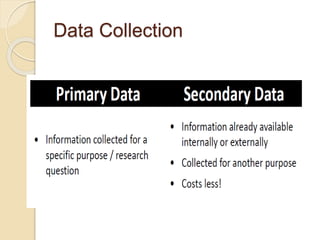
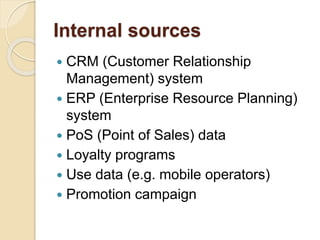
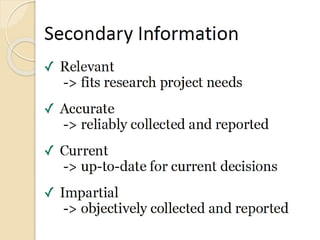
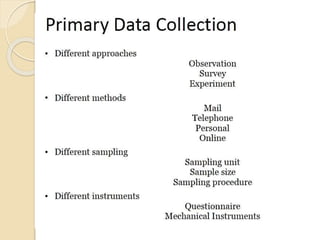
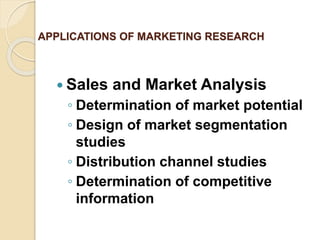
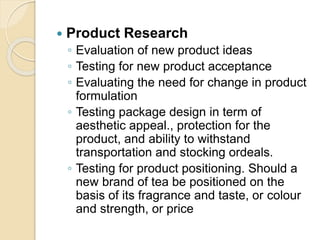
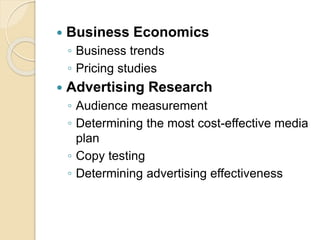
MARKETING RESEARCH
Deep J. Gurung
Assistant Professor
Department of Commerce
CHRIST (Deemed to be University)
Main Campus, Bengaluru (India)
Marketing Research defined:
 Marketing is an organizational function
and a set of processes for creating,
communicating, and delivering value
to customers and for managing
customer relationships in ways that
benefit the organization and its
stakeholders.
 The American Marketing
Association defines marketing
research as
"the systematic gathering, recording
and analysing of data about problems
related to the marketing of goods and
services".
 Marketing research is the function
which links the consumer, customer,
and public to the marketer through
information – information used to
identify and define marketing
opportunities and problems; generate,
refine and evaluate marketing actions;
monitor marketing performance; and
improve our understanding of
marketing as a process.- American Marketing Association
 Marketing research specifies the
information required to address
these issues, designs the method
for collecting information, manages
and implements the data collection
process, analyzes the results, and
communicates the findings and their
implications.
TWO MAIN PURSPOSE FOR
MARKETING RESEARCH
 Problem Identification research
 Problem Solving Research
SCOPE OF MARKETING
RESEARCH
 Concerned with identifying and
fulfilling customer needs and wants
 Product and product design
 Types of distribution channels and
retail outlets
 Provide information on the most cost-
effective media
MARKETING RESEARCH PROCEDURE
 Problem definition
 Research design
 Data collection
 Data analysis
 Report presentation and implementation
Problem Definition
Research Design
Data Collection
SECONDARY DATA
External Sources
 International Labour Organisation,
 World Bank,
 International Monetary Fund,
 Government and its many agencies
 Planning Commission,
 Central Statistical Organisation,
 Reserve bank of India,
 Census Commission,
 Private research organisations,
 Trade associations.
Internal sources
 CRM (Customer Relationship
Management) system
 ERP (Enterprise Resource Planning)
system
 PoS (Point of Sales) data
 Loyalty programs
 Use data (e.g. mobile operators)
 Promotion campaign
Probability Sampling
 Simple random sampling: Every member of the
population has a known and equal chance of
selection. Only one stage of selection.
 Systematic sampling: starting point selected by
a random process and then every nth number on
the list is selected. The problem of periodicity
occurs if a list has a systematic pattern (not
random).
 Stratified sampling: simple random subsamples
are drawn from within each stratum of the
population. First, a variable is identified for
stratification (e.g. age). Second, for each
separate subgroup/stratum (e.g. 16-25, 26-40,
41-55), a list of population elements must be
obtained.
 Cluster (area) sampling: the primary
sampling unit is no longer the individual
element in the population (e.g. grocery
store) but a larger cluster of elements
located in proximity to one another (e.g.
cities).
 Multistage area sampling: a
combination of two or more probability
sampling techniques. Progressively
smaller areas/units are selected in each
stage (e.g. City -> Neighbourhood -> Age
group -> occupation, …)
Non-Probability Sampling
 Convenience sampling: people that
are most conveniently available (e.g.
selecting all visitors to a website).
Produces a large number of
responses quickly and at a low cost,
but induces a self-selection bias.
 Judgment (purposive) sampling:
based on personal judgment about
some appropriate characteristic, to
achieve specific objective.
 Quota sampling: various population
subgroups are represented on
pertinent characteristics to the extent
that the researcher desires.
 Snowball sampling: initial
respondents are selected by
probability methods and additional
respondents are obtained from
information provided by the initial
respondents.
Qualitative vs. Quantitative
 Quality
 What, why, how
 Ethnography
 Netnography
 Focus Group
Discussion
 Interviews
 Case studies
 Subjectivity
 Understanding or
exploring change
 Quantity
 How many
 Surveys
 Facts
 Statistics
 Objectivity
 Prediction
 Proof
 Hypothesis
Types of Interview
Case studies
 Critical: a clearly specified hypothesis
is tested
 Unique and extreme
 Revelatory: study of a phenomenon
previously inaccessible to research
 Representative or typical
 Longitudinal: over time changes
QUANITATIVE METHOD
 Measurement: the process of describing
some property or a phenomenon of interest,
usually by assigning numbers in a reliable
and valid way. The numbers convey
information about the property being
measured. All measurements contain errors.
Researchers must make sure that the
measures used, if not perfect, are accurate
enough to yield correct conclusions.
 Construct: term used to refer to concepts
measured with multiple variables.
 Scales: a device providing a range of values
that correspond to different values in a
concept being measured.
Types of Scale
 Nominal scales: values are assigned to
an object for identification or
classification purposes only (e.g.
gender).
 Ordinal scales: rank order allowing
things to be arranged based on how
much of some concept they possess
(grade).
 Interval scales: capture info about
differences in quantities of a concept
form one observation to the next (IQ).
 Ratio scales: represent absolute
quantities; characterized by a meaningful
absolute zero (age).
RELIABILITY vs. VALIDITY
 Reliability: indicator of a measure's internal
consistency. Different attempts at measuring
something should converge on the same
result.
 Validity: the accuracy of a measure of the
extent to which a score truthfully represents a
concept. Basically how a measure assesses
the intended concept.
 Face validity: a scale's content logically
appears to reflect what was intended to be
measured (according to 'experts').
 Content validity: a measure covers the
breadth of the domain of interest.
 Criterion validity: the ability of a measure
to correlate with other standard
measures of similar constructs or
established criteria.
 Construct validity: exists when a
measure truthfully represents a unique
concept.
 Convergent validity: concepts that should
be related to one another are in fact
related.
 Discriminant validity: uniqueness or
distinctiveness of a measure. A scale
should not correlate too highly with a
measure of a different construct.
Survey Errors
 Random sampling error: statistical
fluctuation that occurs because of
chance variation in the elements
selected for a sample. Unavoidable
without very large population (> 400).
 Respondent error: sample bias
resulting from some respondents’ action
or inaction.
◦ Nonresponse error
 Response bias: respondents
(un)consciously answer questions with a
certain slant that misrepresents the truth.
◦ Extremity bias: choose only 1 or 10 on a 10-
point scale
◦ Surveyor bias: respondents influenced by
interviewer's presence
◦ Social desirability bias: caused by
respondents' desire to gain prestige or
appear in a different social role
 Administrative error: error caused by the
improper administration or execution of the
research task (e.g. confusion, carelessness,
neglect, omission).
 Data-processing error: incorrect data entry
or computer programming, or other
procedural errors during the data analysis.
 Sample selection error: failure to select a
representative sample caused by improper
sample design or sampling procedure
execution.
 Surveyor error: failures to record responses
correctly.
 Surveyor cheating (“curb-stoning"):
falsification of questionnaires.
Data Analysis
 Correlation
 Regression Analysis
 Multiple regression analysis
 Discriminant analysis
 Factor analysis
Report presentation and
Implementation
 Objectives and methodology
 Summary of conclusions and
recommendations
 Sample and its characteristics
 Detailed findings and observations
 Conclusion
 Questionnaire / Research Instrument
 Bibliography
Eye Tracking Experiment
http://youtu.be/Mm0g8mVHffE
APPLICATIONS OF MARKETING RESEARCH
 Sales and Market Analysis
◦ Determination of market potential
◦ Design of market segmentation
studies
◦ Distribution channel studies
◦ Determination of competitive
information
 Product Research
◦ Evaluation of new product ideas
◦ Testing for new product acceptance
◦ Evaluating the need for change in product
formulation
◦ Testing package design in term of
aesthetic appeal., protection for the
product, and ability to withstand
transportation and stocking ordeals.
◦ Testing for product positioning. Should a
new brand of tea be positioned on the
basis of its fragrance and taste, or colour
and strength, or price
 Business Economics
◦ Business trends
◦ Pricing studies
 Advertising Research
◦ Audience measurement
◦ Determining the most cost-effective media
plan
◦ Copy testing
◦ Determining advertising effectiveness
References
 Marketing Research: Text and
Cases Paperback – 1 Jul 2017
 McGraw Hill Education; 3 edition
 by Rajendra Nargundkar
 ISBN-10: 0070220875
 ISBN-13: 978-0070220874

Marketing research

  • 1.
    MARKETING RESEARCH Deep J.Gurung Assistant Professor Department of Commerce CHRIST (Deemed to be University) Main Campus, Bengaluru (India)
  • 2.
    Marketing Research defined: Marketing is an organizational function and a set of processes for creating, communicating, and delivering value to customers and for managing customer relationships in ways that benefit the organization and its stakeholders.
  • 3.
     The AmericanMarketing Association defines marketing research as "the systematic gathering, recording and analysing of data about problems related to the marketing of goods and services".
  • 4.
     Marketing researchis the function which links the consumer, customer, and public to the marketer through information – information used to identify and define marketing opportunities and problems; generate, refine and evaluate marketing actions; monitor marketing performance; and improve our understanding of marketing as a process.- American Marketing Association
  • 5.
     Marketing researchspecifies the information required to address these issues, designs the method for collecting information, manages and implements the data collection process, analyzes the results, and communicates the findings and their implications.
  • 8.
    TWO MAIN PURSPOSEFOR MARKETING RESEARCH  Problem Identification research  Problem Solving Research
  • 10.
    SCOPE OF MARKETING RESEARCH Concerned with identifying and fulfilling customer needs and wants  Product and product design  Types of distribution channels and retail outlets  Provide information on the most cost- effective media
  • 11.
    MARKETING RESEARCH PROCEDURE Problem definition  Research design  Data collection  Data analysis  Report presentation and implementation
  • 12.
  • 14.
  • 16.
  • 17.
  • 18.
    External Sources  InternationalLabour Organisation,  World Bank,  International Monetary Fund,  Government and its many agencies  Planning Commission,  Central Statistical Organisation,  Reserve bank of India,  Census Commission,  Private research organisations,  Trade associations.
  • 19.
    Internal sources  CRM(Customer Relationship Management) system  ERP (Enterprise Resource Planning) system  PoS (Point of Sales) data  Loyalty programs  Use data (e.g. mobile operators)  Promotion campaign
  • 24.
    Probability Sampling  Simplerandom sampling: Every member of the population has a known and equal chance of selection. Only one stage of selection.  Systematic sampling: starting point selected by a random process and then every nth number on the list is selected. The problem of periodicity occurs if a list has a systematic pattern (not random).  Stratified sampling: simple random subsamples are drawn from within each stratum of the population. First, a variable is identified for stratification (e.g. age). Second, for each separate subgroup/stratum (e.g. 16-25, 26-40, 41-55), a list of population elements must be obtained.
  • 25.
     Cluster (area)sampling: the primary sampling unit is no longer the individual element in the population (e.g. grocery store) but a larger cluster of elements located in proximity to one another (e.g. cities).  Multistage area sampling: a combination of two or more probability sampling techniques. Progressively smaller areas/units are selected in each stage (e.g. City -> Neighbourhood -> Age group -> occupation, …)
  • 26.
    Non-Probability Sampling  Conveniencesampling: people that are most conveniently available (e.g. selecting all visitors to a website). Produces a large number of responses quickly and at a low cost, but induces a self-selection bias.  Judgment (purposive) sampling: based on personal judgment about some appropriate characteristic, to achieve specific objective.
  • 27.
     Quota sampling:various population subgroups are represented on pertinent characteristics to the extent that the researcher desires.  Snowball sampling: initial respondents are selected by probability methods and additional respondents are obtained from information provided by the initial respondents.
  • 29.
    Qualitative vs. Quantitative Quality  What, why, how  Ethnography  Netnography  Focus Group Discussion  Interviews  Case studies  Subjectivity  Understanding or exploring change  Quantity  How many  Surveys  Facts  Statistics  Objectivity  Prediction  Proof  Hypothesis
  • 30.
  • 31.
    Case studies  Critical:a clearly specified hypothesis is tested  Unique and extreme  Revelatory: study of a phenomenon previously inaccessible to research  Representative or typical  Longitudinal: over time changes
  • 32.
    QUANITATIVE METHOD  Measurement:the process of describing some property or a phenomenon of interest, usually by assigning numbers in a reliable and valid way. The numbers convey information about the property being measured. All measurements contain errors. Researchers must make sure that the measures used, if not perfect, are accurate enough to yield correct conclusions.  Construct: term used to refer to concepts measured with multiple variables.  Scales: a device providing a range of values that correspond to different values in a concept being measured.
  • 33.
    Types of Scale Nominal scales: values are assigned to an object for identification or classification purposes only (e.g. gender).  Ordinal scales: rank order allowing things to be arranged based on how much of some concept they possess (grade).  Interval scales: capture info about differences in quantities of a concept form one observation to the next (IQ).  Ratio scales: represent absolute quantities; characterized by a meaningful absolute zero (age).
  • 34.
    RELIABILITY vs. VALIDITY Reliability: indicator of a measure's internal consistency. Different attempts at measuring something should converge on the same result.  Validity: the accuracy of a measure of the extent to which a score truthfully represents a concept. Basically how a measure assesses the intended concept.  Face validity: a scale's content logically appears to reflect what was intended to be measured (according to 'experts').  Content validity: a measure covers the breadth of the domain of interest.
  • 35.
     Criterion validity:the ability of a measure to correlate with other standard measures of similar constructs or established criteria.  Construct validity: exists when a measure truthfully represents a unique concept.  Convergent validity: concepts that should be related to one another are in fact related.  Discriminant validity: uniqueness or distinctiveness of a measure. A scale should not correlate too highly with a measure of a different construct.
  • 36.
    Survey Errors  Randomsampling error: statistical fluctuation that occurs because of chance variation in the elements selected for a sample. Unavoidable without very large population (> 400).
  • 37.
     Respondent error:sample bias resulting from some respondents’ action or inaction. ◦ Nonresponse error  Response bias: respondents (un)consciously answer questions with a certain slant that misrepresents the truth. ◦ Extremity bias: choose only 1 or 10 on a 10- point scale ◦ Surveyor bias: respondents influenced by interviewer's presence ◦ Social desirability bias: caused by respondents' desire to gain prestige or appear in a different social role
  • 38.
     Administrative error:error caused by the improper administration or execution of the research task (e.g. confusion, carelessness, neglect, omission).  Data-processing error: incorrect data entry or computer programming, or other procedural errors during the data analysis.  Sample selection error: failure to select a representative sample caused by improper sample design or sampling procedure execution.  Surveyor error: failures to record responses correctly.  Surveyor cheating (“curb-stoning"): falsification of questionnaires.
  • 39.
    Data Analysis  Correlation Regression Analysis  Multiple regression analysis  Discriminant analysis  Factor analysis
  • 40.
    Report presentation and Implementation Objectives and methodology  Summary of conclusions and recommendations  Sample and its characteristics  Detailed findings and observations  Conclusion  Questionnaire / Research Instrument  Bibliography
  • 41.
  • 47.
    APPLICATIONS OF MARKETINGRESEARCH  Sales and Market Analysis ◦ Determination of market potential ◦ Design of market segmentation studies ◦ Distribution channel studies ◦ Determination of competitive information
  • 48.
     Product Research ◦Evaluation of new product ideas ◦ Testing for new product acceptance ◦ Evaluating the need for change in product formulation ◦ Testing package design in term of aesthetic appeal., protection for the product, and ability to withstand transportation and stocking ordeals. ◦ Testing for product positioning. Should a new brand of tea be positioned on the basis of its fragrance and taste, or colour and strength, or price
  • 49.
     Business Economics ◦Business trends ◦ Pricing studies  Advertising Research ◦ Audience measurement ◦ Determining the most cost-effective media plan ◦ Copy testing ◦ Determining advertising effectiveness
  • 50.
    References  Marketing Research:Text and Cases Paperback – 1 Jul 2017  McGraw Hill Education; 3 edition  by Rajendra Nargundkar  ISBN-10: 0070220875  ISBN-13: 978-0070220874