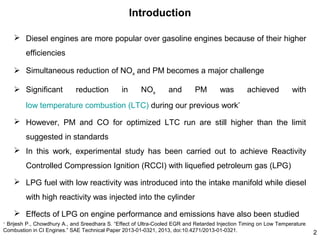
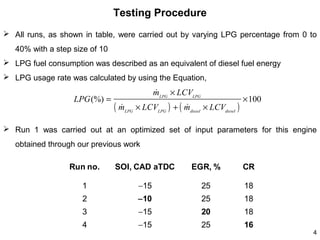
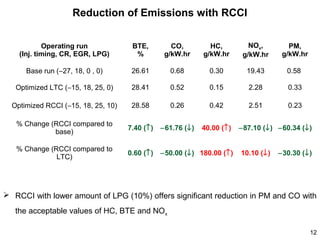
Reactivity Controlled Compression Ignition for Simultaneous
Reduction of Emissions and Fuel Consumption in Diesel Engines

Brijesh P., Chowdhury A., Sreedhara S.
IC Engines and Combustion Laboratory
Indian Institute of Technology Bombay, India
Introduction
 Diesel engines are more popular over gasoline engines because of their higher
efficiencies
 Simultaneous reduction of NOx and PM becomes a major challenge
 Significant

reduction

in

NOx

and

PM

was

achieved

with

low temperature combustion (LTC) during our previous work*
 However, PM and CO for optimized LTC run are still higher than the limit
suggested in standards
 In this work, experimental study has been carried out to achieve Reactivity
Controlled Compression Ignition (RCCI) with liquefied petroleum gas (LPG)
 LPG fuel with low reactivity was introduced into the intake manifold while diesel
with high reactivity was injected into the cylinder
 Effects of LPG on engine performance and emissions have also been studied
Brijesh P., Chowdhury A., and Sreedhara S. “Effect of Ultra-Cooled EGR and Retarded Injection Timing on Low Temperature
Combustion in CI Engines.” SAE Technical Paper 2013-01-0321, 2013, doi:10.4271/2013-01-0321.
∗

2
Experimental Test Rig

 LPG was introduced into the intake manifold through LPG nozzle (24 holes, 2
mm dia. of each hole)

3
Testing Procedure
 All runs, as shown in table, were carried out by varying LPG percentage from 0 to
40% with a step size of 10
 LPG fuel consumption was described as an equivalent of diesel fuel energy
 LPG usage rate was calculated by using the Equation,

LPG (%) =

&
(m

&
mLPG × LCVLPG

LPG

&
× LCVLPG ) + ( mdiesel × LCVdiesel )

× 100

 Run 1 was carried out at an optimized set of input parameters for this engine
obtained through our previous work

Run no.

SOI, CAD aTDC

EGR, %

CR

1

−15

25

18

2

−10

25

18

3

−15

20

18

4

−15

25

16

4
Testing Procedure (Contd.)
 Composition and physical properties of LPG was measured by using Gas Chromatograph
with High Resolution Mass Spectrometer (GC-HRMS)
 CHNS elemental analyser was used to measure percentage of carbon, hydrogen,
nitrogen and sulphur in diesel
 Reaction rates of LPG and diesel were calculated by using single step global mechanism
of Westbrook and Dryer and found to be 5.53×10⁸ and 7.91×10⁸ gmol/cm3.s respectively
Measured property of diesel

Value

Specific gravity @ 15oC

0.823

Lower calorific value, MJ/kg

41.23

o

Measured property of LPG

Value

Density @ NTP, kg/m3

1.98

Lower calorific value, MJ/kg

46.48

Auto ignition temperature, oC

460

Viscosity @ 40 C, mm2/s

3.6

Ethane, vol.%

10.38

Auto ignition temperature , oC

210

Propene, vol.%

46.50

Butene, vol.%

21.27

i-Butane, vol.%

3.39

n-Butane, vol.%

17.31

i-Pentane, vol.%

0.24

n-Pentane, vol.%

0.91

Carbon, wt%

82.68

Hydrogen, wt%

13.83

Nitrogen, wt%

3.49

Sulphur, wt%

0

5
Effect of LPG on PM and NOx

Run no.

EGR, %

CR

1

−15

25

18

2

 Reduction in PM was observed with increased LPG percentage

SOI, CAD aTDC

−10

25

18

3

−15

20

18

4

−15

25

16

 Effect of LPG was observed significant in runs 1 and 3 compared to other runs
 Minor changes in NOx were found for all runs with lower flow rates of LPG
 However, NOx was reduced considerably with higher LPG percentage
 Runs 1 and 2 were found most favourable for improved NOx-PM trade-off

6
Effect of LPG on CO and HC

Run no.

EGR, %

CR

−15

25

18

2

 CO was reduced significantly with the introduction of LPG fuel

SOI, CAD aTDC

1

−10

25

18

3

−15

20

18

4

−15

25

16

 Considerable reduction in CO was achieved till LPG is around 10%
 Further reduction in CO was not observed with increasing percentage of LPG
 A fraction of LPG-air mixture might have been trapped in crevices during the
compression stroke
 As a result, higher HC was observed with higher amount of LPG
7
Effect of LPG on BTE
Run no.

SOI, CAD aTDC

EGR, %

CR

1

−15

25

18

2

−10

25

18

3

−15

20

18

4

−15

25

16

 BTE was reduced with increased LPG percentage
 Inducted LPG-air mixture traps in crevices during the compression stroke which in
turn reduces BTE
 Effect of LPG on HC and BTE was observed to be better for run 1. Hence, run 1 is
found optimal
 RCCI achieved with low LPG (∼10%) seems to be optimum for reduction of PM and
8
Effect of LPG on Combustion Parameters

Run no.

EGR, %

CR

1

 The combustion phasing of run 1 seems to be optimum for

SOI, CAD aTDC
−15

25

18

2

−10

25

18

3

−15

20

18

4

−15

25

16

reduction of NOx and PM without altering BTE
 The HRR traces of runs 2 and 3 are slightly shifted towards the compression stroke
while run 4 is shifted much towards the expansion stroke as compared with run 1
 Run 1 was chosen to study the effects of LPG on combustion parameters

9
Effect of LPG on Combustion Parameters (Contd.)
Run 1
SOI
EGR

25%

CR



-15
18

A reduction in premixed HRR peak and minor increase in ignition delays are
observed with increased LPG

 The presence of LPG slow down the chemical reaction rate during premixed
combustion
 Minor changes in ratio of premixed to diffusion combustion were observed with
increased rate of LPG
 As a result, wider and flatter HRR traces, improved LTC, were observed

10
Effect of LPG on Combustion Parameters (Contd.)
Run 1
SOI

-15

EGR

25%

CR

18

 Similar to the HRR traces, in-cylinder pressure traces of run 1 with LPG were also
shifted towards the expansion
 The combustion phases were shifted because of increasing lower reactivity LPG fuel
 Lower peak pressures were found with increasing LPG percentage, hence, reduction
in BTE was observed

11
Reduction of Emissions with RCCI
Operating run
(Inj. timing, CR, EGR, LPG)

BTE,
%

CO,
g/kW.hr

HC,
g/kW.hr

NOx,
g/kW.hr

PM,
g/kW.hr

Base run (−27, 18, 0 , 0)

26.61

0.68

0.30

19.43

0.58

Optimized LTC (−15, 18, 25, 0)

28.41

0.52

0.15

2.28

0.33

Optimized RCCI (−15, 18, 25, 10)

28.58

0.26

0.42

2.51

0.23

% Change (RCCI compared to
base)

7.40 (↑)

−61.76 (↓)

40.00 (↑)

% Change (RCCI compared to
LTC)

0.60 (↑)

−50.00 (↓) 180.00 (↑)

−87.10 (↓) −60.34 (↓)
10.10 (↓)

−30.30 (↓)

 RCCI with lower amount of LPG (10%) offers significant reduction in PM and CO with
the acceptable values of HC, BTE and NOx
12
Conclusions
 Reactivity controlled compression ignition (RCCI) achieved with low
LPG (∼10%) found to be optimum for further reduction of PM and CO
with the acceptable change in values of HC, NOx and BTE
 Reduction in premixed HRR peak and minor increase in ignition delays
were observed with increasing percentages of LPG
 Improved LTC, flatter and wider HRR traces, were achieved with
optimized RCCI
 Reduction in PM, CO and NOx emissions were observed with increased
LPG percentage
 HC was increased and BTE was decreased with increasing amount of
LPG
13
Thank You

14
Back Up

15
Results of Previous Study

 LTC, simultaneous reduction in NOx and PM, was achieved with the optimum operating
parameters
 Very low values of NOx and HC are achieved for the optimized run and are falling below
the limits stated in standards
 PM and CO for optimized run are still higher than the limit suggested in standards

Bharat State emission standards

16
Engine Specifications
Engine type

Four-stroke, water cooled, direct injection VCR engine

Make

Kirloskar Oil Engines Ltd.

Number of cylinders

1

Compression ratio

18:1 to 12:1

Cylinder bore × stroke

87.5 mm × 110 mm

Piston bowl shape

Hemisphere

Piston bowl diameter

52 mm

Maximum power

3.5 kW @ 1500 rpm

Inlet and exhaust valve diameter

34 mm

Inlet valve opens

−364.5 CAD aTDC

Inlet valve closes

−144.5 CAD aTDC

Exhaust valve opens

144.5 CAD aTDC

Exhaust valve closes

364.5 CAD aTDC

Connecting rod length

234 mm

Fuel injection pressure range

180 to 250 bar

Fuel injection timing variation

−27 to −7 CAD aTDC

Number of nozzle holes

3

Nozzle hole diameter

0.288 mm

Nozzle hole L/D ratio

2.78
17
Specifications of Measuring Devices

Fuel line pressure

Instrument;
Make-Model
Dynamic pressure
transducer; PCB
piezotronics-111A22

Operating
range

Uncertainty
/Accuracy

Relative
error

0−345.5 bar

± 1%

± 1%

Engine speed

Encoder; Kubler-3700

0−6000 rpm

± 5 rpm

± 0.34 %

0−3.5 kg/hr

± 0.5 %

± 0.5 %

0−50 kg/hr

± 1%

± 1%

0−50 kg

± 0.075 kg

± 0.625 %

0−1200°C

± 1°C

± 0.34 %

0−5000 ppm

± 5%

± 5%

0−1000 ppm

± 5%

± 5%

HC

0−2000 ppm

± 5%

± 5%

CO

0−100000 ppm

± 5%

± 5%

−

± 5%

± 5%

Measured parameters
In-cylinder pressure

DP Transmitter;
Yokogawa-EJA110A
Air and EGR mass flow Pressure transmitter;
rate
Wika-SL1
Load cell; SensortronicsEngine load
60001
Intake and exhaust gas Thermocouple (k−type);
temperature
Radix-SS316
Fuel mass flow rate

NO
NO2

Particulate matters

Flue gas analyzer;
Kane-KM9106

MinivolTM TAS; Airmetrics

18
Heat release analysis
 The first law of Thermodynamics is applied to control volume,

δ Qhr = dU + δ W + δ Qht .............................................................(1)

Where, δQhr is the heat released by combustion and δQht is the heat transfer
with the chamber walls
 dU and δW can be calculated by using following equations:
dU = mcv dT
mdT =
dU =

1
( pdV + Vdp )
R

{Q pV = mRT }

cv
( pdV + Vdp ) and δ W = pdV ................................................................(2)
R

 Substituting equation (2) into equation (1) with an incremental angle basis:

dQhr dQht cv  dV
dp 
dV
−
= p
+V
÷+ p
dθ
dθ
R  dθ
dθ 
dθ
dQhr dQht
γ
dV
1
dp
−
=
p
+
V
dθ
dθ
γ − 1 dθ γ − 1 dθ
dQnet
γ
dV
1
dp
Net heat release,
=
p
+
V
dθ
γ − 1 dθ γ − 1 dθ

19

180 brijesh

  • 1.
    Reactivity Controlled CompressionIgnition for Simultaneous Reduction of Emissions and Fuel Consumption in Diesel Engines Brijesh P., Chowdhury A., Sreedhara S. IC Engines and Combustion Laboratory Indian Institute of Technology Bombay, India
  • 2.
    Introduction  Diesel enginesare more popular over gasoline engines because of their higher efficiencies  Simultaneous reduction of NOx and PM becomes a major challenge  Significant reduction in NOx and PM was achieved with low temperature combustion (LTC) during our previous work*  However, PM and CO for optimized LTC run are still higher than the limit suggested in standards  In this work, experimental study has been carried out to achieve Reactivity Controlled Compression Ignition (RCCI) with liquefied petroleum gas (LPG)  LPG fuel with low reactivity was introduced into the intake manifold while diesel with high reactivity was injected into the cylinder  Effects of LPG on engine performance and emissions have also been studied Brijesh P., Chowdhury A., and Sreedhara S. “Effect of Ultra-Cooled EGR and Retarded Injection Timing on Low Temperature Combustion in CI Engines.” SAE Technical Paper 2013-01-0321, 2013, doi:10.4271/2013-01-0321. ∗ 2
  • 3.
    Experimental Test Rig LPG was introduced into the intake manifold through LPG nozzle (24 holes, 2 mm dia. of each hole) 3
  • 4.
    Testing Procedure  Allruns, as shown in table, were carried out by varying LPG percentage from 0 to 40% with a step size of 10  LPG fuel consumption was described as an equivalent of diesel fuel energy  LPG usage rate was calculated by using the Equation, LPG (%) = & (m & mLPG × LCVLPG LPG & × LCVLPG ) + ( mdiesel × LCVdiesel ) × 100  Run 1 was carried out at an optimized set of input parameters for this engine obtained through our previous work Run no. SOI, CAD aTDC EGR, % CR 1 −15 25 18 2 −10 25 18 3 −15 20 18 4 −15 25 16 4
  • 5.
    Testing Procedure (Contd.) Composition and physical properties of LPG was measured by using Gas Chromatograph with High Resolution Mass Spectrometer (GC-HRMS)  CHNS elemental analyser was used to measure percentage of carbon, hydrogen, nitrogen and sulphur in diesel  Reaction rates of LPG and diesel were calculated by using single step global mechanism of Westbrook and Dryer and found to be 5.53×10⁸ and 7.91×10⁸ gmol/cm3.s respectively Measured property of diesel Value Specific gravity @ 15oC 0.823 Lower calorific value, MJ/kg 41.23 o Measured property of LPG Value Density @ NTP, kg/m3 1.98 Lower calorific value, MJ/kg 46.48 Auto ignition temperature, oC 460 Viscosity @ 40 C, mm2/s 3.6 Ethane, vol.% 10.38 Auto ignition temperature , oC 210 Propene, vol.% 46.50 Butene, vol.% 21.27 i-Butane, vol.% 3.39 n-Butane, vol.% 17.31 i-Pentane, vol.% 0.24 n-Pentane, vol.% 0.91 Carbon, wt% 82.68 Hydrogen, wt% 13.83 Nitrogen, wt% 3.49 Sulphur, wt% 0 5
  • 6.
    Effect of LPGon PM and NOx Run no. EGR, % CR 1 −15 25 18 2  Reduction in PM was observed with increased LPG percentage SOI, CAD aTDC −10 25 18 3 −15 20 18 4 −15 25 16  Effect of LPG was observed significant in runs 1 and 3 compared to other runs  Minor changes in NOx were found for all runs with lower flow rates of LPG  However, NOx was reduced considerably with higher LPG percentage  Runs 1 and 2 were found most favourable for improved NOx-PM trade-off 6
  • 7.
    Effect of LPGon CO and HC Run no. EGR, % CR −15 25 18 2  CO was reduced significantly with the introduction of LPG fuel SOI, CAD aTDC 1 −10 25 18 3 −15 20 18 4 −15 25 16  Considerable reduction in CO was achieved till LPG is around 10%  Further reduction in CO was not observed with increasing percentage of LPG  A fraction of LPG-air mixture might have been trapped in crevices during the compression stroke  As a result, higher HC was observed with higher amount of LPG 7
  • 8.
    Effect of LPGon BTE Run no. SOI, CAD aTDC EGR, % CR 1 −15 25 18 2 −10 25 18 3 −15 20 18 4 −15 25 16  BTE was reduced with increased LPG percentage  Inducted LPG-air mixture traps in crevices during the compression stroke which in turn reduces BTE  Effect of LPG on HC and BTE was observed to be better for run 1. Hence, run 1 is found optimal  RCCI achieved with low LPG (∼10%) seems to be optimum for reduction of PM and 8
  • 9.
    Effect of LPGon Combustion Parameters Run no. EGR, % CR 1  The combustion phasing of run 1 seems to be optimum for SOI, CAD aTDC −15 25 18 2 −10 25 18 3 −15 20 18 4 −15 25 16 reduction of NOx and PM without altering BTE  The HRR traces of runs 2 and 3 are slightly shifted towards the compression stroke while run 4 is shifted much towards the expansion stroke as compared with run 1  Run 1 was chosen to study the effects of LPG on combustion parameters 9
  • 10.
    Effect of LPGon Combustion Parameters (Contd.) Run 1 SOI EGR 25% CR  -15 18 A reduction in premixed HRR peak and minor increase in ignition delays are observed with increased LPG  The presence of LPG slow down the chemical reaction rate during premixed combustion  Minor changes in ratio of premixed to diffusion combustion were observed with increased rate of LPG  As a result, wider and flatter HRR traces, improved LTC, were observed 10
  • 11.
    Effect of LPGon Combustion Parameters (Contd.) Run 1 SOI -15 EGR 25% CR 18  Similar to the HRR traces, in-cylinder pressure traces of run 1 with LPG were also shifted towards the expansion  The combustion phases were shifted because of increasing lower reactivity LPG fuel  Lower peak pressures were found with increasing LPG percentage, hence, reduction in BTE was observed 11
  • 12.
    Reduction of Emissionswith RCCI Operating run (Inj. timing, CR, EGR, LPG) BTE, % CO, g/kW.hr HC, g/kW.hr NOx, g/kW.hr PM, g/kW.hr Base run (−27, 18, 0 , 0) 26.61 0.68 0.30 19.43 0.58 Optimized LTC (−15, 18, 25, 0) 28.41 0.52 0.15 2.28 0.33 Optimized RCCI (−15, 18, 25, 10) 28.58 0.26 0.42 2.51 0.23 % Change (RCCI compared to base) 7.40 (↑) −61.76 (↓) 40.00 (↑) % Change (RCCI compared to LTC) 0.60 (↑) −50.00 (↓) 180.00 (↑) −87.10 (↓) −60.34 (↓) 10.10 (↓) −30.30 (↓)  RCCI with lower amount of LPG (10%) offers significant reduction in PM and CO with the acceptable values of HC, BTE and NOx 12
  • 13.
    Conclusions  Reactivity controlledcompression ignition (RCCI) achieved with low LPG (∼10%) found to be optimum for further reduction of PM and CO with the acceptable change in values of HC, NOx and BTE  Reduction in premixed HRR peak and minor increase in ignition delays were observed with increasing percentages of LPG  Improved LTC, flatter and wider HRR traces, were achieved with optimized RCCI  Reduction in PM, CO and NOx emissions were observed with increased LPG percentage  HC was increased and BTE was decreased with increasing amount of LPG 13
  • 14.
  • 15.
  • 16.
    Results of PreviousStudy  LTC, simultaneous reduction in NOx and PM, was achieved with the optimum operating parameters  Very low values of NOx and HC are achieved for the optimized run and are falling below the limits stated in standards  PM and CO for optimized run are still higher than the limit suggested in standards Bharat State emission standards 16
  • 17.
    Engine Specifications Engine type Four-stroke,water cooled, direct injection VCR engine Make Kirloskar Oil Engines Ltd. Number of cylinders 1 Compression ratio 18:1 to 12:1 Cylinder bore × stroke 87.5 mm × 110 mm Piston bowl shape Hemisphere Piston bowl diameter 52 mm Maximum power 3.5 kW @ 1500 rpm Inlet and exhaust valve diameter 34 mm Inlet valve opens −364.5 CAD aTDC Inlet valve closes −144.5 CAD aTDC Exhaust valve opens 144.5 CAD aTDC Exhaust valve closes 364.5 CAD aTDC Connecting rod length 234 mm Fuel injection pressure range 180 to 250 bar Fuel injection timing variation −27 to −7 CAD aTDC Number of nozzle holes 3 Nozzle hole diameter 0.288 mm Nozzle hole L/D ratio 2.78 17
  • 18.
    Specifications of MeasuringDevices Fuel line pressure Instrument; Make-Model Dynamic pressure transducer; PCB piezotronics-111A22 Operating range Uncertainty /Accuracy Relative error 0−345.5 bar ± 1% ± 1% Engine speed Encoder; Kubler-3700 0−6000 rpm ± 5 rpm ± 0.34 % 0−3.5 kg/hr ± 0.5 % ± 0.5 % 0−50 kg/hr ± 1% ± 1% 0−50 kg ± 0.075 kg ± 0.625 % 0−1200°C ± 1°C ± 0.34 % 0−5000 ppm ± 5% ± 5% 0−1000 ppm ± 5% ± 5% HC 0−2000 ppm ± 5% ± 5% CO 0−100000 ppm ± 5% ± 5% − ± 5% ± 5% Measured parameters In-cylinder pressure DP Transmitter; Yokogawa-EJA110A Air and EGR mass flow Pressure transmitter; rate Wika-SL1 Load cell; SensortronicsEngine load 60001 Intake and exhaust gas Thermocouple (k−type); temperature Radix-SS316 Fuel mass flow rate NO NO2 Particulate matters Flue gas analyzer; Kane-KM9106 MinivolTM TAS; Airmetrics 18
  • 19.
    Heat release analysis The first law of Thermodynamics is applied to control volume, δ Qhr = dU + δ W + δ Qht .............................................................(1) Where, δQhr is the heat released by combustion and δQht is the heat transfer with the chamber walls  dU and δW can be calculated by using following equations: dU = mcv dT mdT = dU = 1 ( pdV + Vdp ) R {Q pV = mRT } cv ( pdV + Vdp ) and δ W = pdV ................................................................(2) R  Substituting equation (2) into equation (1) with an incremental angle basis: dQhr dQht cv  dV dp  dV − = p +V ÷+ p dθ dθ R  dθ dθ  dθ dQhr dQht γ dV 1 dp − = p + V dθ dθ γ − 1 dθ γ − 1 dθ dQnet γ dV 1 dp Net heat release, = p + V dθ γ − 1 dθ γ − 1 dθ 19