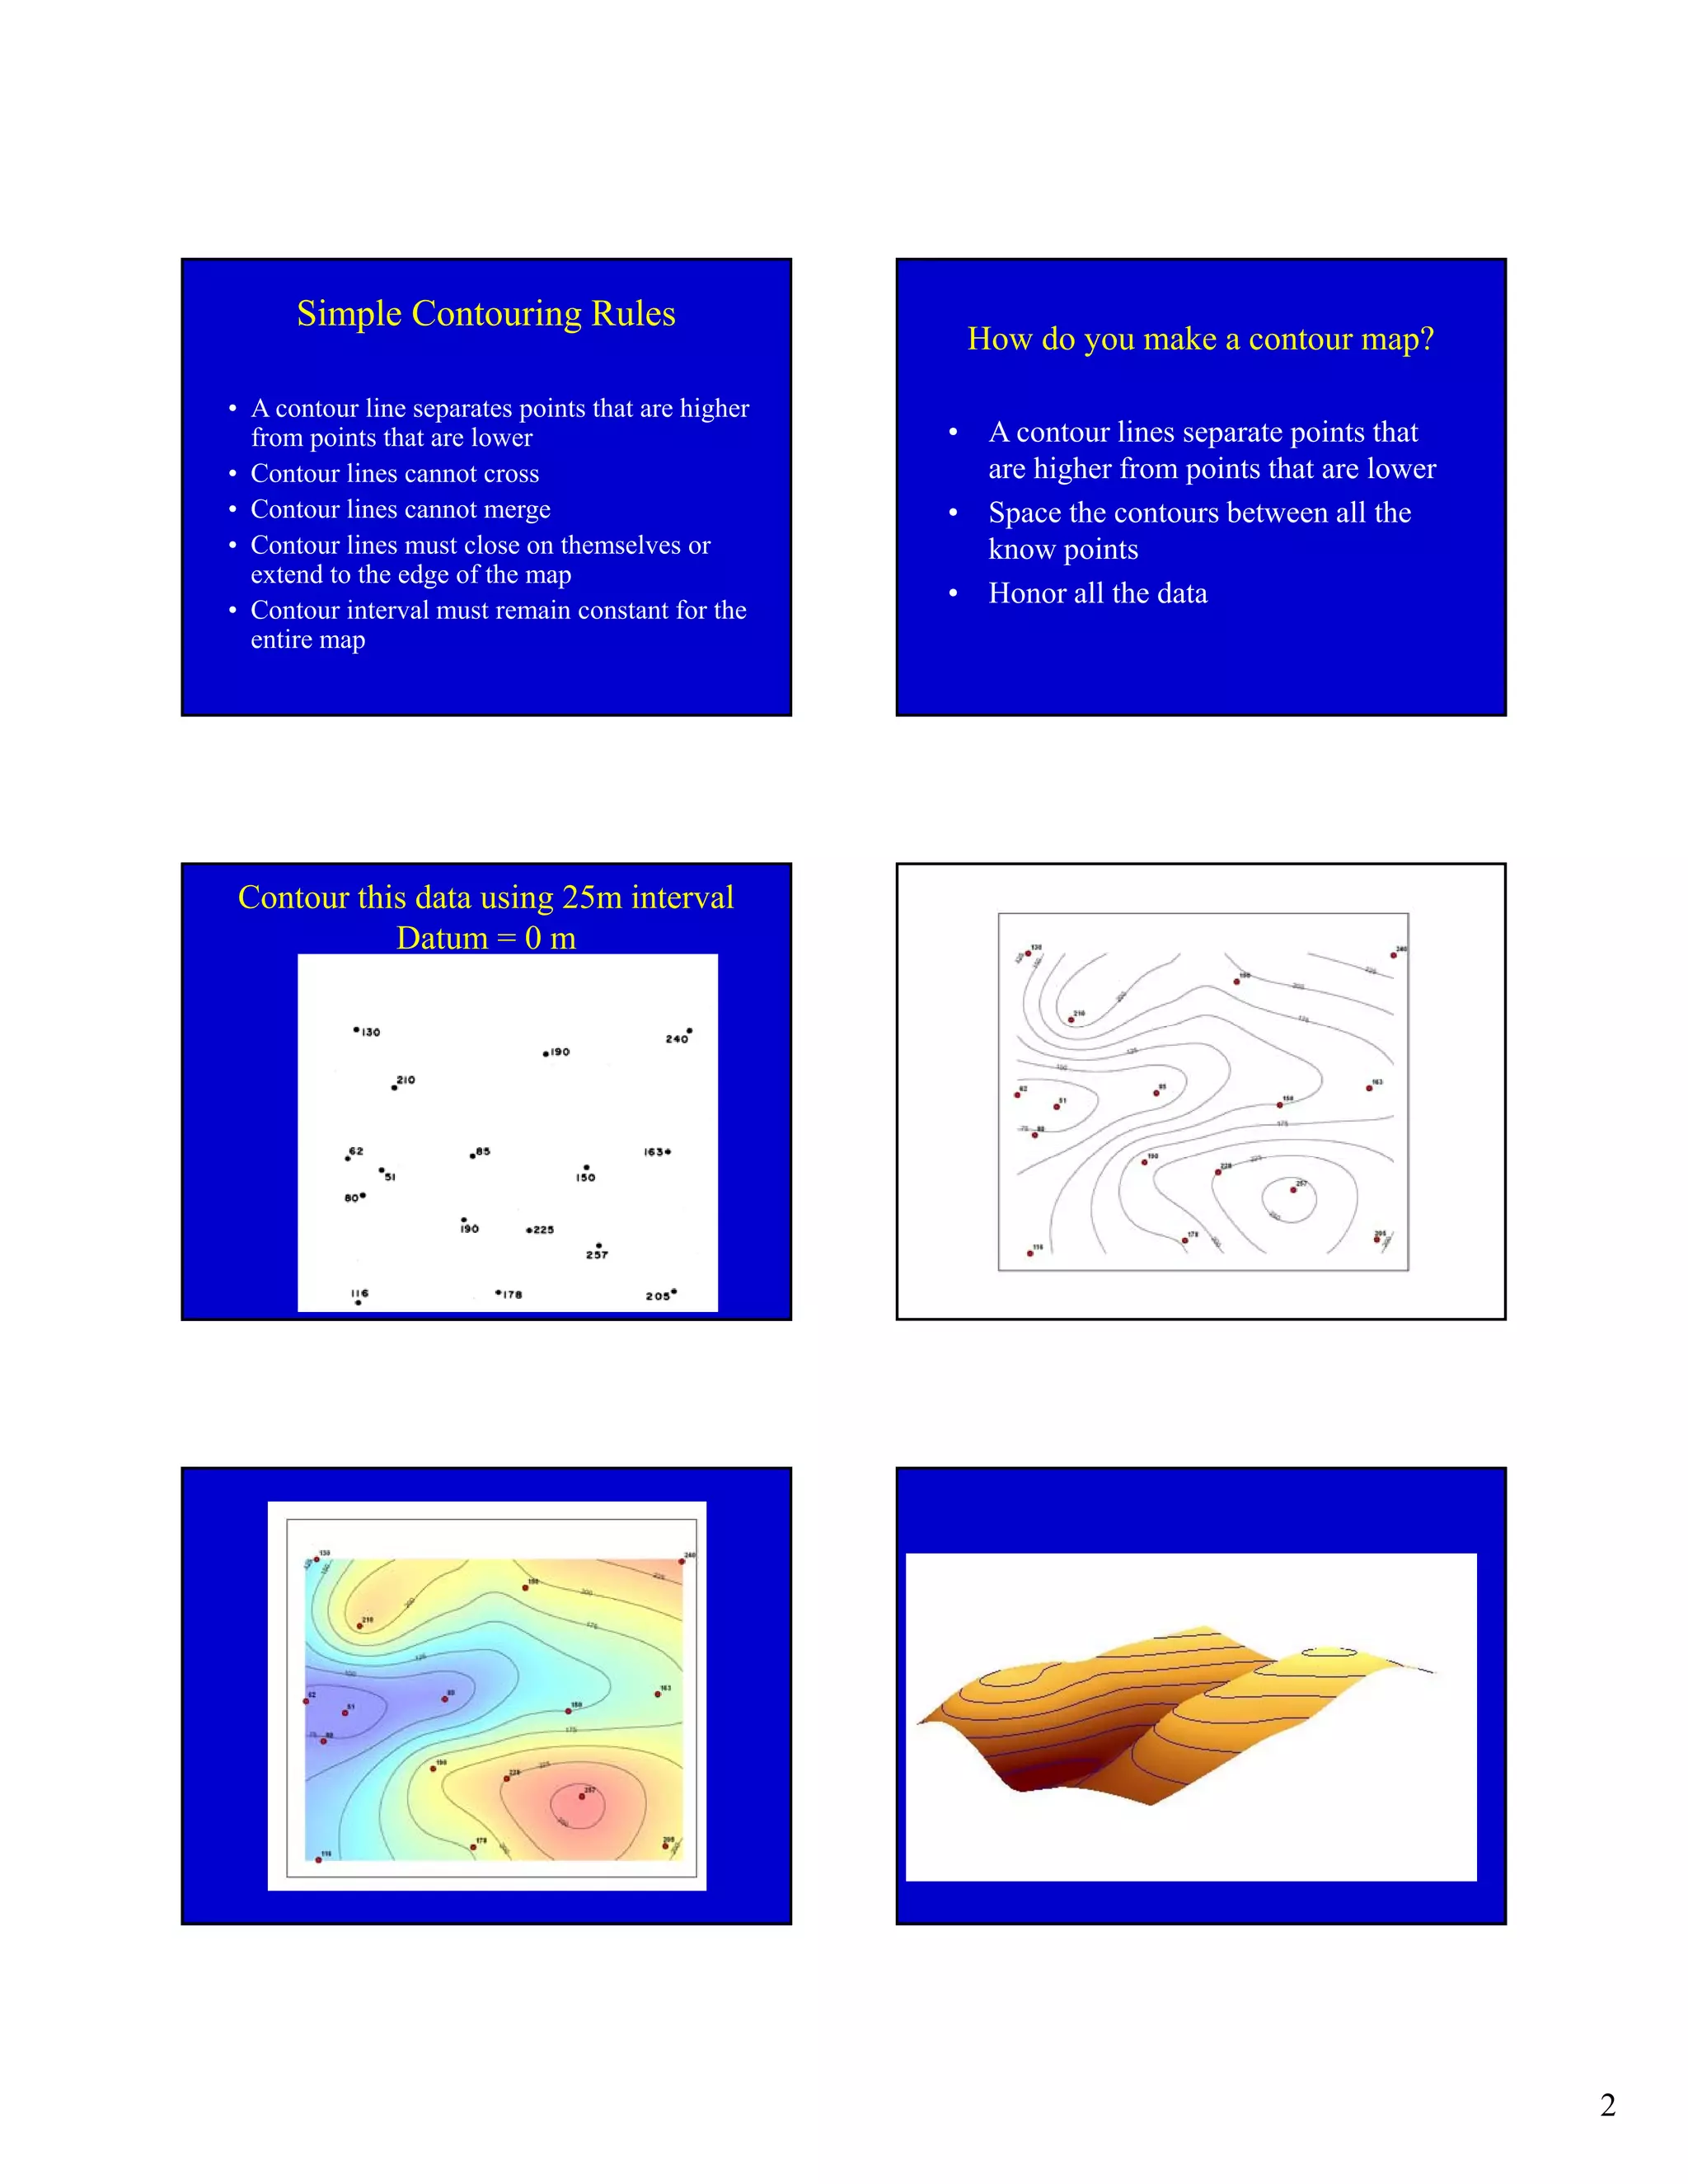
1
Geol 493
Subsurface Mapping
Representing a 3D surface on a map
Movie
The arrow points at …
A. A ridge.
B. A valley.
What is a contour line?
Describe
this
surface
2
Simple Contouring Rules
• A contour line separates points that are higher
from points that are lower
• Contour lines cannot cross
• Contour lines cannot merge
• Contour lines must close on themselves or
extend to the edge of the map
• Contour interval must remain constant for the
entire map
How do you make a contour map?
• A contour lines separate points that
are higher from points that are lower
• Space the contours between all the
know points
• Honor all the data
Contour this data using 25m interval
Datum = 0 m
3
10m contour spacing
Problem: How to interpolate
between the known points?
100
125
150
175
15
Triangulation
16
Gridding
Methods of interpolation
• Least squares
• Tangential
• Spline
• Weighted average
• Minimum curvature
• Polynomial
• Hyperbolic
• Kriging
• Trend surface
• Etc., etc., etc.!
a. Inverse distance
b. Kriging
c. Minimum
curvature
d. Triangulation
e. Polynomial
regressiona.
c.
b.
e.d.
4
Advantages of Computer Contouring
• Fast
• Objective and unbiased
• Easily updated
• Ready for later processing
• Only practical way if you have 1000s of data
points
Advantages of Hand Contouring
• Allows you to impart your geologic
knowledge to the interpretation
Depth Structure Maps
Sea level
132 (132)
511 (502) -362
530 (525) -385
362
(356)
-211
Land surface
Cross Sectional View
Well 1
Well 2 Well 4
Well 3
Well 5
•Log Depth
•(True Vertical Depth)
•Subsea Depth
Dealing with multiple layers
•Isopach maps
•Plot the elevation difference between two maps
Mississippian Top PennsylvanianTop
1800
1800
1700
5
Pennsylvanian-Mississippian Isopach
500
600
300
400
800
700
Pennsylvanian plus Isopach
Which well would encounter the thickest
sand?
Isopach
Map
What about Unconformities?
Cross section
-8000
-8200
-7800
NESW
A
Unconformity Surface Map Top of Layer A
6
Base of Layer A Isopach of Layer A
25
25
50
What about mapping other parameters?
• Extensive Surfaces:
– Tops and Bottoms of formations
– Isopachs
– Fault surfaces
– Fluid contacts, i.e. Gas-Oil, Water-Oil
• Intensive Surfaces:
– Porosity
– Fluid Saturation
– Production
• Black contours are
structure
• Colors are porosity
• Circles are production
Michigan
Michigan Tech
Porosity map from reservoir
model
Gaspar et al. 2013
Mapping faults
7
Contouring Faulted Surfaces
• Faults break the continuity of a surface
Describe the Structure
Faulted surfaces
Normal Fault- North Sea
Virtual Seismic Atlas
Making a map of a faulted structure
1. Contour the surface without faults
2. Contour the fault plane
3. Find the intersection of the two maps
4. Correct the contours for the vertical
separation across the fault
5. Clean up
8
Faulted structure contour map
3
2
14
1
Faults from well data
• A normal
fault can
remove a
piece of the
stratigraphy
in a well
• Missing
section is a
indicates
faulting
Cross SectionNW SE
Reverse Faults- cross section
Reverse Faulting Example UNION OOLITE THRUST MODEL WITH FRACTURE SWARM
(after Nelson, 2001)
no scale
UNION OOLITE
9
DEPI #5639 (047-055-00226) Gamma Ray log
UNION OOLITE
(Hanging wall)
UNION OOLITE
(Foot wall)
100’
PILOT KNOB
THRUST FAULT
228’ vertical displacement
Thrust faults cause
repetitions in the
stratigraphy
Cross-section A - A’
A A’
0
-500
-1000
-1500
PILOT KNOB
ARISTA
NW SE
Scale:
500’
500’
UNION
PICKAWAY
DENMAR
LITTLE
LIME
PRICE
Where is the
highest point in the
structure in this
depth map?
A.
B.
C.
D.
E.
AD
C
B
E

18 subsurfacemapping

  • 1.
    1 Geol 493 Subsurface Mapping Representinga 3D surface on a map Movie The arrow points at … A. A ridge. B. A valley. What is a contour line? Describe this surface
  • 2.
    2 Simple Contouring Rules •A contour line separates points that are higher from points that are lower • Contour lines cannot cross • Contour lines cannot merge • Contour lines must close on themselves or extend to the edge of the map • Contour interval must remain constant for the entire map How do you make a contour map? • A contour lines separate points that are higher from points that are lower • Space the contours between all the know points • Honor all the data Contour this data using 25m interval Datum = 0 m
  • 3.
    3 10m contour spacing Problem:How to interpolate between the known points? 100 125 150 175 15 Triangulation 16 Gridding Methods of interpolation • Least squares • Tangential • Spline • Weighted average • Minimum curvature • Polynomial • Hyperbolic • Kriging • Trend surface • Etc., etc., etc.! a. Inverse distance b. Kriging c. Minimum curvature d. Triangulation e. Polynomial regressiona. c. b. e.d.
  • 4.
    4 Advantages of ComputerContouring • Fast • Objective and unbiased • Easily updated • Ready for later processing • Only practical way if you have 1000s of data points Advantages of Hand Contouring • Allows you to impart your geologic knowledge to the interpretation Depth Structure Maps Sea level 132 (132) 511 (502) -362 530 (525) -385 362 (356) -211 Land surface Cross Sectional View Well 1 Well 2 Well 4 Well 3 Well 5 •Log Depth •(True Vertical Depth) •Subsea Depth Dealing with multiple layers •Isopach maps •Plot the elevation difference between two maps Mississippian Top PennsylvanianTop 1800 1800 1700
  • 5.
    5 Pennsylvanian-Mississippian Isopach 500 600 300 400 800 700 Pennsylvanian plusIsopach Which well would encounter the thickest sand? Isopach Map What about Unconformities? Cross section -8000 -8200 -7800 NESW A Unconformity Surface Map Top of Layer A
  • 6.
    6 Base of LayerA Isopach of Layer A 25 25 50 What about mapping other parameters? • Extensive Surfaces: – Tops and Bottoms of formations – Isopachs – Fault surfaces – Fluid contacts, i.e. Gas-Oil, Water-Oil • Intensive Surfaces: – Porosity – Fluid Saturation – Production • Black contours are structure • Colors are porosity • Circles are production Michigan Michigan Tech Porosity map from reservoir model Gaspar et al. 2013 Mapping faults
  • 7.
    7 Contouring Faulted Surfaces •Faults break the continuity of a surface Describe the Structure Faulted surfaces Normal Fault- North Sea Virtual Seismic Atlas Making a map of a faulted structure 1. Contour the surface without faults 2. Contour the fault plane 3. Find the intersection of the two maps 4. Correct the contours for the vertical separation across the fault 5. Clean up
  • 8.
    8 Faulted structure contourmap 3 2 14 1 Faults from well data • A normal fault can remove a piece of the stratigraphy in a well • Missing section is a indicates faulting Cross SectionNW SE Reverse Faults- cross section Reverse Faulting Example UNION OOLITE THRUST MODEL WITH FRACTURE SWARM (after Nelson, 2001) no scale UNION OOLITE
  • 9.
    9 DEPI #5639 (047-055-00226)Gamma Ray log UNION OOLITE (Hanging wall) UNION OOLITE (Foot wall) 100’ PILOT KNOB THRUST FAULT 228’ vertical displacement Thrust faults cause repetitions in the stratigraphy Cross-section A - A’ A A’ 0 -500 -1000 -1500 PILOT KNOB ARISTA NW SE Scale: 500’ 500’ UNION PICKAWAY DENMAR LITTLE LIME PRICE Where is the highest point in the structure in this depth map? A. B. C. D. E. AD C B E