Download to read offline

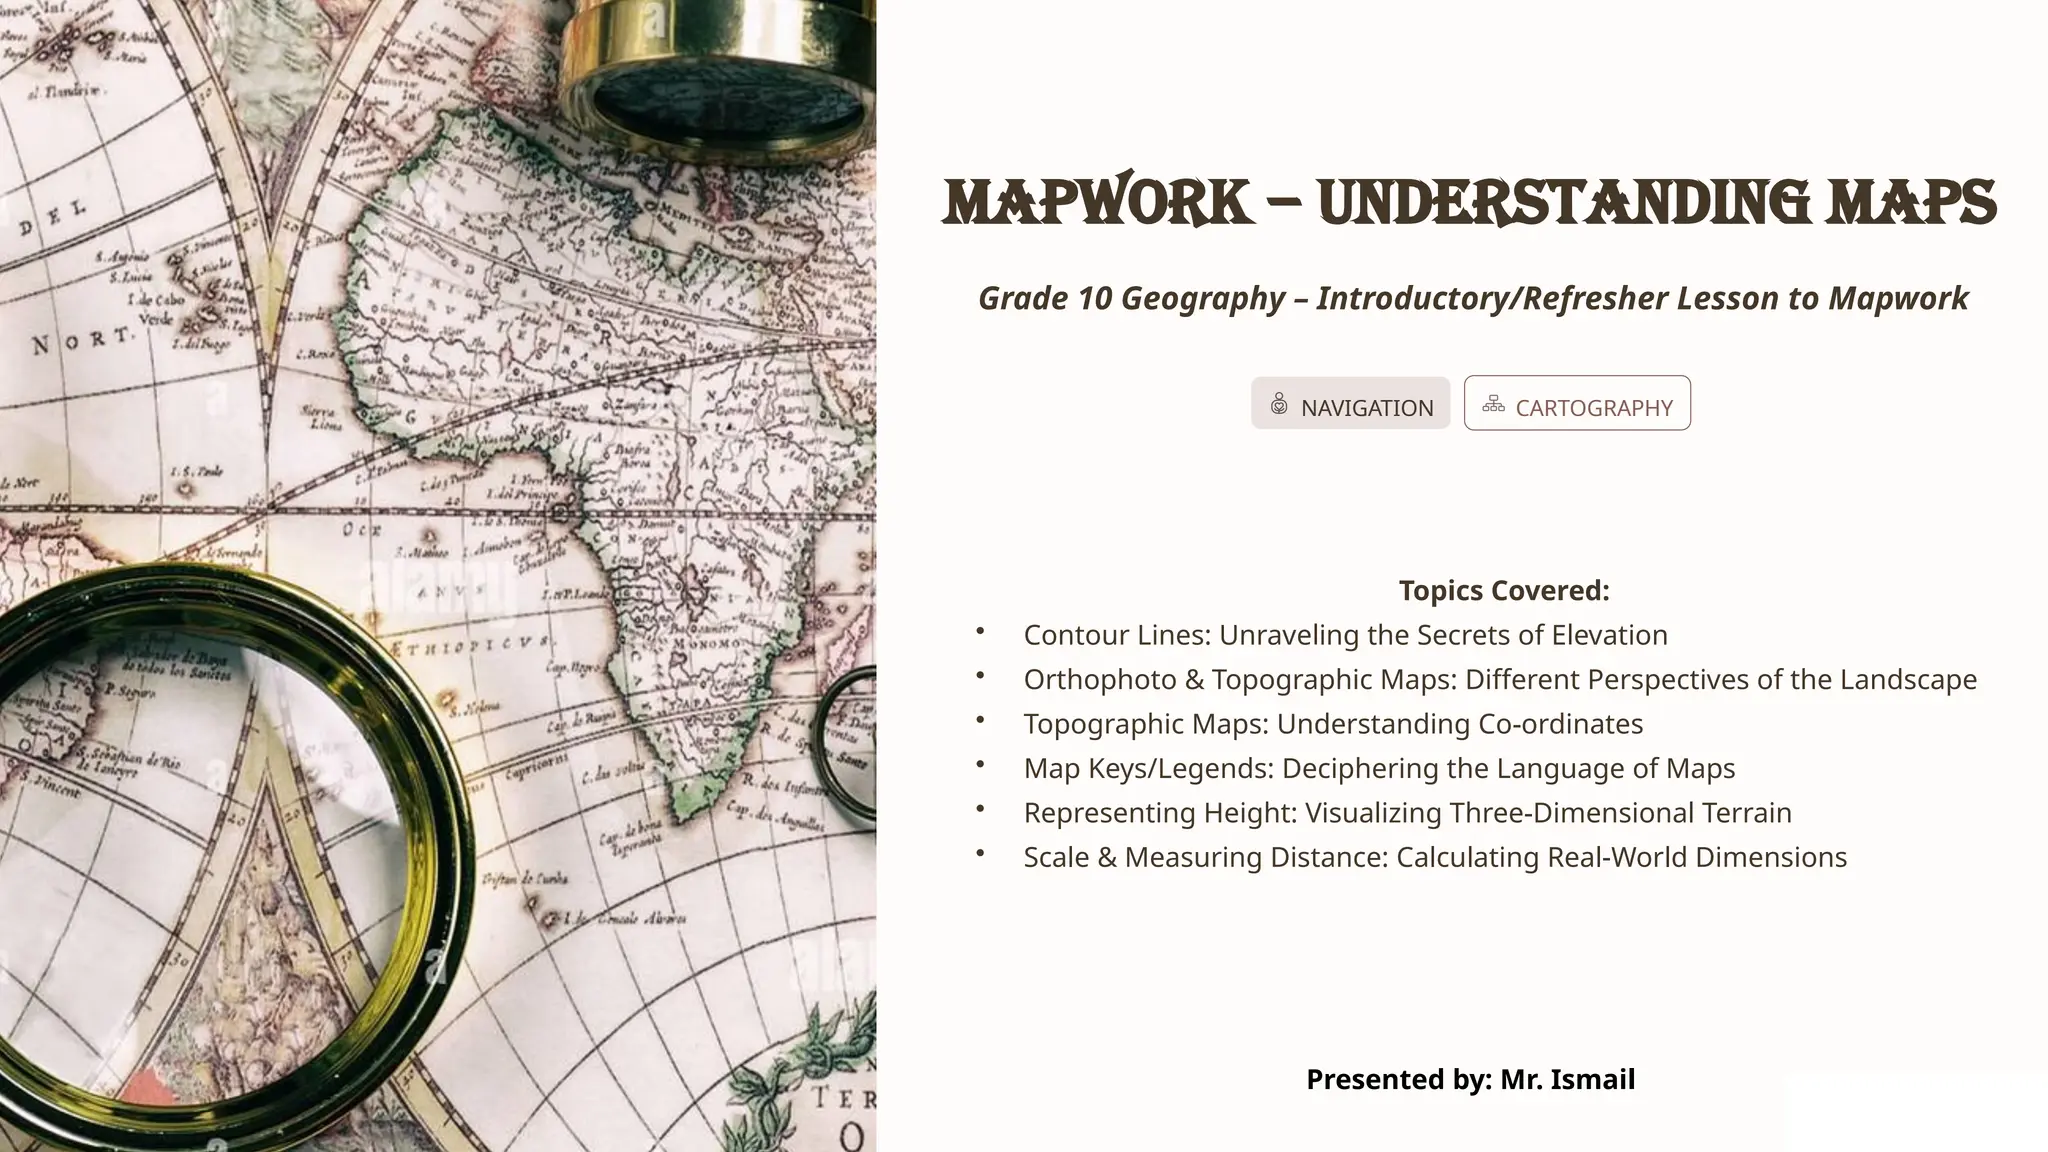
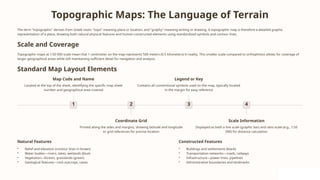
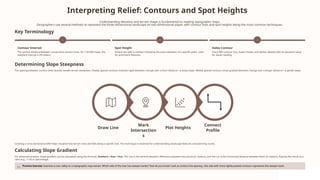

This PowerPoint presentation delivers an introduction/refresher to the Mapwork curriculum for Grade 10 Geography, fully aligned to the CAPS ATP. Learners master three core skills: locating exact position using coordinates, calculating magnetic bearings, and interpreting contour patterns to identify landforms such as valleys, spurs, and hills. The presentation moves progressively from foundational knowledge to integrated application, culminating in a problem-solving scenario where learners evaluate routes and justify decisions using map evidence. Designed with clear visuals, worked examples, and guided practice, this resource builds the essential toolkit learners need before advancing to FET geography. Suitable for classroom instruction, online learning, or revision.