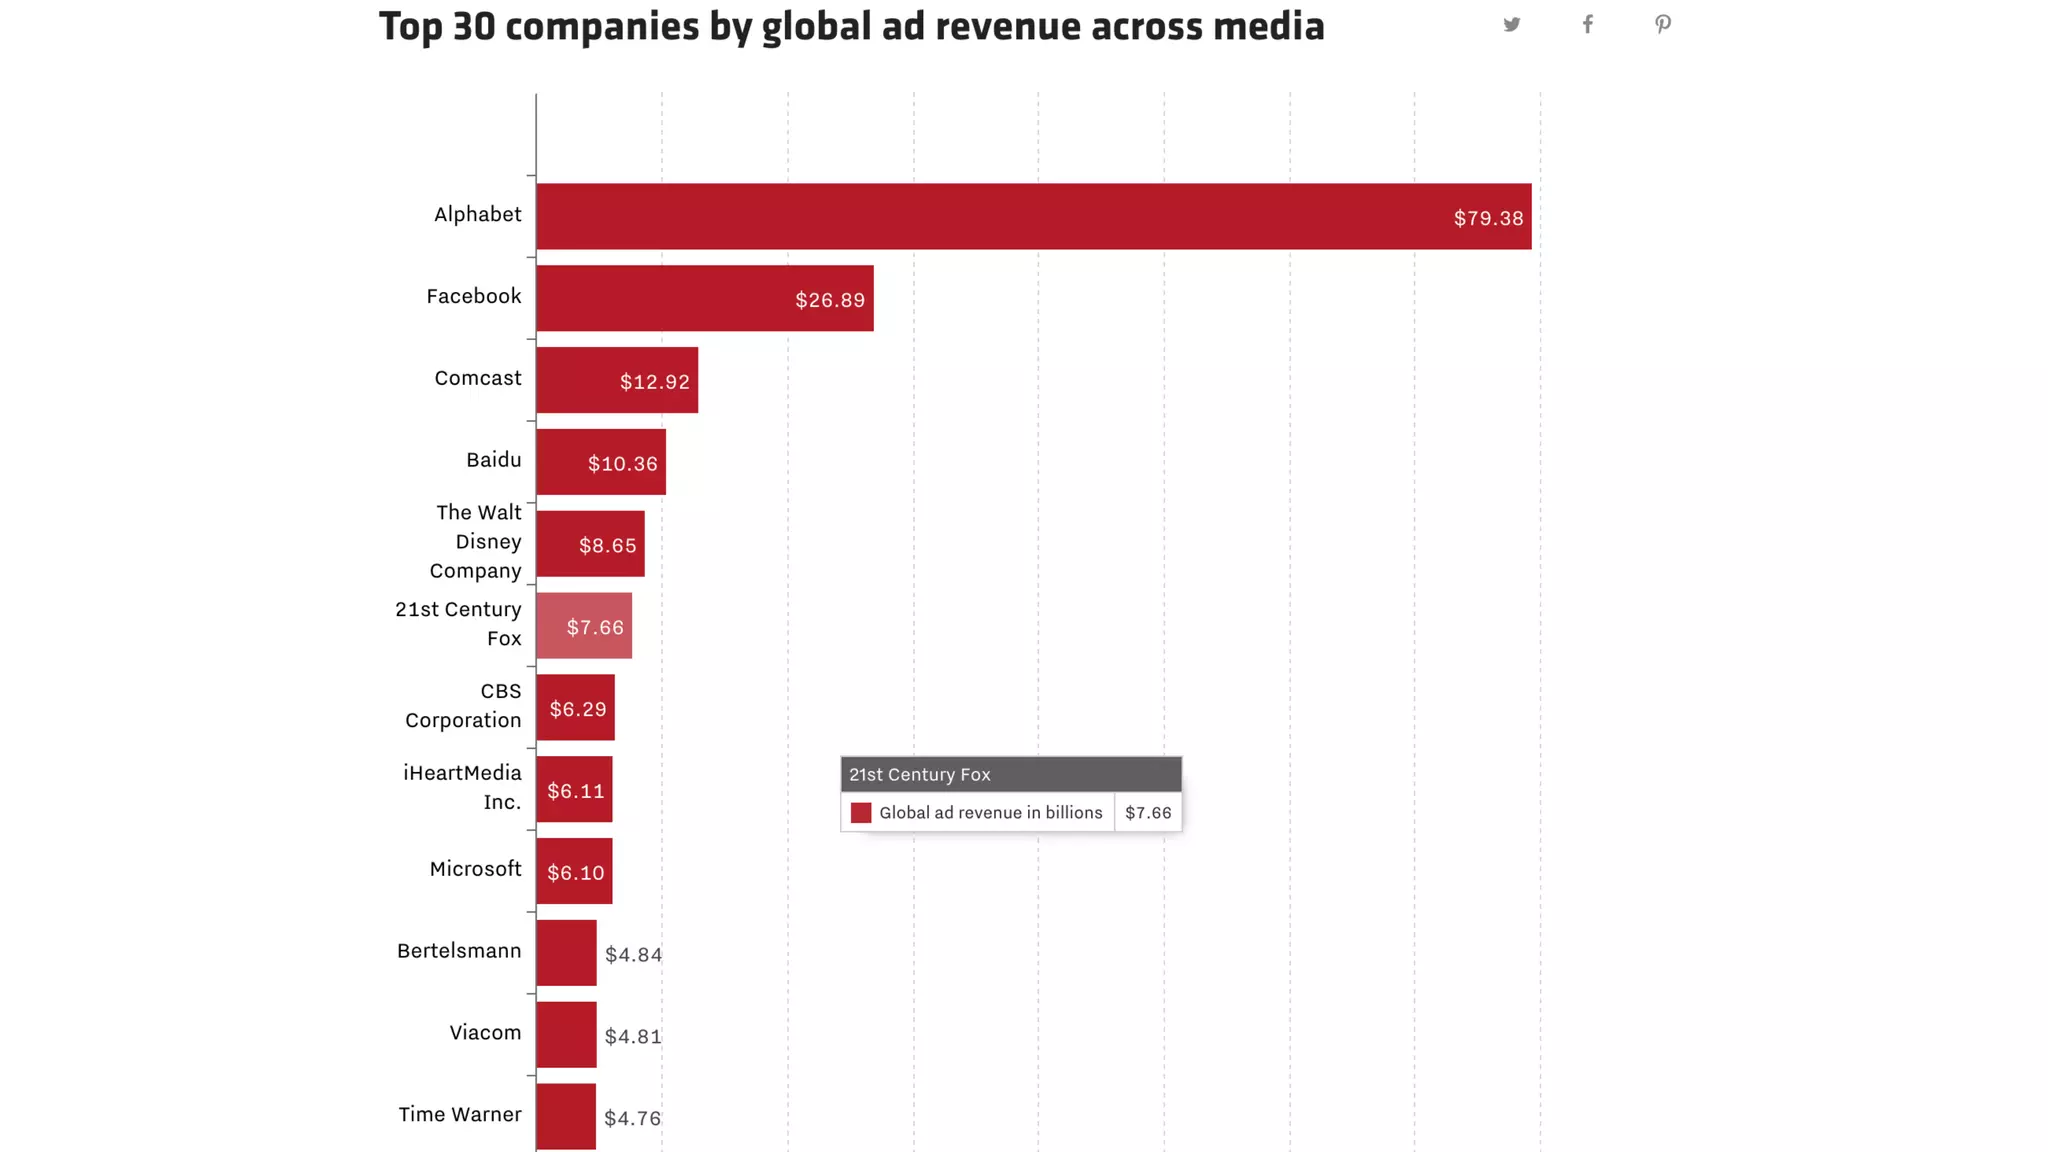
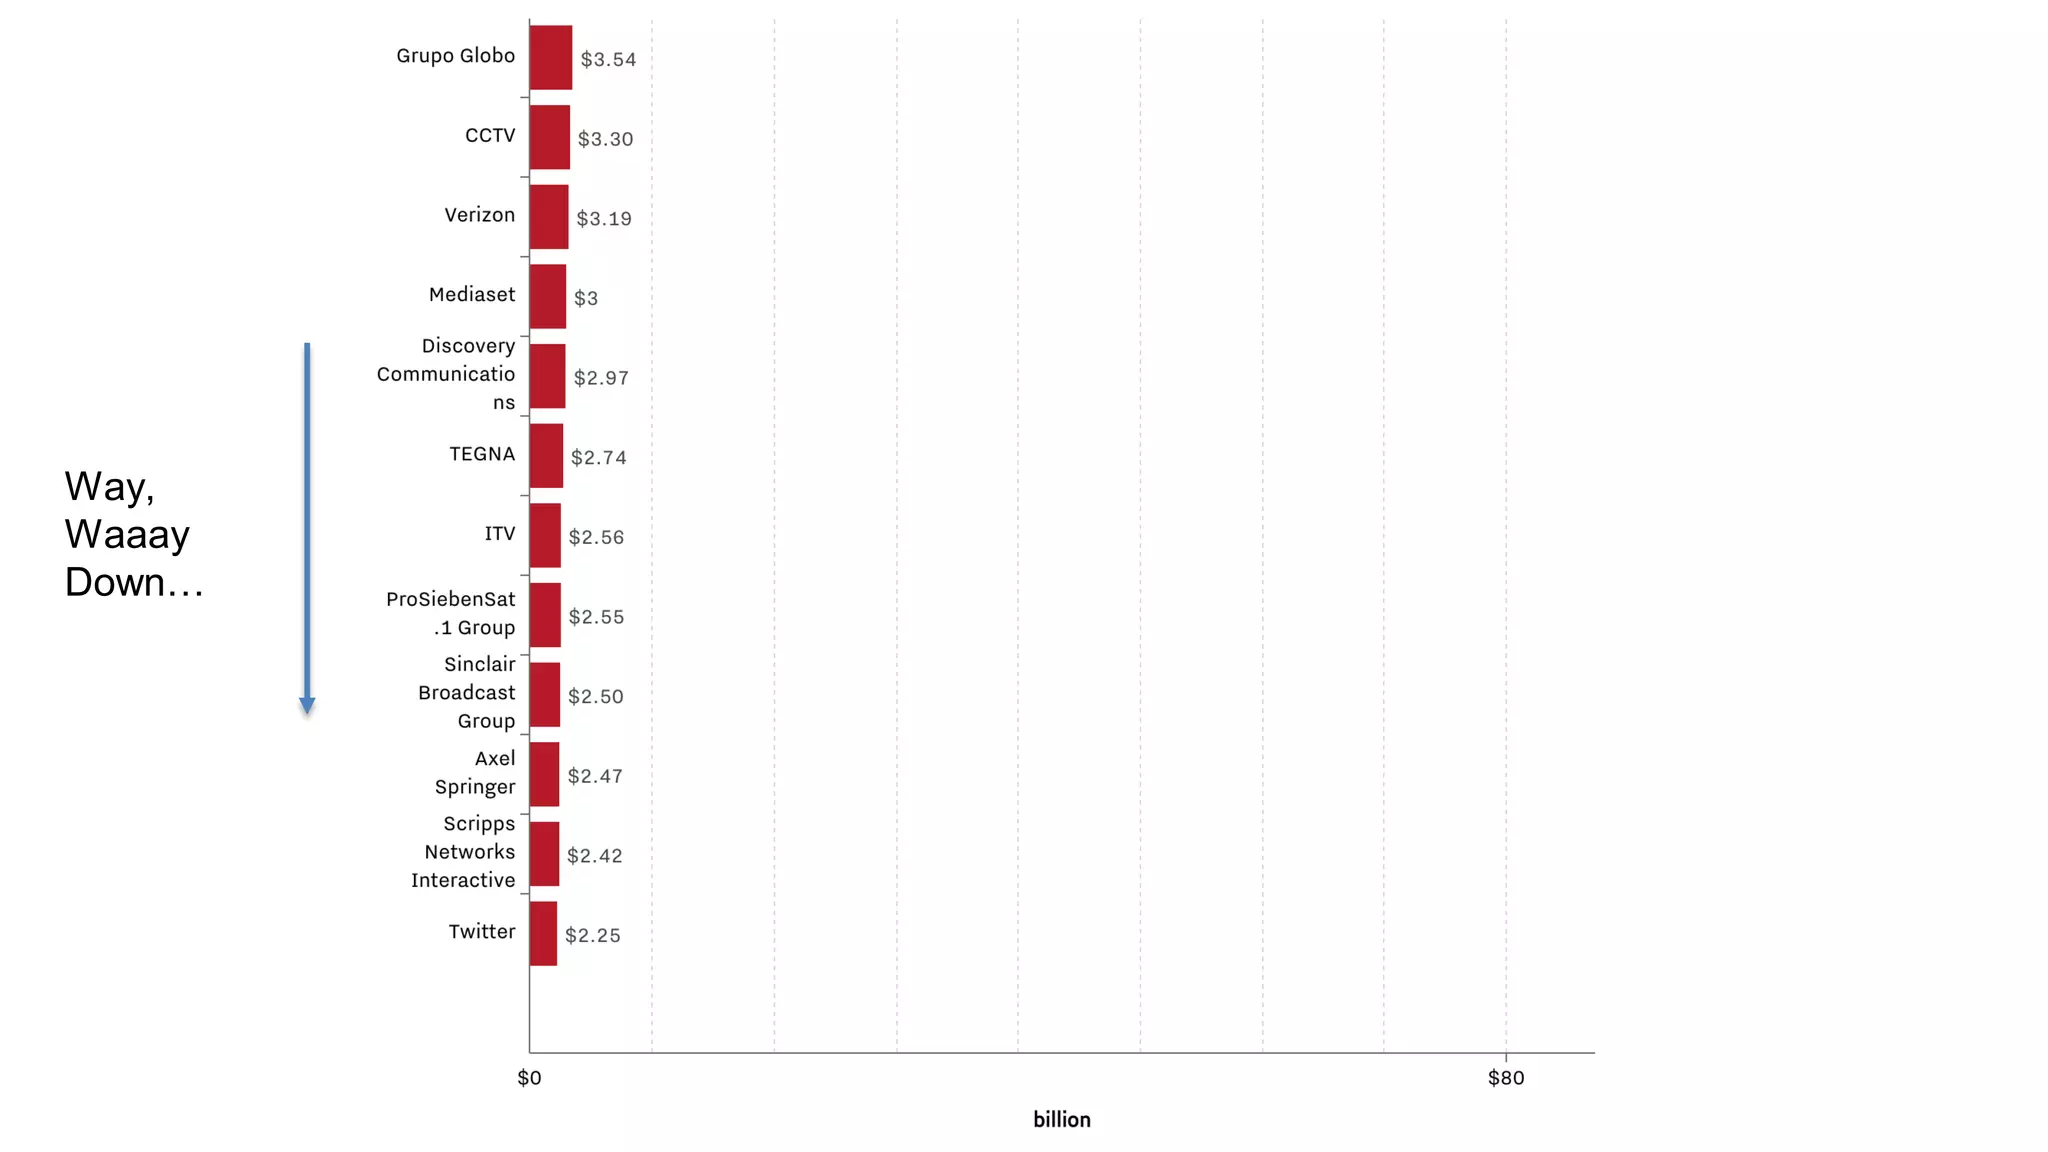
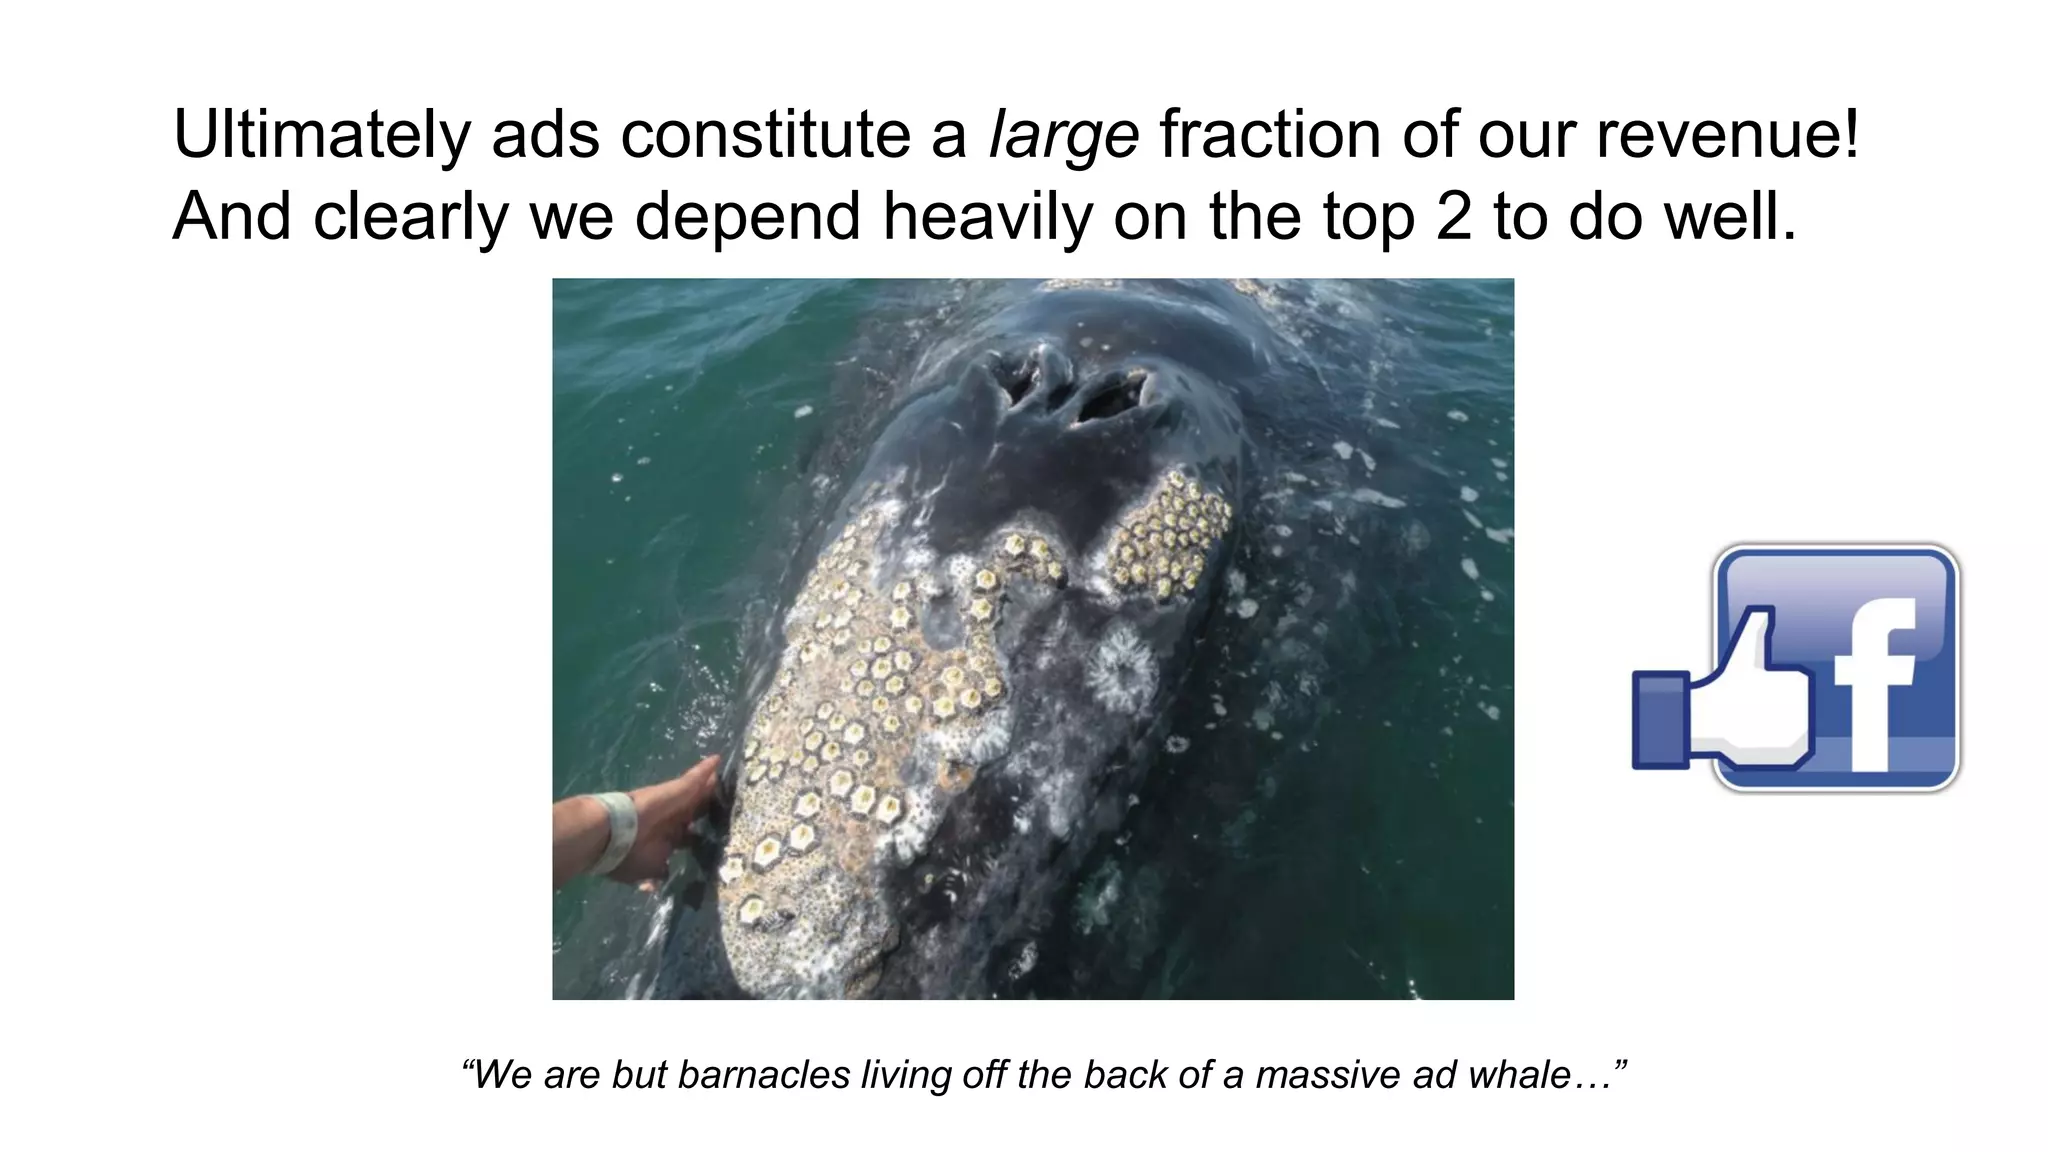
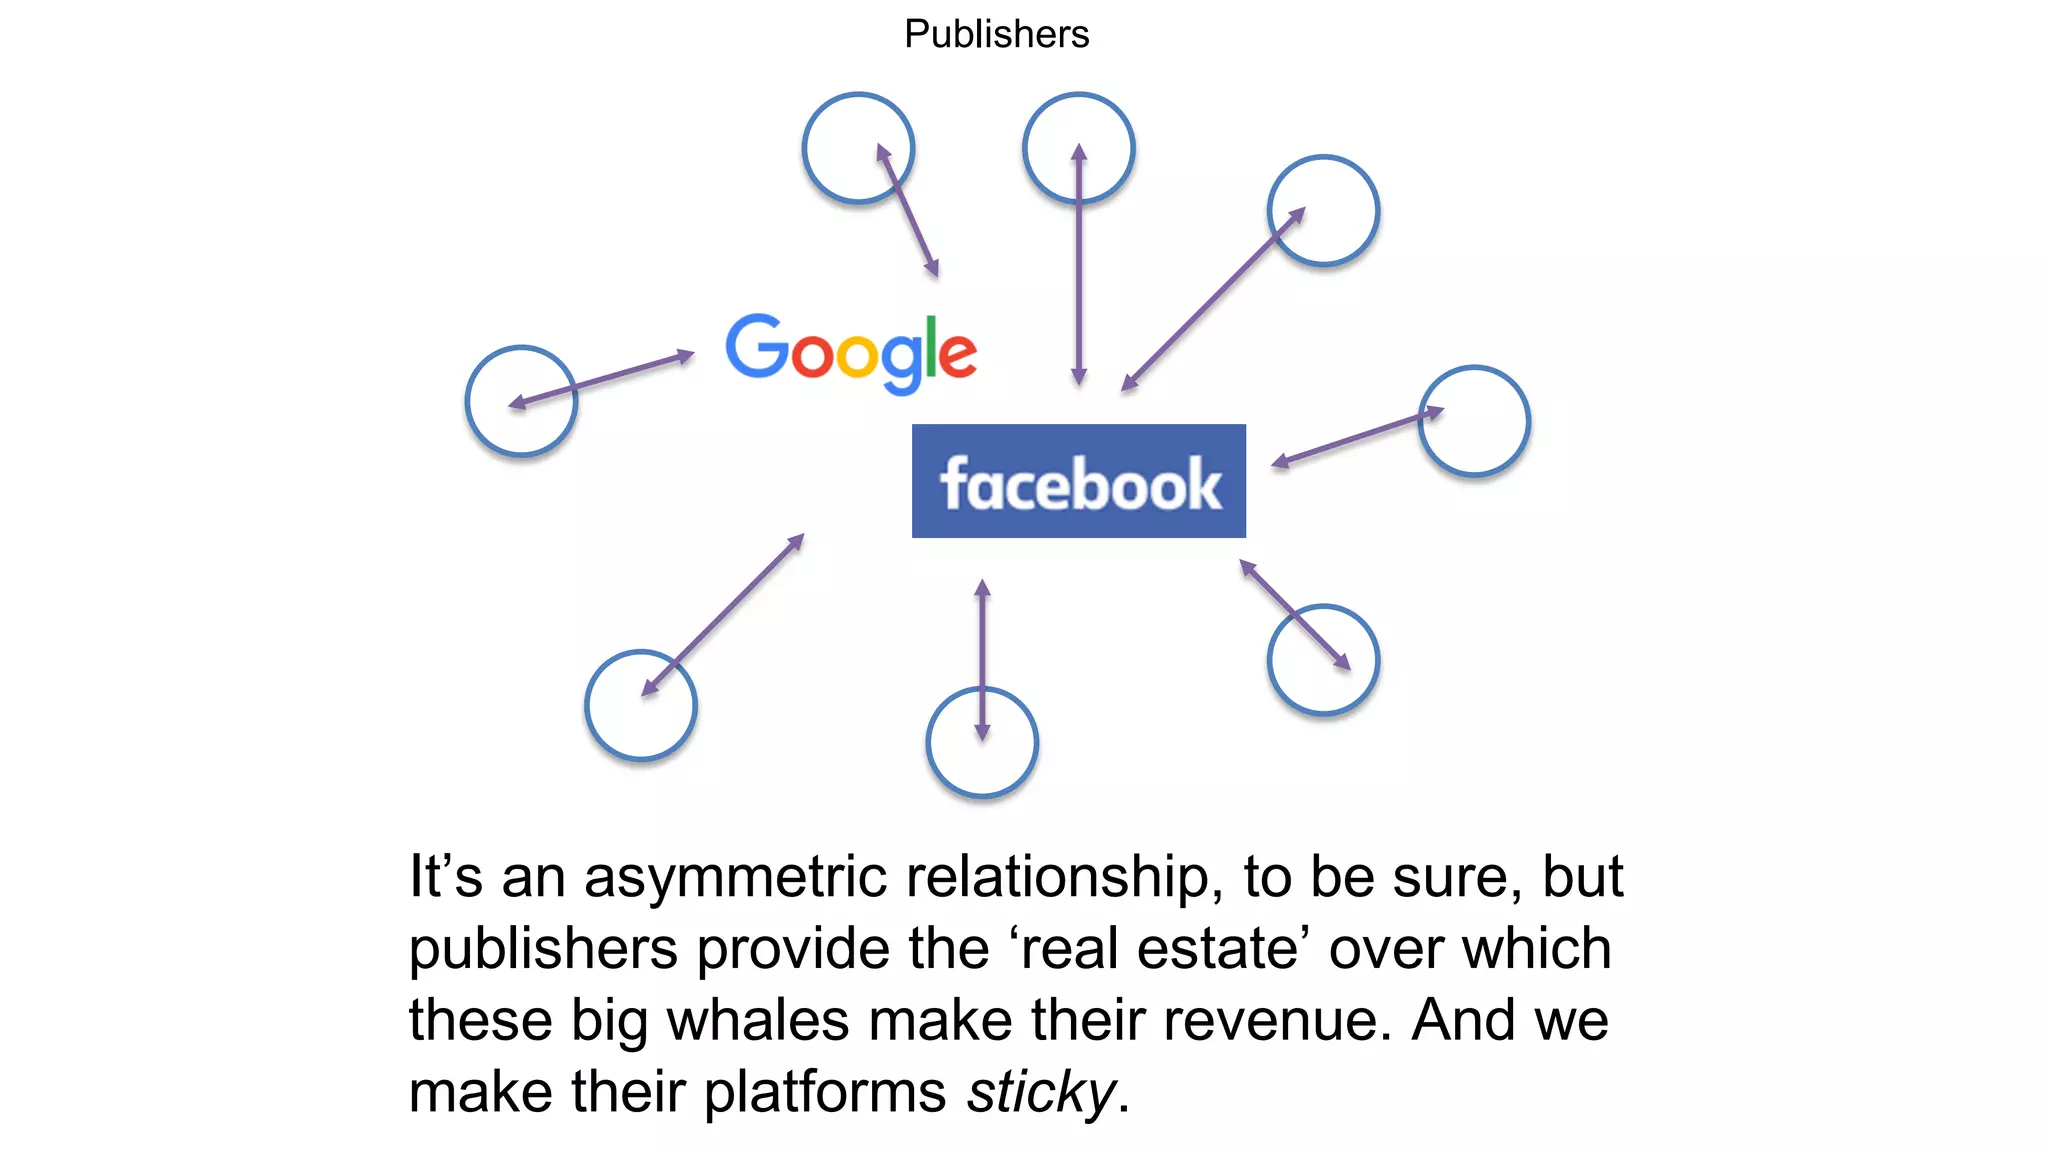
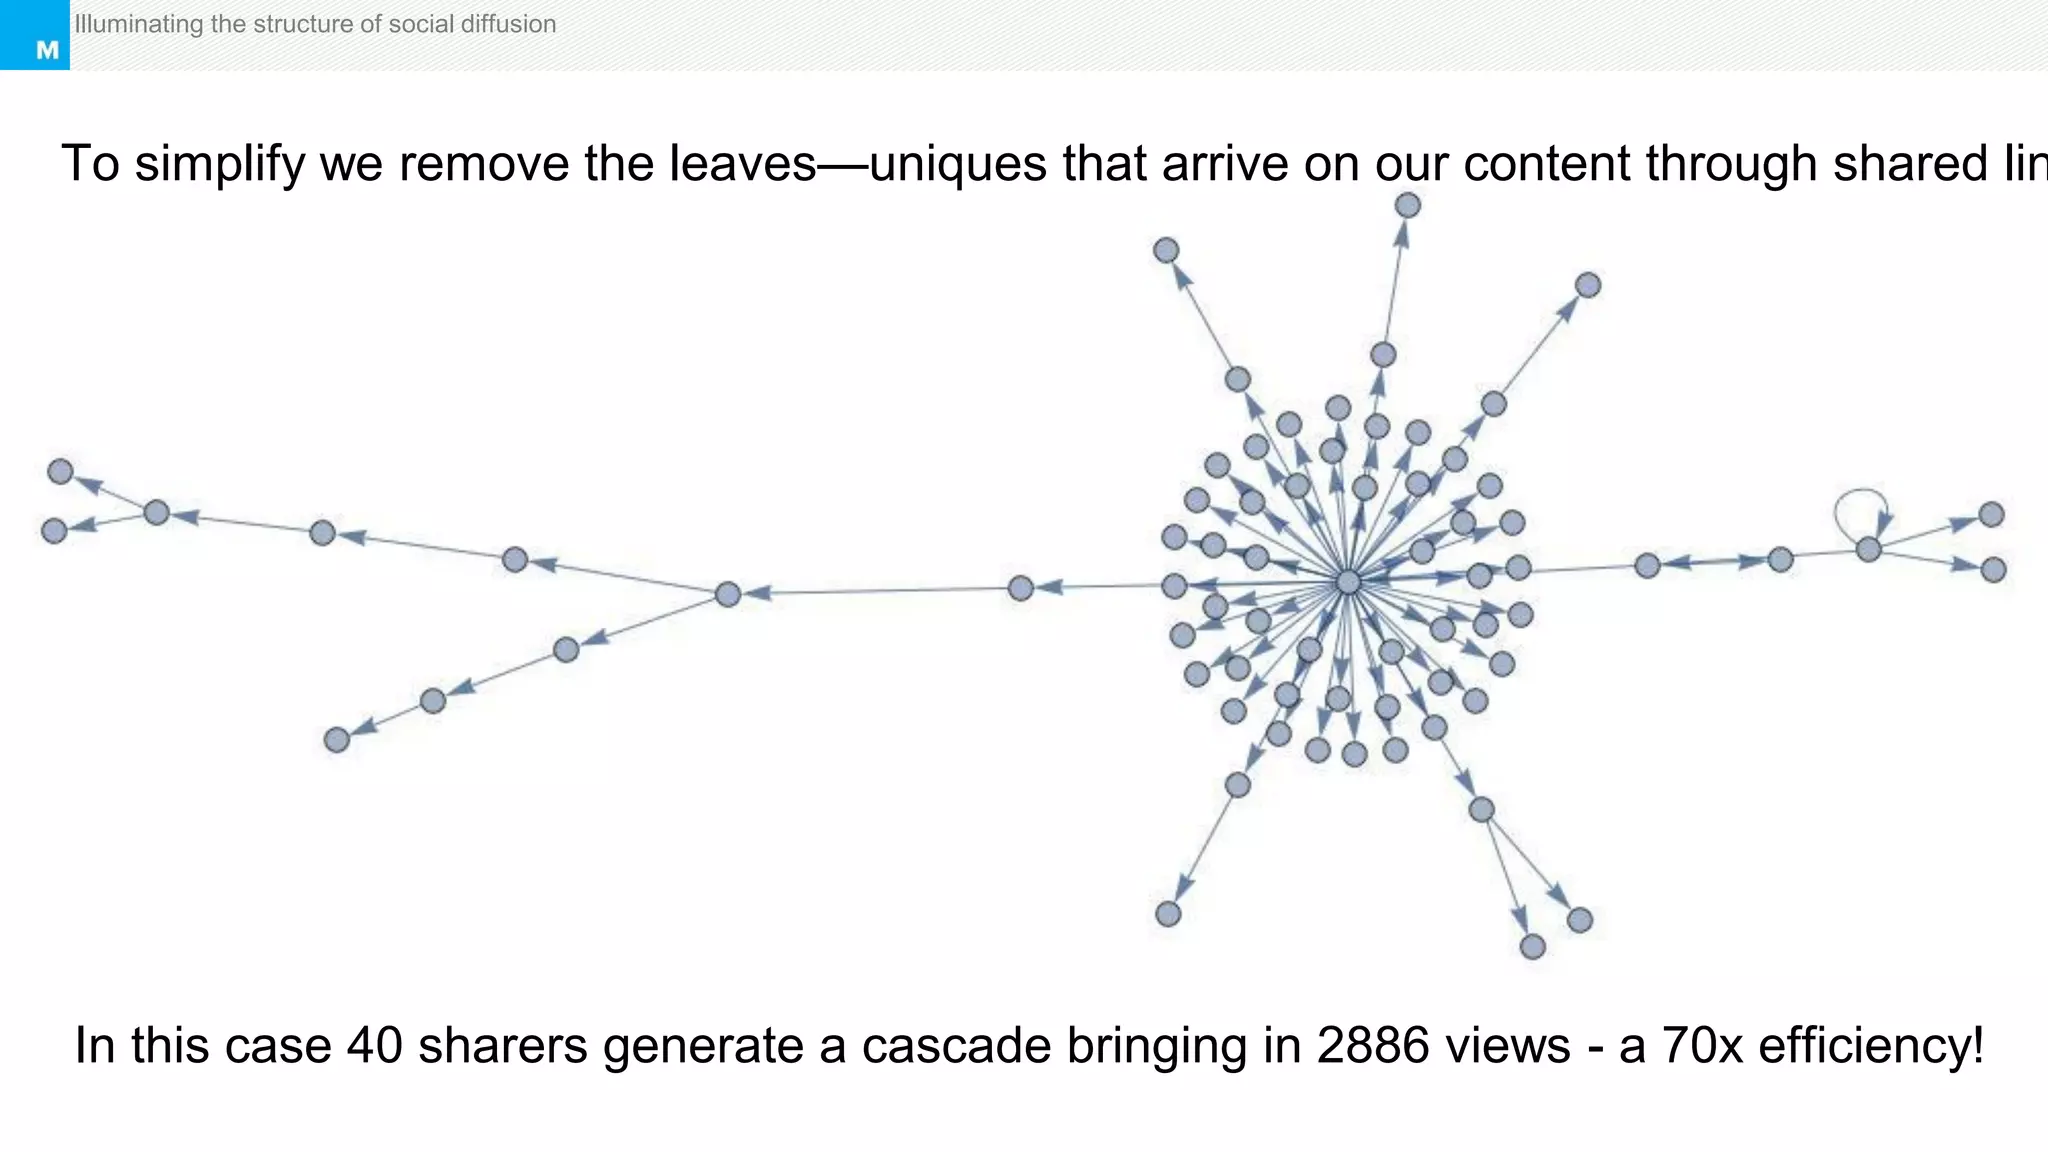
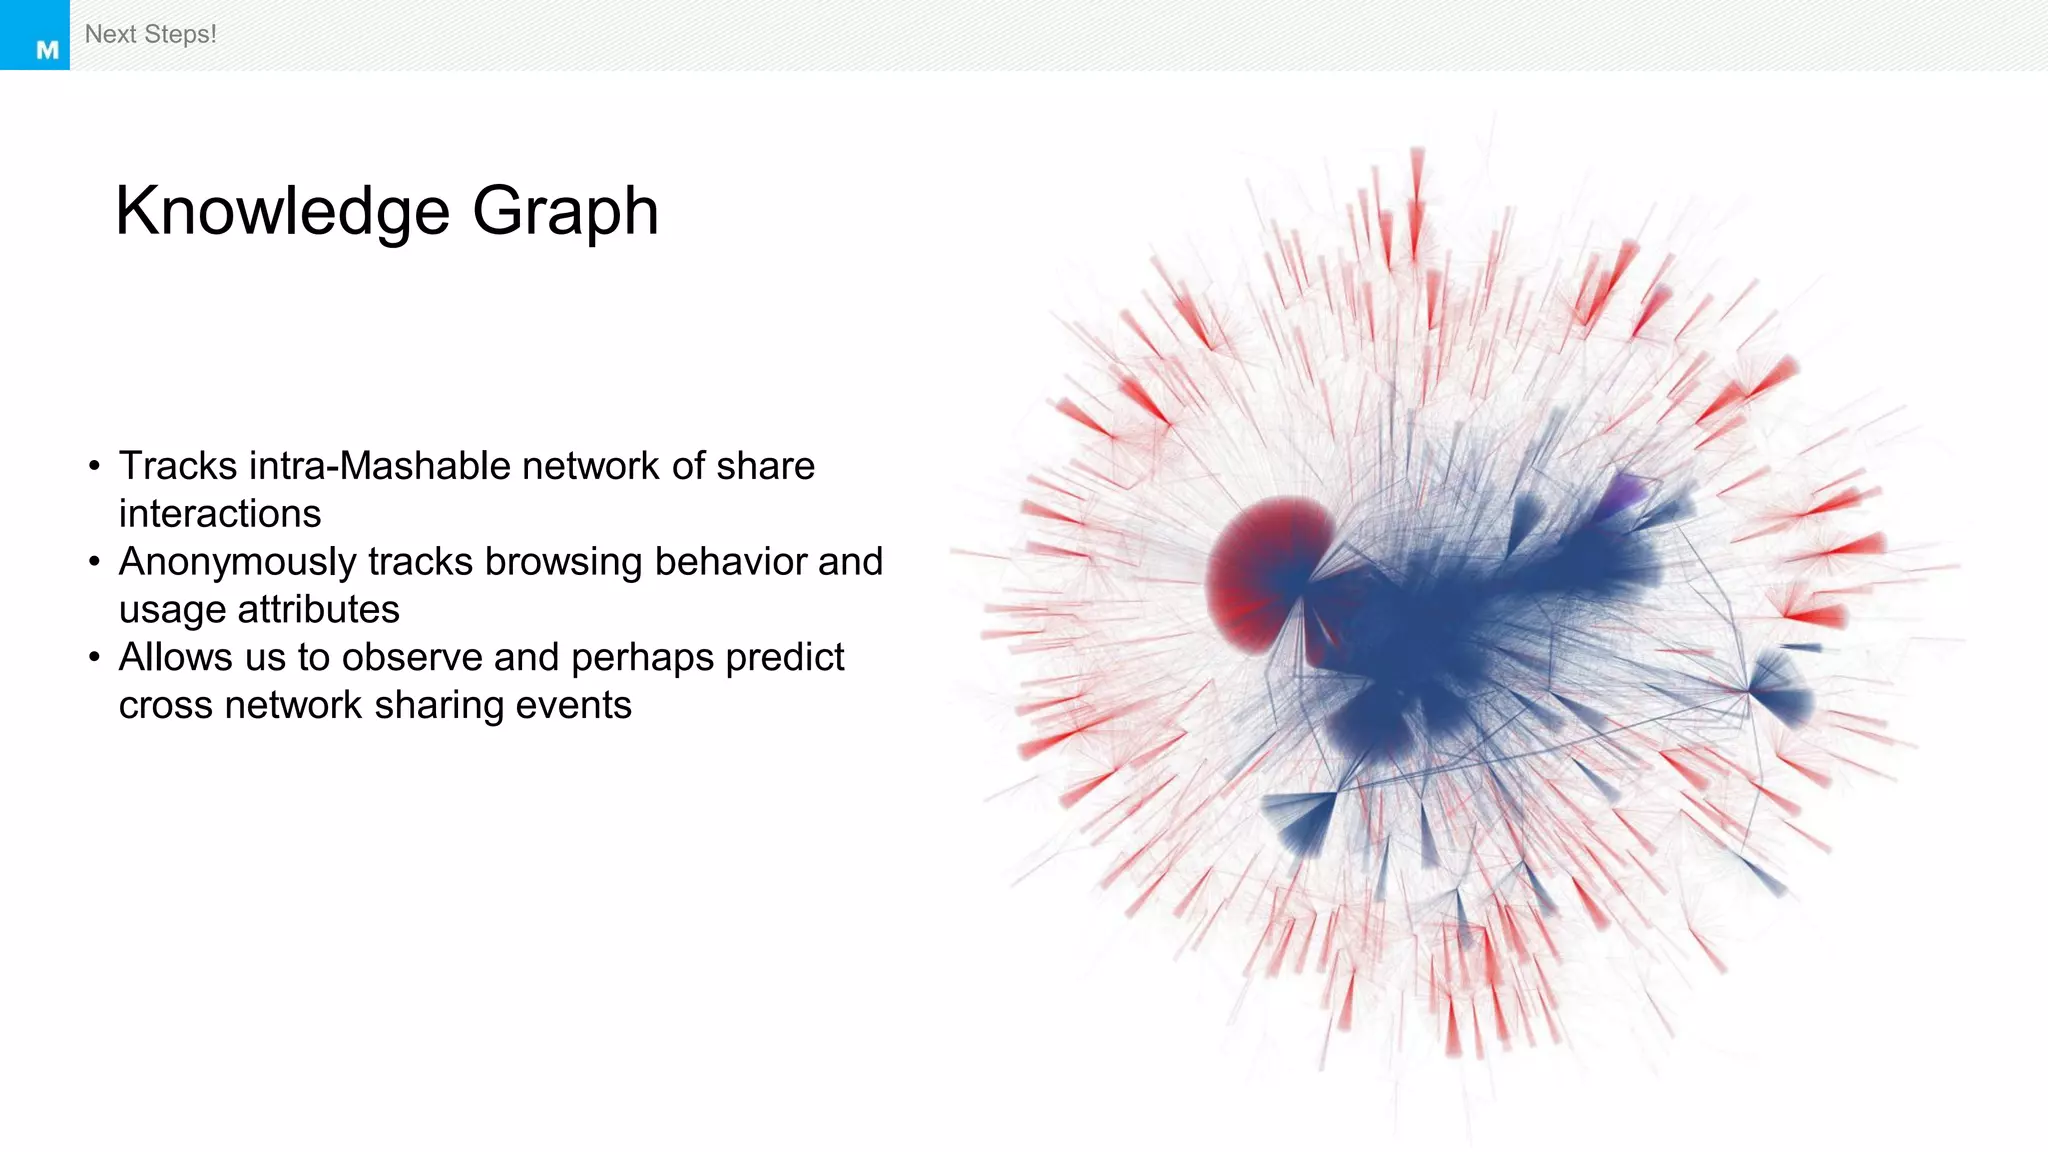
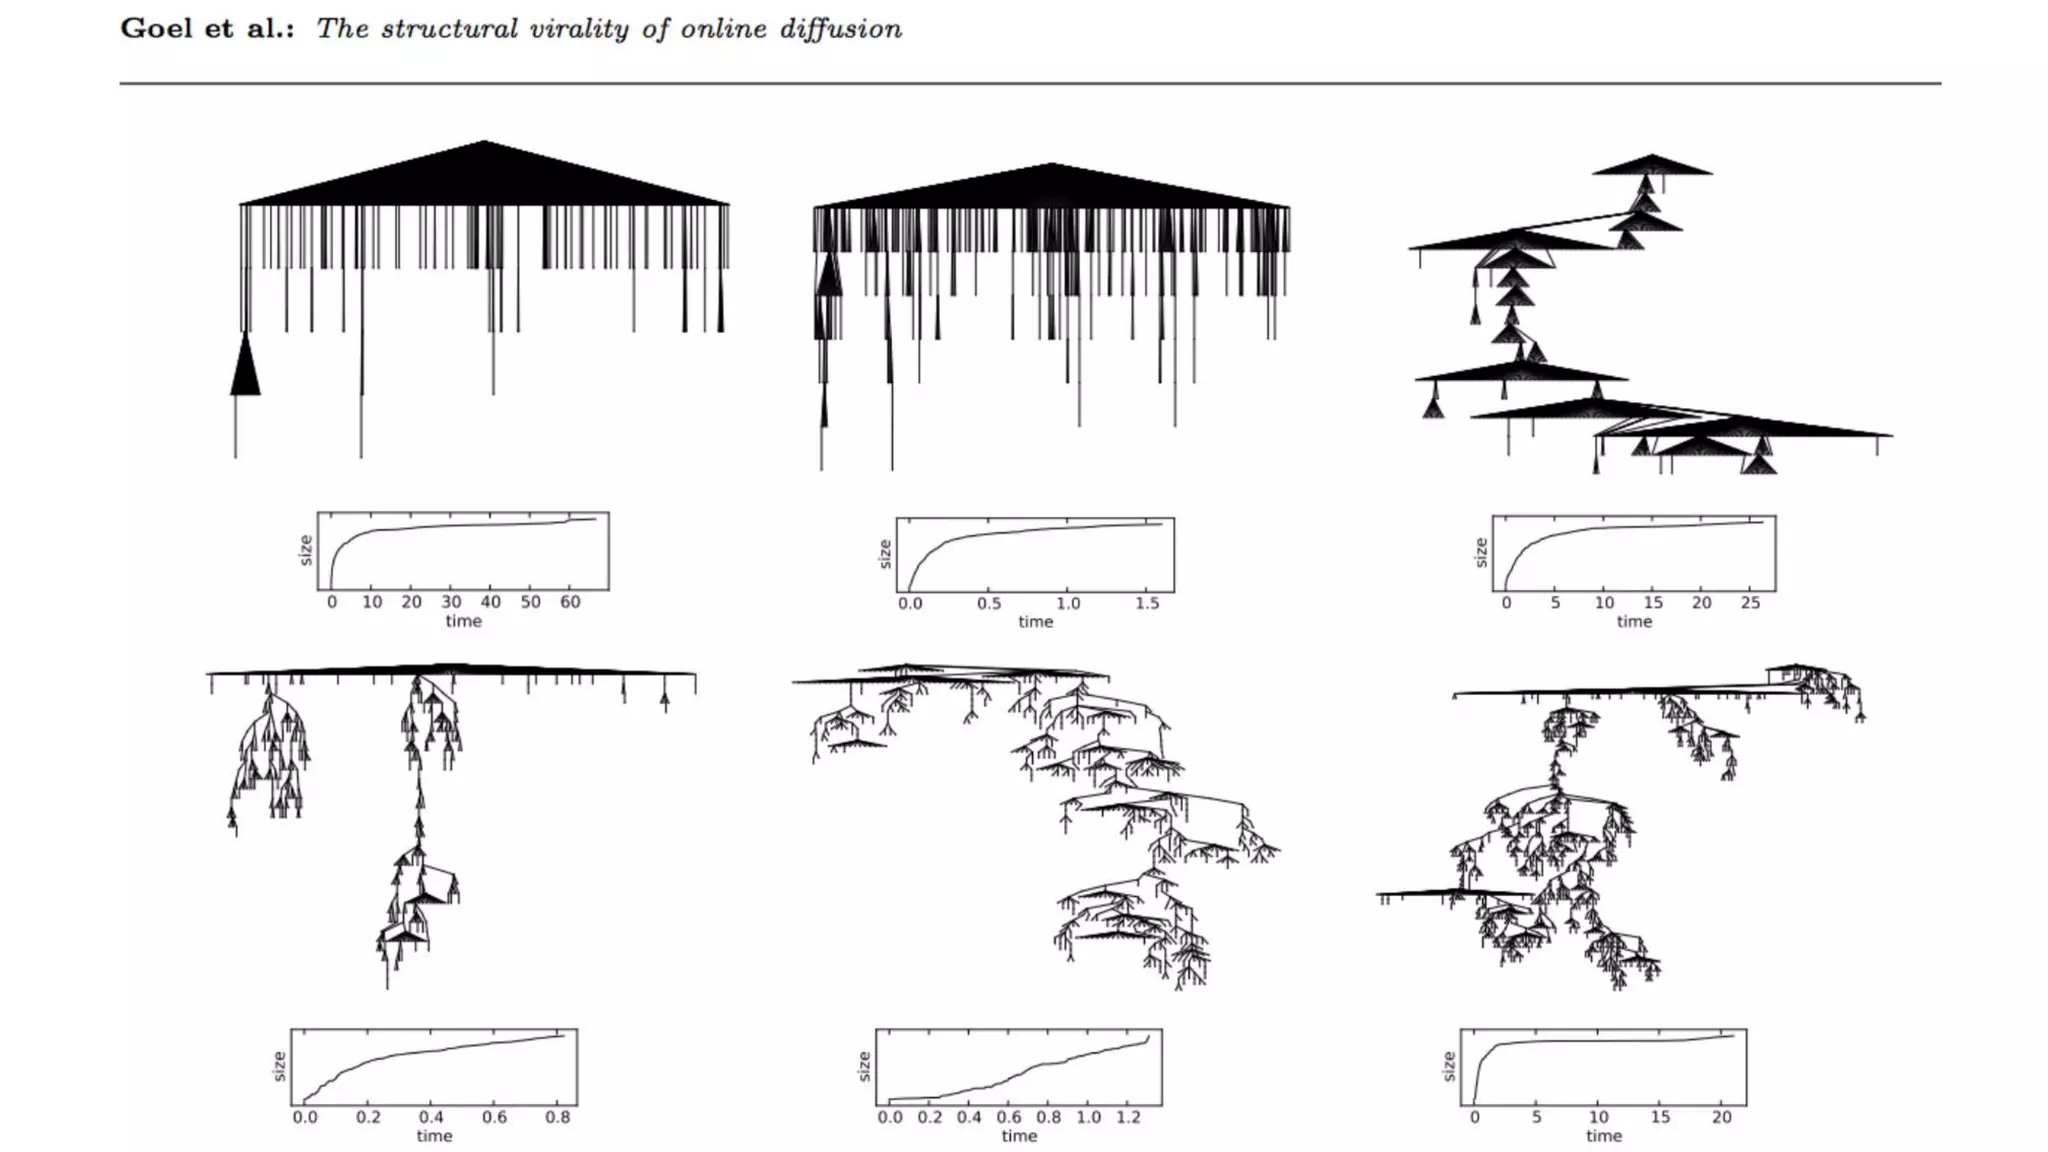
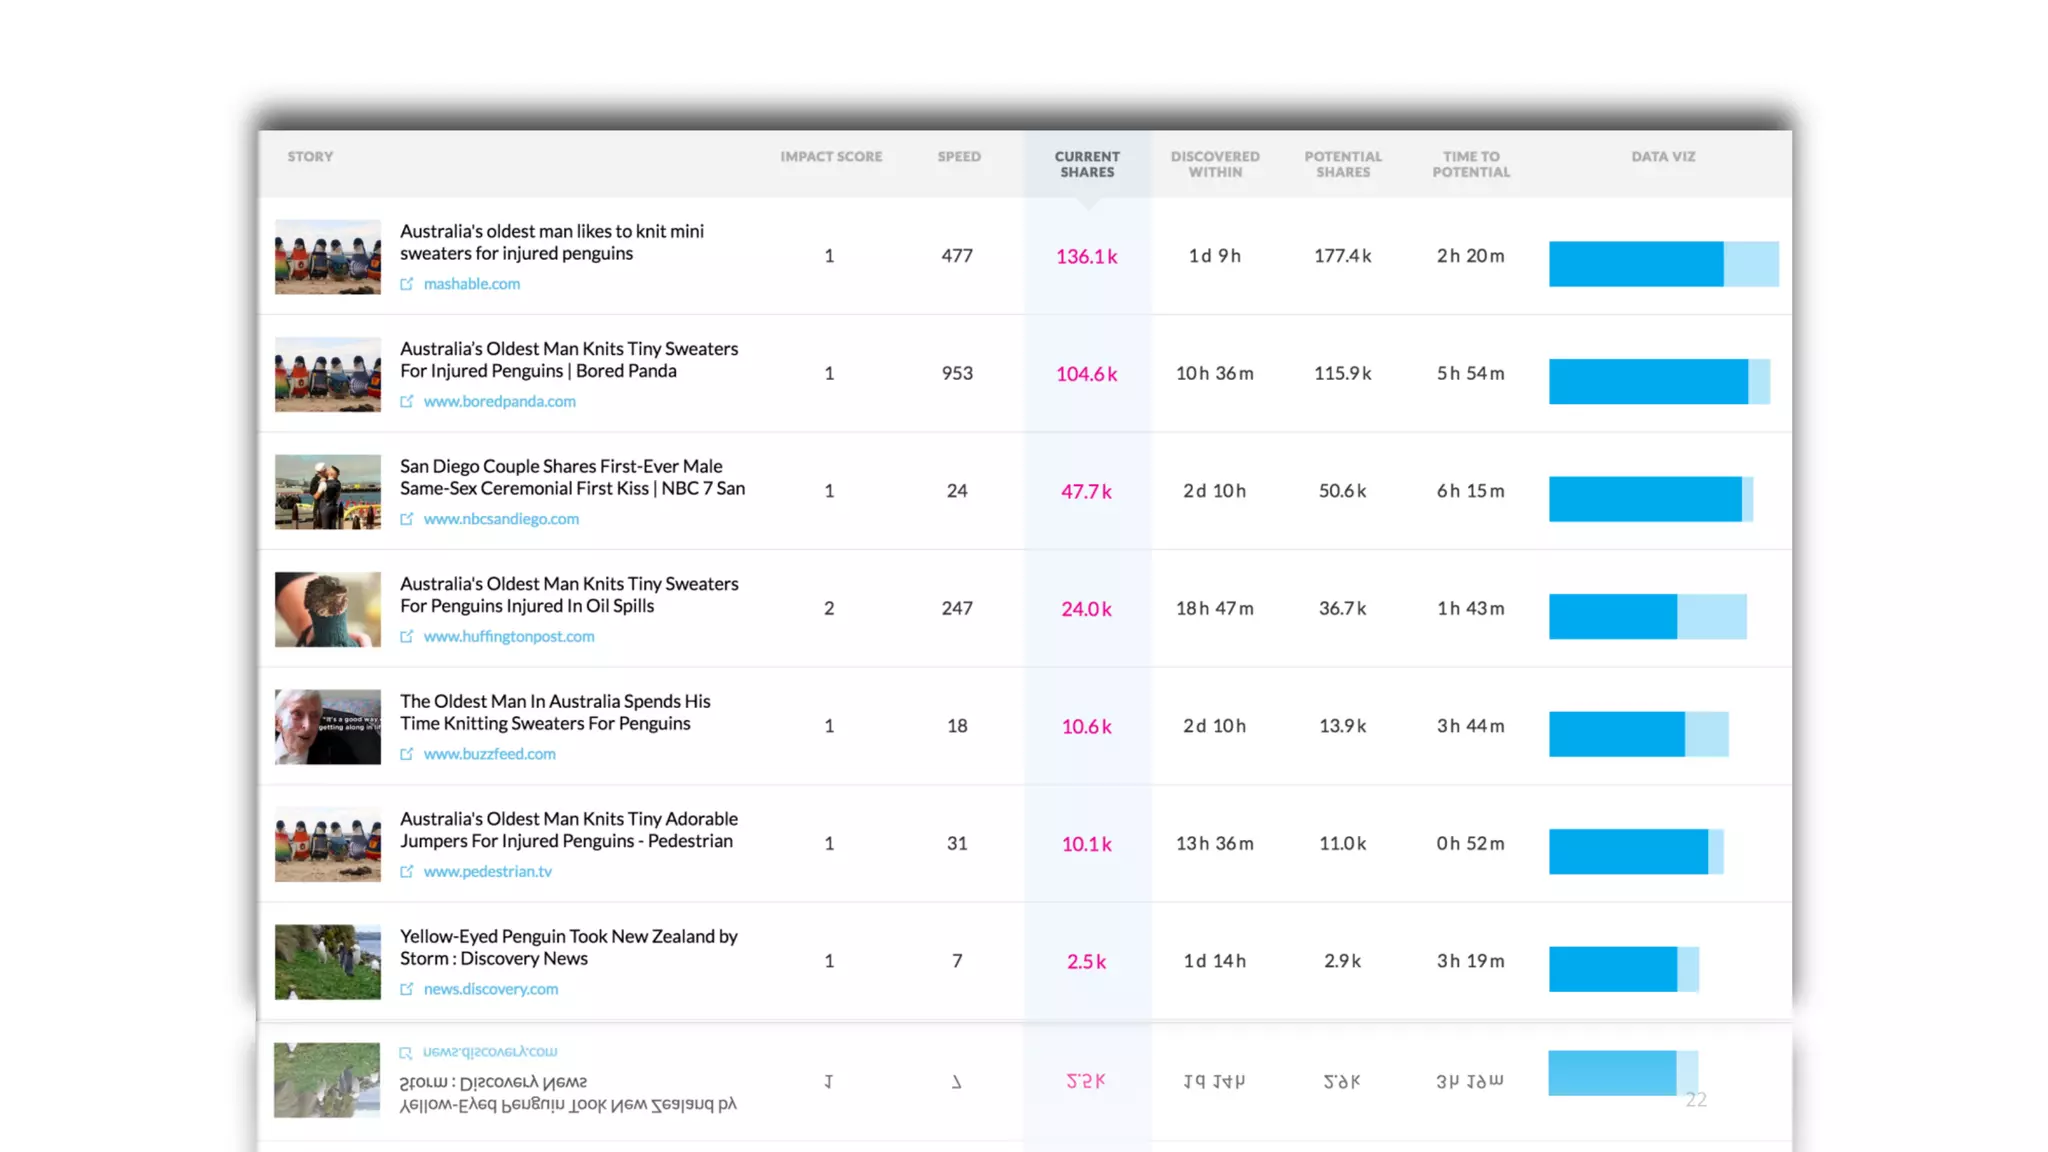
The document discusses the challenges publishers face being dependent on advertising revenue from large platforms. It suggests ways publishers can gain advantages through better understanding their audience and leveraging social media data. Specifically, it proposes building a knowledge graph to track sharing interactions, observe user behavior, and potentially predict viral content. This could allow targeting campaigns more efficiently and gaining insights into community structures.
Multilevel Regression and Post-stratification (MRP) for Brand Tracking: PyCon...Latana
This is the presentation made at PyConDE & PyData Berlin 2019 by Korbinian Kuusisto, Data Scientist at Latana. The presentation covers why Latana used multilevel regression and post-stratification (MRP) to create thousands of audience segmentations, a brand tracking software. While Latana’s MVP was built using simple logistic regression, the team decided to switch to a more complex Bayesian framework and created a self-learning model that can build on past knowledge for niche audiences.
Storytelling for analytics | Naveen Gattu | CDAO Apex 2020Gramener
Chief data and analytics officers (CDAO) Apex Winter 2020 conference in Orlando was an intimate gathering of analytics leaders from across the world.
Gramener's Co-founder and COO, Naveen Gattu, spoke about the importance of storytelling on easy data consumption and impact on data-driven decision making for business users.
Data Storytelling - Game changer for Analytics Gramener
50 Percent of Data Science Projects Fail at
Consumption: Can Storytelling Be Your Game
Changer
Growth of Self Service BI has generated a lot of
dashboards, but “lots” does not always mean “good” or
“useful”.
• While advances in AI/ML lead to deeper insights,
business teams struggle with the adoption of
algorithms and consumption
• How can data officers and analytics leaders
get better business ROI from their data science
investments?
• This session will show you how to unleash the
power of data storytelling for business decision-
making, using industry examples
How AI Can Help You Make Your Audience Sit Up and Take NoticeGramener
How do you cut through the clutter and connect with your audience? Can data make your message more credible? Can analytics help you craft compelling content? How can AI help understand your audience’s response?
This PPT was presented by Ganes Kesari for his talk at the IABC Conference 2020.
Crowdsourcing, Transparency and Results Based Charity RatingsCharityNav
Charity Navigator's President & CEO, Ken Berger, presented on the topic of “Crowdsourcing, Transparency and Results Based Charity Ratings: The Next Generation of Nonprofit Evaluation” at Columbia University.
Presentation on the uses & misues of data, embracing illustrations & examples, as presented to the Numis Securities Media Conference in London April 2011
Predictive Analytics: How This Revolutionary Technology for Strategic Marketi...Media Needle
An advanced software solution using agent based modeling to recreate a virtual marketplace with your target markets networked behavior patterns. All touch points in the entire consumer journey are connected and include key dynamics such as brand sentiment, word-of-mouth, social media, online and offline channels. Vet your ROI on every strategic move your brand makes before doing anything and use this as unfair advantage against your competition.
Media Needle's strategy simulation platform enables brands to accurately forecast performance of advertising campaigns and key business decisions. Delivering a better understanding of the risks and outcomes these simulations enable brands to develop a more accountable and refined marketing strategy.
Storyfying your Data: How to go from Data to Insights to StoriesGramener
Gramener's Director - Client success, Shravan Kumar A, delivered an online session to the students of Praxis Business School.
In his session he talked about how converting data into stories can benefit businesses and enable quick decision making. Furthermore, he shared approaches to create data stories along with some use cases and case studies we solved at Gramener to benefit our clients.
Check out our initiative to teach data storytelling to data scientists and analysts so that they can think out of the box and create wonderful data stories for their stakeholders: https://gramener.com/data-storytelling-workshop
The ultimate guide to data storytelling | MaterclassGramener
Gramener collaborated with Nasscom to conduct an online masterclass session on "Storytelling With Data." Gramener's CEO, S Anand, led the masterclass and shared some important slides on how to make data stories and how to drive storytelling.
The slides talk about the structure of data stories and how to find meaning full insights from data. There are real-time examples of data analysis and visualizations we created a Gramener to communicate insights as stories.
This is an ultimate guide on data storytelling that offers tips to create data stories, things to keep in mind while making storylines, and choosing designs to make a design-led data story.
Know more about Gramener's data storytelling workshop for analysts and data scientists at https://gramener.com/data-storytelling-workshop
AMES 2016 - The Human Side of AnalyticsStephen Tracy
Last year the global analytics industry was estimated to be worth $125 billion in hardware, software and services revenue. Consequently the market has been flooded with more tools, platforms and tech than you can shake a calculator at. When it comes to data, the core challenge many businesses face today seems to have less to do with analytics technology and infrastructure and more to do with finding the right people, talent and skills. In this presentation Stephen will share 10 lessons for building a successful analytics program through a ‘people-first’ strategy.
What Is Incrementality & Why Does It Matter To Your Marketing? [By MetricWorks]SanjayRaghu5
What Is Incrementality & Why Does It Matter To Your Marketing? [By MetricWorks]
For more info visit: metric.works/demo
To request a demo or submit questions: demo@metric.works
Predictive Analytics and Remarketing - Google Clark Boyd
Predictive analytics will open the door to much more nuanced, rewarding communications between brands and consumers. Here, we look at the implications for remarketing via paid search and display advertising.
You'd like to be more rational and data-driven in your decision making. You know that your museum has been collecting web traffic metrics using Google Analytics, but you've never fully understood what those reports mean for you or your department. How can you use this popular software to find actionable data that helps you do your job better? In this session you will get a practical tutorial, led by two Google Analytics veterans at the Smithsonian, who will provide an overview of the current Google Analytics, including some of its newest, most powerful features. The presenters will also discuss the step-by-step process for moving beyond measurement just for measurement's sake, using real-life museum case studies as examples.
Presenters: Sara Snyder, Smithsonian American Art Museum; Brian Alpert, Smithsonian Institution.
Presented at the American Alliance of Museums 2016 Annual Meeting & MuseumExpo, 5/27/2016.
The Centrality of a Detailed Understanding of your AudienceRising Media Ltd.
For media organizations an understanding of one's audience is key to delivering optimal content. The path to this understanding often runs through logged behavioral data, but can we leverage methods from the world of polling to generate additional insights?
A comprehensive summary about the lifetime value predictions that Martin, Head of Marketing at AppAgent, has learned by building analytics platforms for clients and consulting with the best of the best in the mobile industry.
Deriving Intelligence from Customer Actions: Data Marketing 2015 presentation Mathew Sweezey
Understand customers wants, needs, and desires is a tricky business but it can be made much easier if you understand three key ideas: stage based marketing, system of relevance, and the fundamentals of modern consumer desires. This presentation was created for the Data Marketing conference in Toronto 2015, and outlines new research into modern buyers, and how to understand their needs, derive intelligence from their actions, and provide the best experience possible in the modern era.
At Long Last… Here’s Your Incredible Opportunity To Shove Guesswork Aside And Focus On Where The Money Really, Really, Really Is… Generating Killer TARGETED (Not Just Any Kind) Traffic To Your Web Sites Using Simple But Ingenious Tactics!
EARN $$$ ONLINE WITH SUPREME WEALTH ALLIANCETed Yobski
SWA Ultimate is one of the very few online opportunities that is 100% DEFINITELY SUSTAINABLE. Since day 1 of operations with only a few members, and up to now with thousands upon thousands of members, our payout rate has remained stable and basically the same... while operating costs have been kept at a minimum. So if you're concerned about long term stability and keeping your credibility as an online entrepreneur, SWA Ultimate is the way to go!
Joined together in the Supreme Wealth Alliance Ultimate: Perfect Pay Plan System, you now have everything you've dreamed of in a network marketing business...
Get the Most out of Your Traffic: Smart Strategies to Increase ConversionPedram Farsaii, MBA
Marketers are projected to spend over $67 BILLION in digital campaigns by the end of 2016…WOW. With that type of spending, there are seemingly no limits to driving traffic to your site. But, how do we take these visitors and better convert them in the rapidly evolving digital landscape? It’s time to re-think the traditional view of the conversion funnel:
- Why every door into your website can lead to important conversion insights.
- Better leveraging data to pinpoint weak spots of your website.
- Proven testing tactics that can help you drive more conversions!
Before you start creating content, you need to build your strategy. We collected such valuable insights from over 40 major brands and thought leaders that we are rereleasing this ebook to help make your content marketing successful.
Adjusting primitives for graph : SHORT REPORT / NOTESSubhajit Sahu
Graph algorithms, like PageRank Compressed Sparse Row (CSR) is an adjacency-list based graph representation that is
Multiply with different modes (map)
1. Performance of sequential execution based vs OpenMP based vector multiply.
2. Comparing various launch configs for CUDA based vector multiply.
Sum with different storage types (reduce)
1. Performance of vector element sum using float vs bfloat16 as the storage type.
Sum with different modes (reduce)
1. Performance of sequential execution based vs OpenMP based vector element sum.
2. Performance of memcpy vs in-place based CUDA based vector element sum.
3. Comparing various launch configs for CUDA based vector element sum (memcpy).
4. Comparing various launch configs for CUDA based vector element sum (in-place).
Sum with in-place strategies of CUDA mode (reduce)
1. Comparing various launch configs for CUDA based vector element sum (in-place).
Techniques to optimize the pagerank algorithm usually fall in two categories. One is to try reducing the work per iteration, and the other is to try reducing the number of iterations. These goals are often at odds with one another. Skipping computation on vertices which have already converged has the potential to save iteration time. Skipping in-identical vertices, with the same in-links, helps reduce duplicate computations and thus could help reduce iteration time. Road networks often have chains which can be short-circuited before pagerank computation to improve performance. Final ranks of chain nodes can be easily calculated. This could reduce both the iteration time, and the number of iterations. If a graph has no dangling nodes, pagerank of each strongly connected component can be computed in topological order. This could help reduce the iteration time, no. of iterations, and also enable multi-iteration concurrency in pagerank computation. The combination of all of the above methods is the STICD algorithm. [sticd] For dynamic graphs, unchanged components whose ranks are unaffected can be skipped altogether.
As Europe's leading economic powerhouse and the fourth-largest hashtag#economy globally, Germany stands at the forefront of innovation and industrial might. Renowned for its precision engineering and high-tech sectors, Germany's economic structure is heavily supported by a robust service industry, accounting for approximately 68% of its GDP. This economic clout and strategic geopolitical stance position Germany as a focal point in the global cyber threat landscape.
In the face of escalating global tensions, particularly those emanating from geopolitical disputes with nations like hashtag#Russia and hashtag#China, hashtag#Germany has witnessed a significant uptick in targeted cyber operations. Our analysis indicates a marked increase in hashtag#cyberattack sophistication aimed at critical infrastructure and key industrial sectors. These attacks range from ransomware campaigns to hashtag#AdvancedPersistentThreats (hashtag#APTs), threatening national security and business integrity.
🔑 Key findings include:
🔍 Increased frequency and complexity of cyber threats.
🔍 Escalation of state-sponsored and criminally motivated cyber operations.
🔍 Active dark web exchanges of malicious tools and tactics.
Our comprehensive report delves into these challenges, using a blend of open-source and proprietary data collection techniques. By monitoring activity on critical networks and analyzing attack patterns, our team provides a detailed overview of the threats facing German entities.
This report aims to equip stakeholders across public and private sectors with the knowledge to enhance their defensive strategies, reduce exposure to cyber risks, and reinforce Germany's resilience against cyber threats.
7. Ultimately ads constitute a large fraction of our revenue!
And clearly we depend heavily on the top 2 to do well…
8. Ultimately ads constitute a large fraction of our revenue!
And clearly we depend heavily on the top 2 to do well.
“We are but barnacles living off the back of a massive ad whale…”
9. Ultimately ads constitute a large fraction of our revenue!
And clearly we depend heavily on the top 2 to do well.
“We are but barnacles living off the back of a massive ad whale…”
10. There’s actually a non-trivial symbiosis here
Instead of obligate commensalism…
11. It’s an asymmetric relationship, to be sure, but
publishers provide the ‘real estate’ over which
these big whales make their revenue. And we
make their platforms sticky.
Publishers
12. • Like barnacles there’s a lot of competition for space
• The terms of that competition are dictated by black-box algorithms
• They get to keep all that good data
Not all smooth sailing on the back of the whale
13.
14. Hopeless…?
How do we gain an advantage?
Can we predict our way to a competitive edge?
16. Marketing ApproachIlluminating the structure of social diffusion
To simplify we remove the leaves—uniques that arrive on our content through shared lin
In this case 40 sharers generate a cascade bringing in 2886 views - a 70x efficiency!
17. Next Steps!
Knowledge Graph
• Tracks intra-Mashable network of share
interactions
• Anonymously tracks browsing behavior and
usage attributes
• Allows us to observe and perhaps predict
cross network sharing events
19. Social cascades are fascinating…can we get a deeper view?
What can one do with this sort of
data?
20. Marketing ApproachArriving at a phenomenological model
The above is a cascade generated from a simulation with simple update rules.
It bears a strong resemblance to what we actually see in our share button experiment.
In fact, it turns out that a simple model of leave growth/viewer rate yields a model of share behavior with
predictive power!
21. Marketing ApproachVelocity
● Discovered right as it was
published
● Over 3,000 data points
collected
● Several points where story
trajectory changed & prediction
found & adapted.
● Early projections very
accurately modeled each
subseries in the total dataset.
Success!
23. • Facebook’s Accuracy: 79.5%
Velocity’s Accuracy:
75% accurate after 5min across all content
80% accurate after 5hrs across all content
95% accurate after 1 day across all content
100% accurate after 5min for 70% of content!!
28. Marketing
Approach
Admiral Robert FitzRoy:
a true Data Scientist
• attacked a problem for which there was no or mostly dirty
data - data collection and munging
• formulated/borrowed a model appropriate to the data
• crafted a classifier (for storm prediction) and aimed for
increasing accuracy
• over-inflated title - Meteorological Statist…
• under routine evaluation to justify his salary
29. Social cascades are fascinating…can we get a deeper view?
What can one do with this sort of
data?
1) Build Velocity
2) Segment your audience by graph properties
33. KG
Through these sorts of properties:
• We’re able to identify community structure by
topic
• Make branded content campaigns
significantly more efficient
34. Conclusion
Publishers are heavily challenged
but
• It’s possible to carve out a data advantage
• Turn it into a predictive analytic capability
• And even a bit of competitive analysis