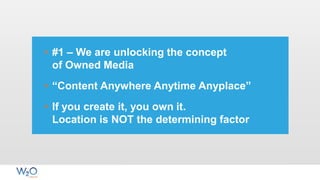
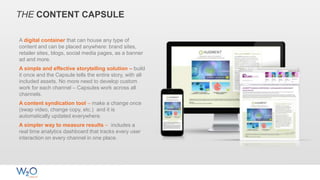
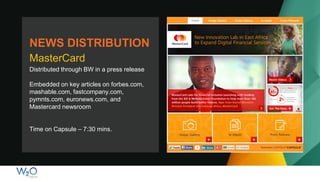
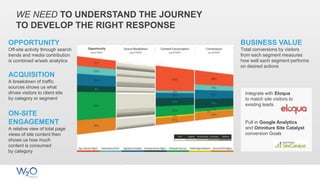
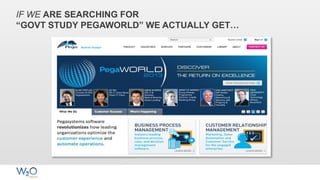
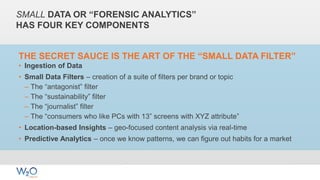
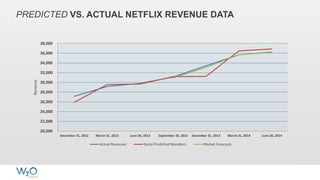
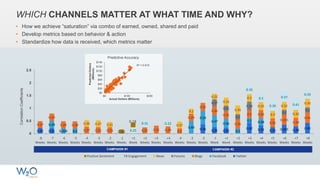
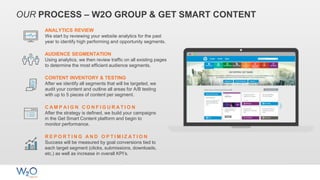
10 W2O MODELS
RESHAPING OUR INDUSTRY
PreCommerce Summit
Bob Pearson – March 12, 2015
ATX
• #1 – We are unlocking the concept
of Owned Media
• “Content Anywhere Anytime Anyplace”
• If you create it, you own it.
Location is NOT the determining factor
THE CONTENT CAPSULE
A digital container that can house any type of
content and can be placed anywhere: brand sites,
retailer sites, blogs, social media pages, as a banner
ad and more.
A simple and effective storytelling solution – build
it once and the Capsule tells the entire story, with all
included assets. No more need to develop custom
work for each channel – Capsules work across all
channels.
A content syndication tool – make a change once
(swap video, change copy, etc.) and it is
automatically updated everywhere.
A simpler way to measure results – includes a
real time analytics dashboard that tracks every user
interaction on every channel in one place.
MasterCard
Distributed through BW in a press release
Embedded on key articles on forbes.com,
mashable.com, fastcompany.com,
pymnts.com, euronews.com, and
Mastercard newsroom
Time on Capsule – 7:30 mins.
NEWS DISTRIBUTION
SANOFI PASTEUR –
Unbranded Awareness Campaign
RESULTS:
Currently embedded on 56 sites
Time on Capsule averaging
5 min 30 seconds
• #2 – What you “own” should align with
what people “want” when they want it
• The emergence of responsive experiences
that align with the needs of your customer
• Responsive design is old school
WE NEED TO UNDERSTAND THE JOURNEY
TO DEVELOP THE RIGHT RESPONSE
Opportunity
OPPORTUNITY
Off-site activity through search
trends and media contribution
is combined w/web analytics
Integrate with Eloqua
to match site visitors to
existing leads
Pull in Google Analytics
and Omniture Site Catalyst
conversion Goals
ACQUISITION
A breakdown of traffic
sources shows us what
drives visitors to client site
by category or segment
ON-SITE
ENGAGEMENT
A relative view of total page
views of site content then
shows us how much
content is consumed
by category
BUSINESS VALUE
Total conversions by visitors
from each segment measures
how well each segment performs
on desired actions
IF WE ARE SEARCHING FOR
“GOVT STUDY PEGAWORLD” WE ACTUALLY GET…
...THE EXPERIENCE WE WERE LOOKING FOR...
ALL IN OUR “EXPERIENCE LIBRARY”
42%
Higher click through
rate visitors served
industry specific
content.
29%
Decrease in
Bounce Rate
14%
Increase in
Pages Per Visit
22%
Increase in
Visit Duration
• #3 – Create and track your core audience
to redefine how we listen, learn and act
• Any discrete set of people can be
identified, indexed and they start
teaching us what to do
THE MDIGITAL LIFE HOSPITAL INDEX
MDIGITAL LIFE DOCTORS
bit.ly/mdlpw514
500+
100+
10+
1-9
50+
300+
• #4 – Decide “who” should tell your
brand’s story
• Influencer relationship management is
more important than traditional CRM to
shape markets
WHO INFLUENCES THE INFLUENCERS
360 degree view of how one influencer can have wide reach
160/1188 258/88372
WHOINFLUENCESTHEINFLUENCER?
Name / Outlet
Rank Score
Name / Outlet
Rank Score
Name / Outlet
Rank Score
Name / Outlet
Rank Score
WHODOESTHEINFLUENCERINFLUENCETHEMOST?
Name / Outlet
Rank Score
Name / Outlet
Rank Score
Name / Outlet
Rank Score
Name / Outlet
Rank Score
• #5 – Small data leads to smart filters
• Smart filters lead to right insights
SMALL DATA OR “FORENSIC ANALYTICS”
HAS FOUR KEY COMPONENTS
THE SECRET SAUCE IS THE ART OF THE “SMALL DATA FILTER”
• Ingestion of Data
• Small Data Filters – creation of a suite of filters per brand or topic
– The “antagonist” filter
– The “sustainability” filter
– The “journalist” filter
– The “consumers who like PCs with 13” screens with XYZ attribute”
• Location-based Insights – geo-focused content analysis via real-time
• Predictive Analytics – once we know patterns, we can figure out habits for a market
• #6 – Your own earned media network will
drive your market
• Earned media makes paid media smart
THE ARCHITECTURE IS SIMPLE
• People hang out by passion or profession
• We can identify the “1%” and the “9%”
• We end up with 10k-100k people per brand per country
• Imagine a network of 50k x 20 countries for one brand
• You have better and more accurate reach than most media outlets
• #7 – Data-driven organizations will require
a new insights OS to be shared between
our analysts and client teams
• The future is one of collaboration
DIMSUM DATA SCIENCE ENGINE CORE
DEMOCRATIZED ASSETS
STRATEGIES, MODULES, &
ALGORITHMNS FROM ENTIRE FIRM.
CUSTOM ASSETS
STRATEGIES & METHODS
CREATED SPECIFICALLY FOR THE
CLIENT
DIMSUM
LOAD
LOAD IN THE
INFORMATION YOU
WANT TO ANALYZE. THE
ENGINE WILL EXTRACT
AS MUCH VALUE OUT
OF THE DATA AS
POSSIBLE
ANALYZE
SOFTWARE ANALYZES
ALL THE AVAILABLE
DATA THROUGH
TOOLING, RANKING, &
EXPLORING
INFLUENCERS
TOPICS
THE STORY
THE PLAN
DIMSUM IN ACTION
• #8 – It’s time to become experts in
“bad media”
• Malware, Bots, fake reviews, black hat
search and more
• Bad media is expensive for marketers
• Click fraud, site takeovers and more
• We can optimize spend and educate by
VISUALIZING the WORLD OF BAD MEDIA
• #9 – We combine the best of research
and social analytics to become
more predictive
YOU CAN SEE LANGUAGE CHANGING IN THE 1% BEFORE THE 9%AverageEngagementperPost
0
10
20
30
40
50
60
70
80
90
Feb 14th Feb 21st Feb 28th Mar 7th Mar 14th Mar 21st Mar 28th Apr 4th Apr 11th Apr 18th Apr 25th May 2nd
Avg. Content Engine Engagement Avg. Promoted Tweet Engagement Avg. XY Engagement Linear (Avg. Content Engine Engagement)
Average CE Engagement = 46.7
AVERAGE ENGAGEMENT*
Who you follow to understand what is happening matters…
PREDICTED VS. ACTUAL NETFLIX REVENUE DATA
20,000
22,000
24,000
26,000
28,000
30,000
32,000
34,000
36,000
38,000
December 31, 2012 March 31, 2013 June 30, 2013 September 30, 2013 December 31, 2013 March 31, 2014 June 30, 2014
Revenue
Actual Revenues Social Predicted Members Market Forecasts
• #10 – Social Graphics will lead to new
forms of media planning and research
0.22 0.21
0.36 0.25 0.22
0.42 0.32 0.25 0.345 0.28 0.42
0.29
0.206 0.2
0.49
0.53
0.47
0.36
0.2
0.2 0.28
0.27
0.29
0.28 0.28
0.27 0.25 0.25 0.25 0.31 0.29 0.2
0.29
0.32
0.36
0.31
0.36
0.3 0.33
0.35
0.391
0.34
0.41
0.27
0.21
0.2
0.34
0.2
0.2
0.26 0.27 0.21 0.27
0.2
0.22
0.32
0.35
0.3
0.32
0.3
0.32
0.32
0.35
0.25
0.31 0.22
0.35
0.3
0.39
0.37
0.41
0.33
0.16
0.18
0
0.5
1
1.5
2
2.5
-8
Weeks
-7
Weeks
-6
Weeks
-5
Weeks
-4
Weeks
-3
Weeks
-2
Weeks
-1
Weeks
+1
Week
+2
Weeks
+3
Weeks
+4
Weeks
-4
Weeks
-3
Weeks
-2
Weeks
-1
Week
+1
Week
+2
Weeks
+3
Weeks
+4
Weeks
+5
Weeks
+6
Weeks
+7
Weeks
+8
Weeks
CorrelationCoefficients
Positive Sentiment FB Engagement News Forums Blogs Facebook Twitter
WHICH CHANNELS MATTER AT WHAT TIME AND WHY?
• How we achieve “saturation” via combo of earned, owned, shared and paid
• Develop metrics based on behavior & action
• Standardize how data is received, which metrics matter
CAMPAIGN #2CAMPAIGN #1
Predictive Accuracy
R² = 0.915
$0
$20
$40
$60
$80
$100
$120
$140
$0 $100 $200
PredictedDollars
(Millions)
Actual Dollars (Millions)
OUR PROCESS – W2O GROUP & GET SMART CONTENT
ANALYTICS REVIEW
We start by reviewing your website analytics for the past
year to identify high performing and opportunity segments.
AUDIENCE SEGMENTATION
Using analytics, we then review traffic on all existing pages
to determine the most efficient audience segments.
CONTENT INVENTORY & TESTING
After we identify all segments that will be targeted, we
audit your content and outline all areas for A/B testing
with up to 5 pieces of content per segment.
R E P O R T I N G A N D O P T I M I Z A T I O N
Success will be measured by goal conversions tied to
each target segment (clicks, submissions, downloads,
etc.) as well as increase in overall KPI’s.
C A M P A I G N C O N F I G U R A T I O N
After the strategy is defined, we build your campaigns
in the Get Smart Content platform and begin to
monitor performance.

B.Pearson_Ten Trends Reshaping our Industry_r01

  • 1.
    10 W2O MODELS RESHAPINGOUR INDUSTRY PreCommerce Summit Bob Pearson – March 12, 2015 ATX
  • 2.
    • #1 –We are unlocking the concept of Owned Media • “Content Anywhere Anytime Anyplace” • If you create it, you own it. Location is NOT the determining factor
  • 3.
    THE CONTENT CAPSULE Adigital container that can house any type of content and can be placed anywhere: brand sites, retailer sites, blogs, social media pages, as a banner ad and more. A simple and effective storytelling solution – build it once and the Capsule tells the entire story, with all included assets. No more need to develop custom work for each channel – Capsules work across all channels. A content syndication tool – make a change once (swap video, change copy, etc.) and it is automatically updated everywhere. A simpler way to measure results – includes a real time analytics dashboard that tracks every user interaction on every channel in one place.
  • 4.
    MasterCard Distributed through BWin a press release Embedded on key articles on forbes.com, mashable.com, fastcompany.com, pymnts.com, euronews.com, and Mastercard newsroom Time on Capsule – 7:30 mins. NEWS DISTRIBUTION
  • 5.
    SANOFI PASTEUR – UnbrandedAwareness Campaign RESULTS: Currently embedded on 56 sites Time on Capsule averaging 5 min 30 seconds
  • 6.
    • #2 –What you “own” should align with what people “want” when they want it • The emergence of responsive experiences that align with the needs of your customer • Responsive design is old school
  • 7.
    WE NEED TOUNDERSTAND THE JOURNEY TO DEVELOP THE RIGHT RESPONSE Opportunity OPPORTUNITY Off-site activity through search trends and media contribution is combined w/web analytics Integrate with Eloqua to match site visitors to existing leads Pull in Google Analytics and Omniture Site Catalyst conversion Goals ACQUISITION A breakdown of traffic sources shows us what drives visitors to client site by category or segment ON-SITE ENGAGEMENT A relative view of total page views of site content then shows us how much content is consumed by category BUSINESS VALUE Total conversions by visitors from each segment measures how well each segment performs on desired actions
  • 8.
    IF WE ARESEARCHING FOR “GOVT STUDY PEGAWORLD” WE ACTUALLY GET…
  • 9.
    ...THE EXPERIENCE WEWERE LOOKING FOR... ALL IN OUR “EXPERIENCE LIBRARY” 42% Higher click through rate visitors served industry specific content. 29% Decrease in Bounce Rate 14% Increase in Pages Per Visit 22% Increase in Visit Duration
  • 10.
    • #3 –Create and track your core audience to redefine how we listen, learn and act • Any discrete set of people can be identified, indexed and they start teaching us what to do
  • 11.
    THE MDIGITAL LIFEHOSPITAL INDEX
  • 12.
  • 13.
    • #4 –Decide “who” should tell your brand’s story • Influencer relationship management is more important than traditional CRM to shape markets
  • 14.
    WHO INFLUENCES THEINFLUENCERS 360 degree view of how one influencer can have wide reach 160/1188 258/88372 WHOINFLUENCESTHEINFLUENCER? Name / Outlet Rank Score Name / Outlet Rank Score Name / Outlet Rank Score Name / Outlet Rank Score WHODOESTHEINFLUENCERINFLUENCETHEMOST? Name / Outlet Rank Score Name / Outlet Rank Score Name / Outlet Rank Score Name / Outlet Rank Score
  • 20.
    • #5 –Small data leads to smart filters • Smart filters lead to right insights
  • 21.
    SMALL DATA OR“FORENSIC ANALYTICS” HAS FOUR KEY COMPONENTS THE SECRET SAUCE IS THE ART OF THE “SMALL DATA FILTER” • Ingestion of Data • Small Data Filters – creation of a suite of filters per brand or topic – The “antagonist” filter – The “sustainability” filter – The “journalist” filter – The “consumers who like PCs with 13” screens with XYZ attribute” • Location-based Insights – geo-focused content analysis via real-time • Predictive Analytics – once we know patterns, we can figure out habits for a market
  • 22.
    • #6 –Your own earned media network will drive your market • Earned media makes paid media smart
  • 23.
    THE ARCHITECTURE ISSIMPLE • People hang out by passion or profession • We can identify the “1%” and the “9%” • We end up with 10k-100k people per brand per country • Imagine a network of 50k x 20 countries for one brand • You have better and more accurate reach than most media outlets
  • 24.
    • #7 –Data-driven organizations will require a new insights OS to be shared between our analysts and client teams • The future is one of collaboration
  • 25.
    DIMSUM DATA SCIENCEENGINE CORE DEMOCRATIZED ASSETS STRATEGIES, MODULES, & ALGORITHMNS FROM ENTIRE FIRM. CUSTOM ASSETS STRATEGIES & METHODS CREATED SPECIFICALLY FOR THE CLIENT DIMSUM LOAD LOAD IN THE INFORMATION YOU WANT TO ANALYZE. THE ENGINE WILL EXTRACT AS MUCH VALUE OUT OF THE DATA AS POSSIBLE ANALYZE SOFTWARE ANALYZES ALL THE AVAILABLE DATA THROUGH TOOLING, RANKING, & EXPLORING INFLUENCERS TOPICS THE STORY THE PLAN
  • 26.
  • 27.
    • #8 –It’s time to become experts in “bad media” • Malware, Bots, fake reviews, black hat search and more
  • 28.
    • Bad mediais expensive for marketers • Click fraud, site takeovers and more • We can optimize spend and educate by VISUALIZING the WORLD OF BAD MEDIA
  • 29.
    • #9 –We combine the best of research and social analytics to become more predictive
  • 30.
    YOU CAN SEELANGUAGE CHANGING IN THE 1% BEFORE THE 9%AverageEngagementperPost 0 10 20 30 40 50 60 70 80 90 Feb 14th Feb 21st Feb 28th Mar 7th Mar 14th Mar 21st Mar 28th Apr 4th Apr 11th Apr 18th Apr 25th May 2nd Avg. Content Engine Engagement Avg. Promoted Tweet Engagement Avg. XY Engagement Linear (Avg. Content Engine Engagement) Average CE Engagement = 46.7 AVERAGE ENGAGEMENT* Who you follow to understand what is happening matters…
  • 31.
    PREDICTED VS. ACTUALNETFLIX REVENUE DATA 20,000 22,000 24,000 26,000 28,000 30,000 32,000 34,000 36,000 38,000 December 31, 2012 March 31, 2013 June 30, 2013 September 30, 2013 December 31, 2013 March 31, 2014 June 30, 2014 Revenue Actual Revenues Social Predicted Members Market Forecasts
  • 32.
    • #10 –Social Graphics will lead to new forms of media planning and research
  • 33.
    0.22 0.21 0.36 0.250.22 0.42 0.32 0.25 0.345 0.28 0.42 0.29 0.206 0.2 0.49 0.53 0.47 0.36 0.2 0.2 0.28 0.27 0.29 0.28 0.28 0.27 0.25 0.25 0.25 0.31 0.29 0.2 0.29 0.32 0.36 0.31 0.36 0.3 0.33 0.35 0.391 0.34 0.41 0.27 0.21 0.2 0.34 0.2 0.2 0.26 0.27 0.21 0.27 0.2 0.22 0.32 0.35 0.3 0.32 0.3 0.32 0.32 0.35 0.25 0.31 0.22 0.35 0.3 0.39 0.37 0.41 0.33 0.16 0.18 0 0.5 1 1.5 2 2.5 -8 Weeks -7 Weeks -6 Weeks -5 Weeks -4 Weeks -3 Weeks -2 Weeks -1 Weeks +1 Week +2 Weeks +3 Weeks +4 Weeks -4 Weeks -3 Weeks -2 Weeks -1 Week +1 Week +2 Weeks +3 Weeks +4 Weeks +5 Weeks +6 Weeks +7 Weeks +8 Weeks CorrelationCoefficients Positive Sentiment FB Engagement News Forums Blogs Facebook Twitter WHICH CHANNELS MATTER AT WHAT TIME AND WHY? • How we achieve “saturation” via combo of earned, owned, shared and paid • Develop metrics based on behavior & action • Standardize how data is received, which metrics matter CAMPAIGN #2CAMPAIGN #1 Predictive Accuracy R² = 0.915 $0 $20 $40 $60 $80 $100 $120 $140 $0 $100 $200 PredictedDollars (Millions) Actual Dollars (Millions)
  • 35.
    OUR PROCESS –W2O GROUP & GET SMART CONTENT ANALYTICS REVIEW We start by reviewing your website analytics for the past year to identify high performing and opportunity segments. AUDIENCE SEGMENTATION Using analytics, we then review traffic on all existing pages to determine the most efficient audience segments. CONTENT INVENTORY & TESTING After we identify all segments that will be targeted, we audit your content and outline all areas for A/B testing with up to 5 pieces of content per segment. R E P O R T I N G A N D O P T I M I Z A T I O N Success will be measured by goal conversions tied to each target segment (clicks, submissions, downloads, etc.) as well as increase in overall KPI’s. C A M P A I G N C O N F I G U R A T I O N After the strategy is defined, we build your campaigns in the Get Smart Content platform and begin to monitor performance.