
![Can Timing Work?
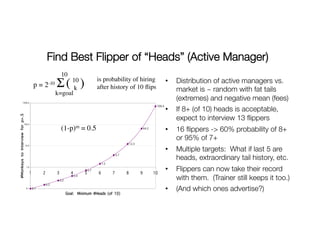
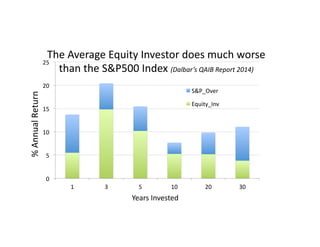
For most investors, it never has [see next slide]
There are 3 extreme challenges:
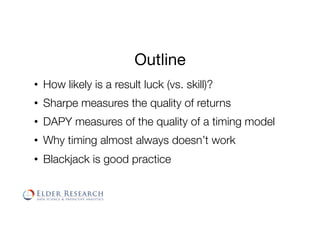
1. Skill is hard to distinguish from luck [coin flip ex.]
2. Markets are nearly efficient [huge ensembles]
3. One must constantly complete failed bets!
(which wars with our cognitive bias against losses)](https://image.slidesharecdn.com/eldershareable-171031224919/85/Elder-shareable-14-320.jpg)
![More Investment Modeling Challenges
• “Pockets of inefficiency” are trampled if found
• Historical state is hard to recreate accurately in data
[survivor bias, Bloomberg earnings reports]
• The system can change overnight [LTCM+Russia]
• Correlation increases during panics [killing hedges]](https://image.slidesharecdn.com/eldershareable-171031224919/85/Elder-shareable-16-320.jpg)
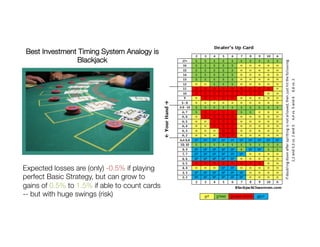

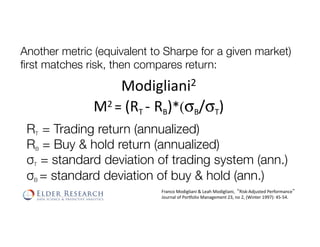

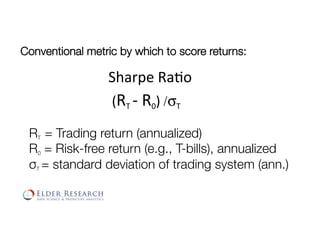
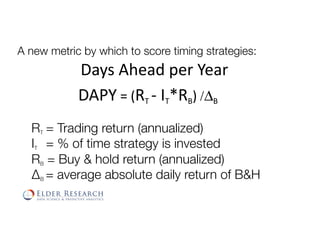
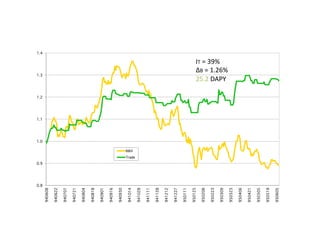
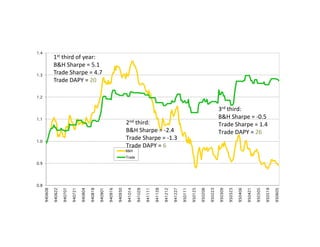
The document discusses various methods for evaluating market timing systems, including the Sharpe ratio, days ahead per year (DAPY), and Modigliani ratio. It notes that while market timing seems appealing, it is very difficult to achieve in practice due to challenges in distinguishing skill from luck, the efficiency of markets, and the psychological impact of losses from failed bets. Blackjack is provided as an analogy for how market timing could work if an investor was able to identify pockets of inefficiency, but that it is difficult to recreate historical market conditions accurately.


![[DSC Europe 25] Josip Saban - Career building for data professionals.pptx](https://cdn.slidesharecdn.com/ss_thumbnails/zroflcttkm1vmli0txea-josip-saban-career-building-for-data-professionals-260123083019-587cdb8c-thumbnail.jpg?width=640&height=640&fit=bounds)


![[DSC Europe 25] Milos Belcevic - Product Professional's Journey to Full-Stack...](https://cdn.slidesharecdn.com/ss_thumbnails/1zovd6fgsycdg4wvgvls-milos-belcevic-product-professionals-journey-to-full-stack-product-developer-260123083019-d993120d-thumbnail.jpg?width=640&height=640&fit=bounds)

