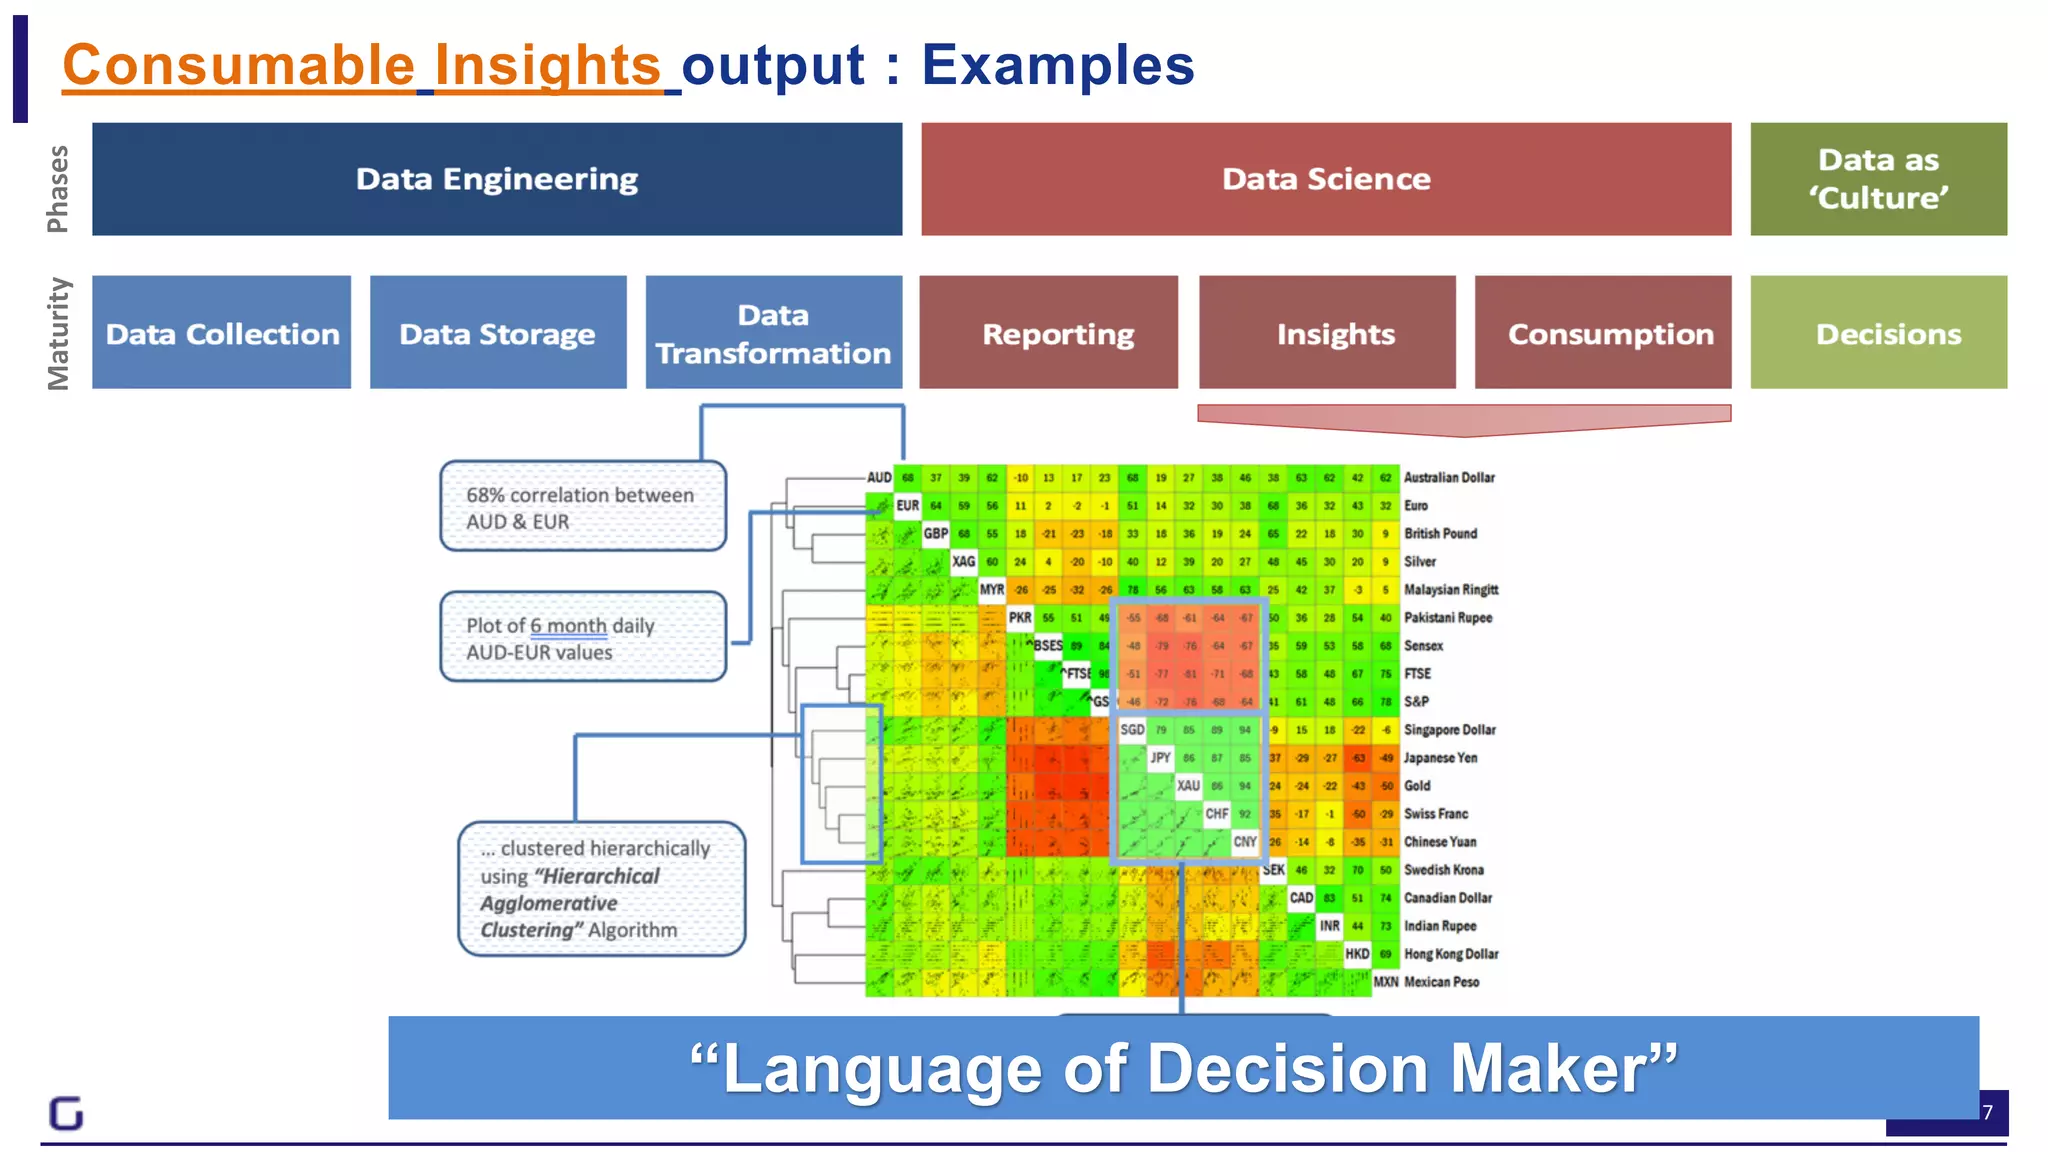
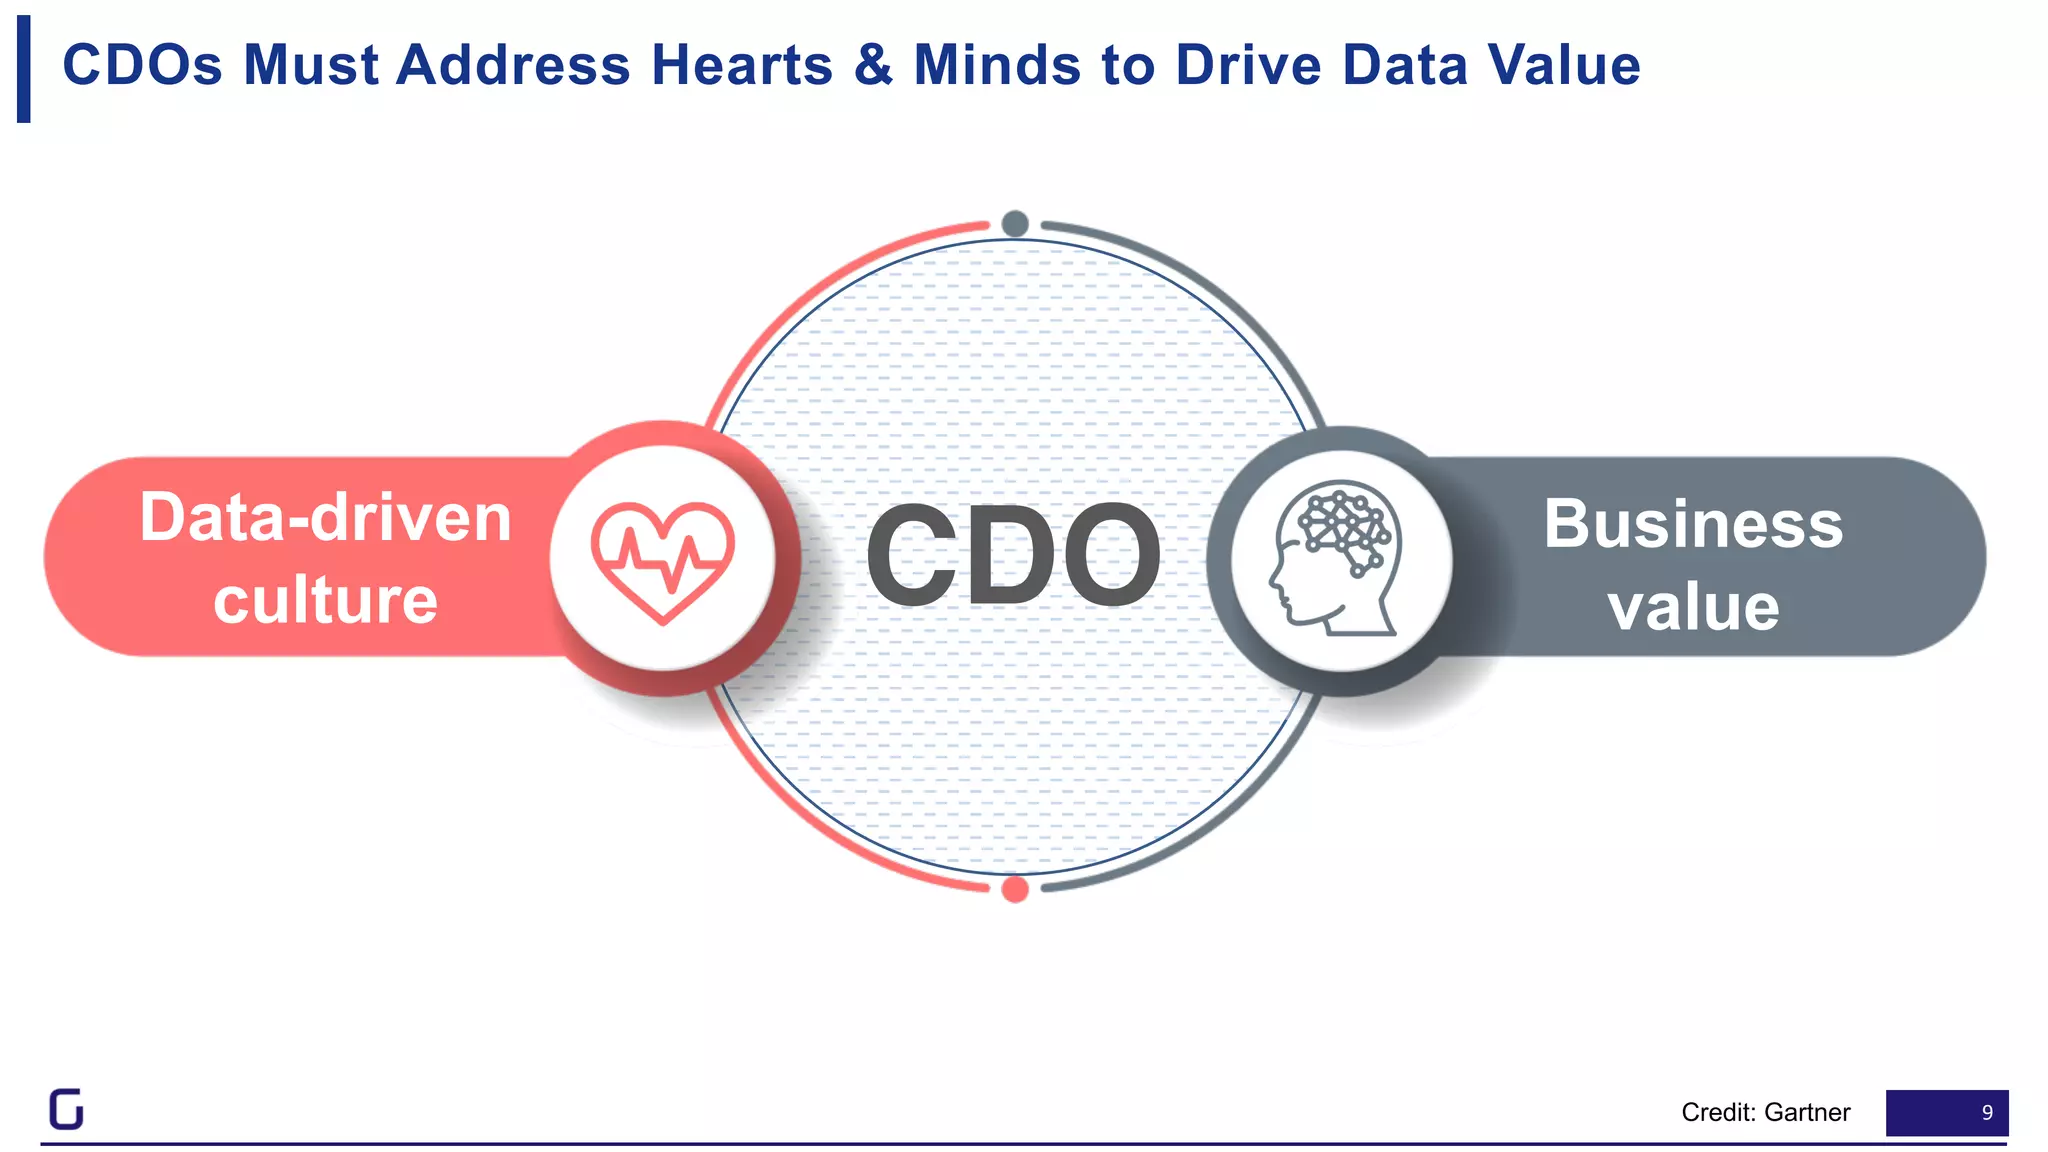
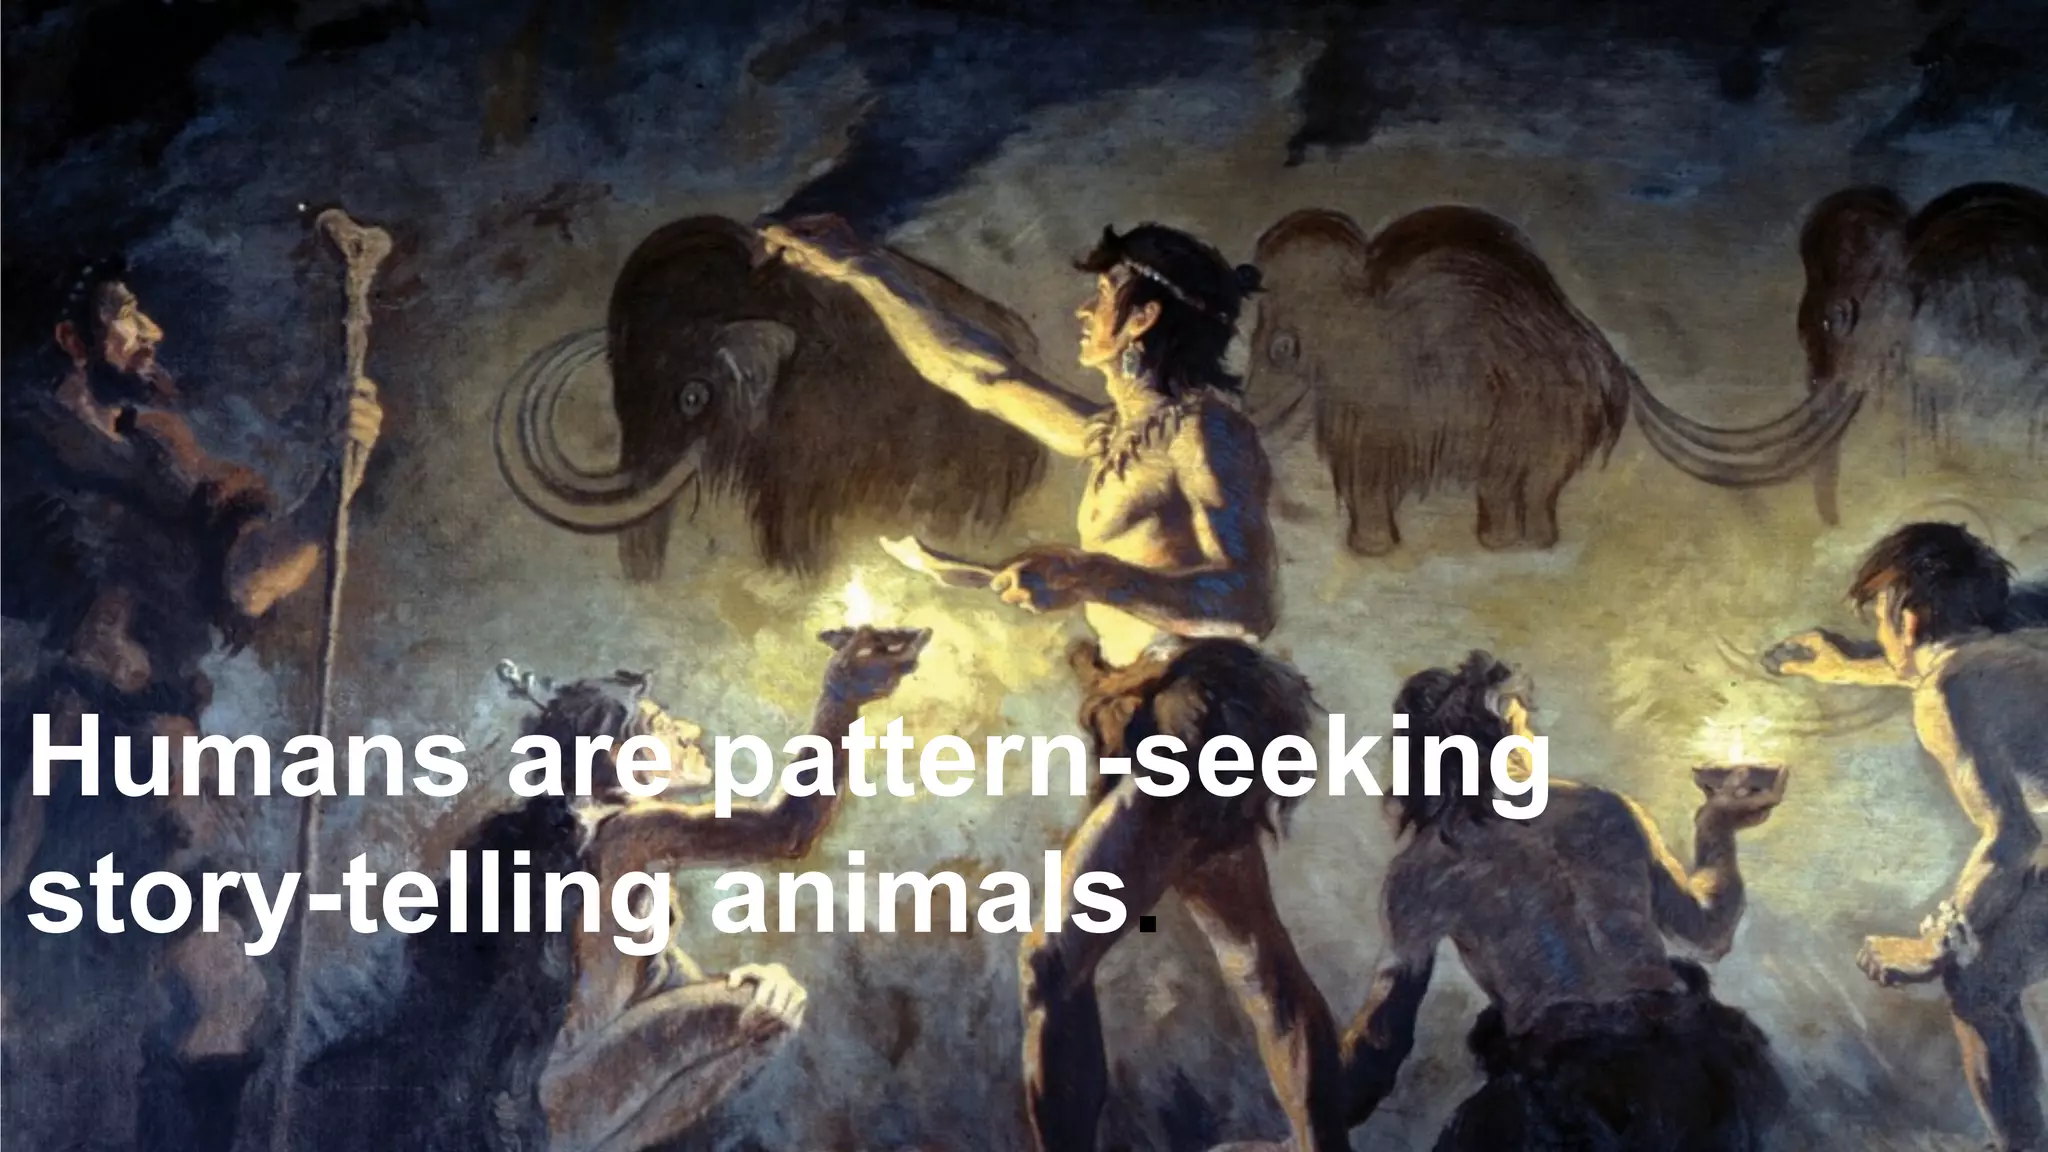
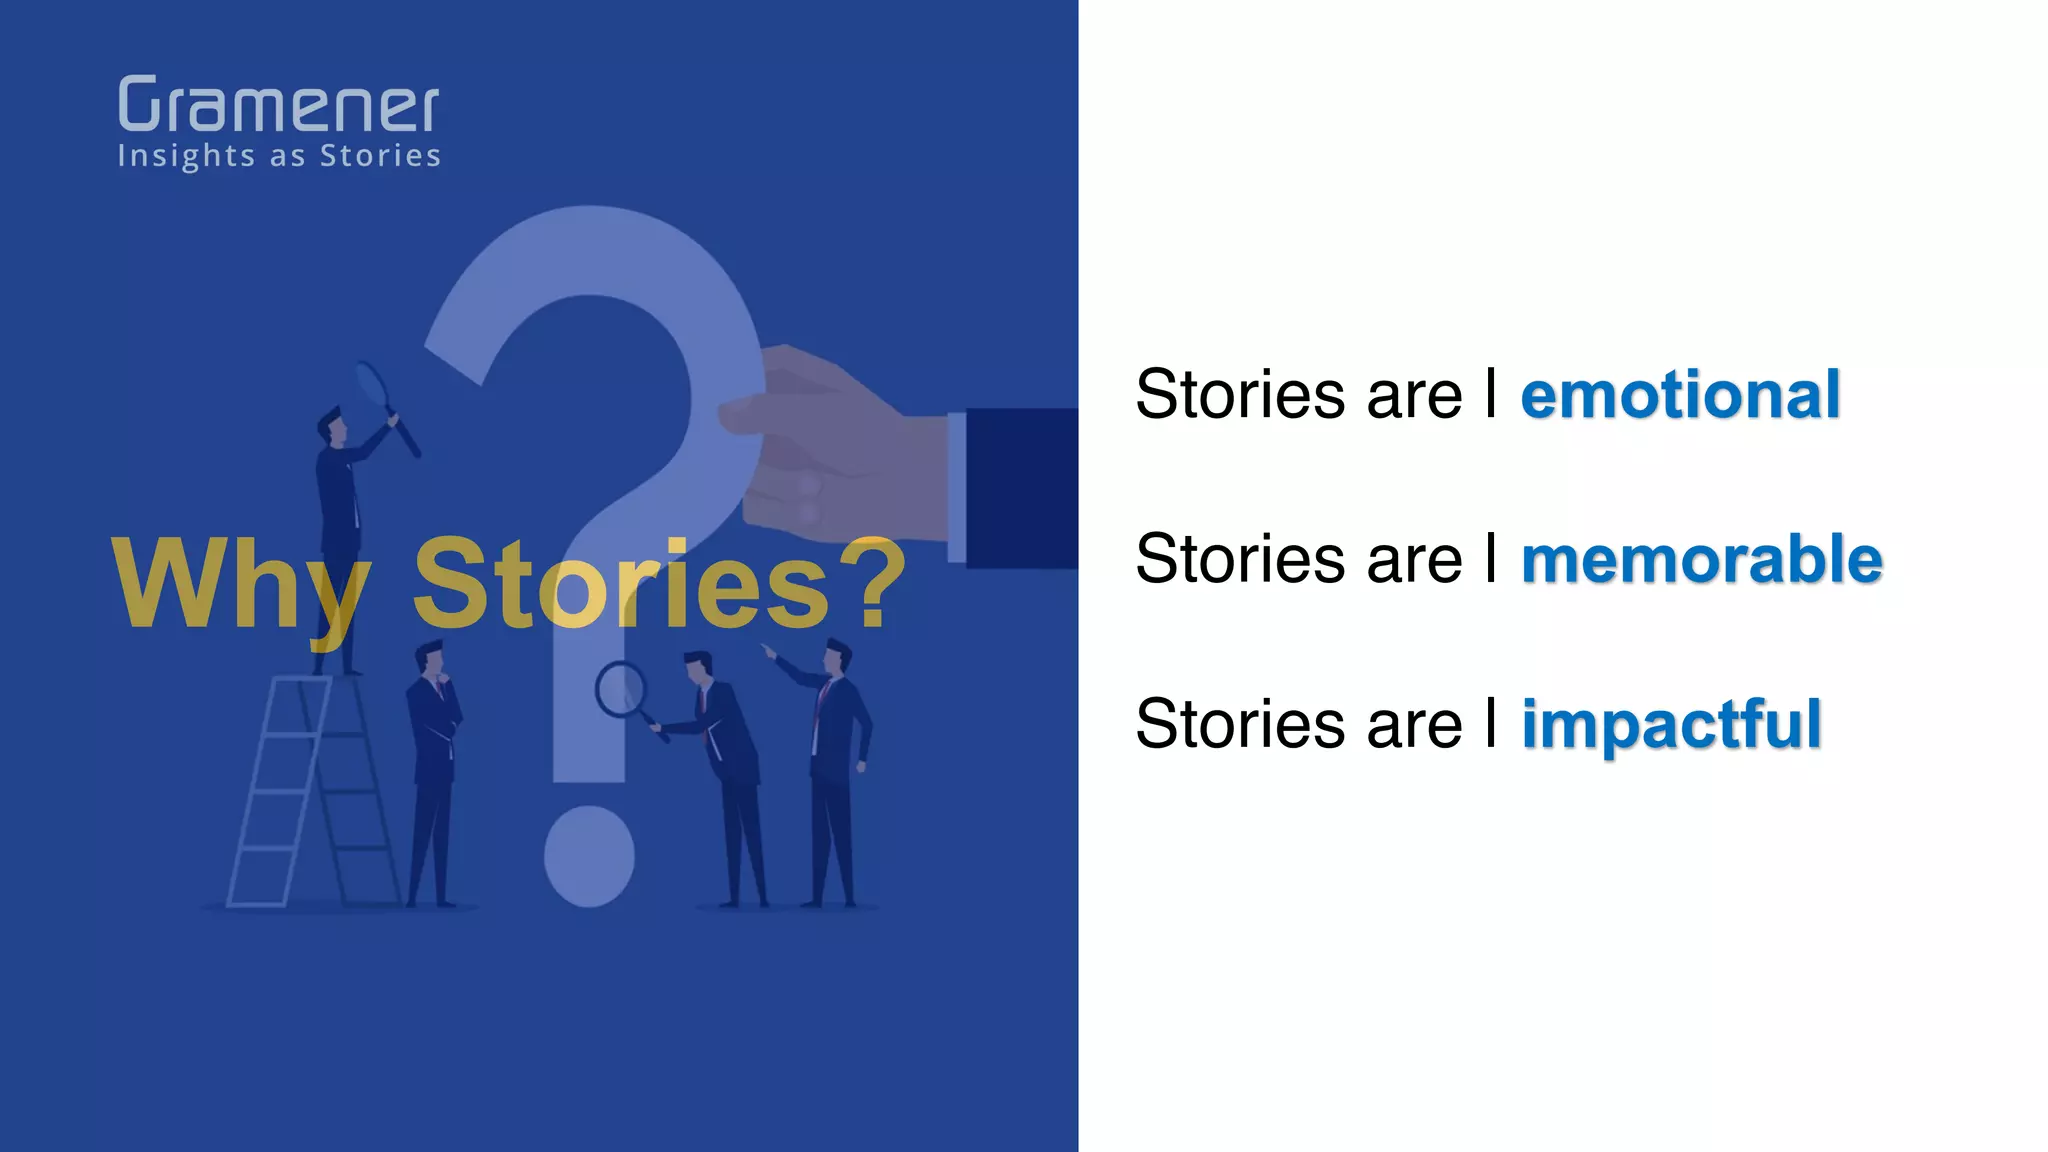
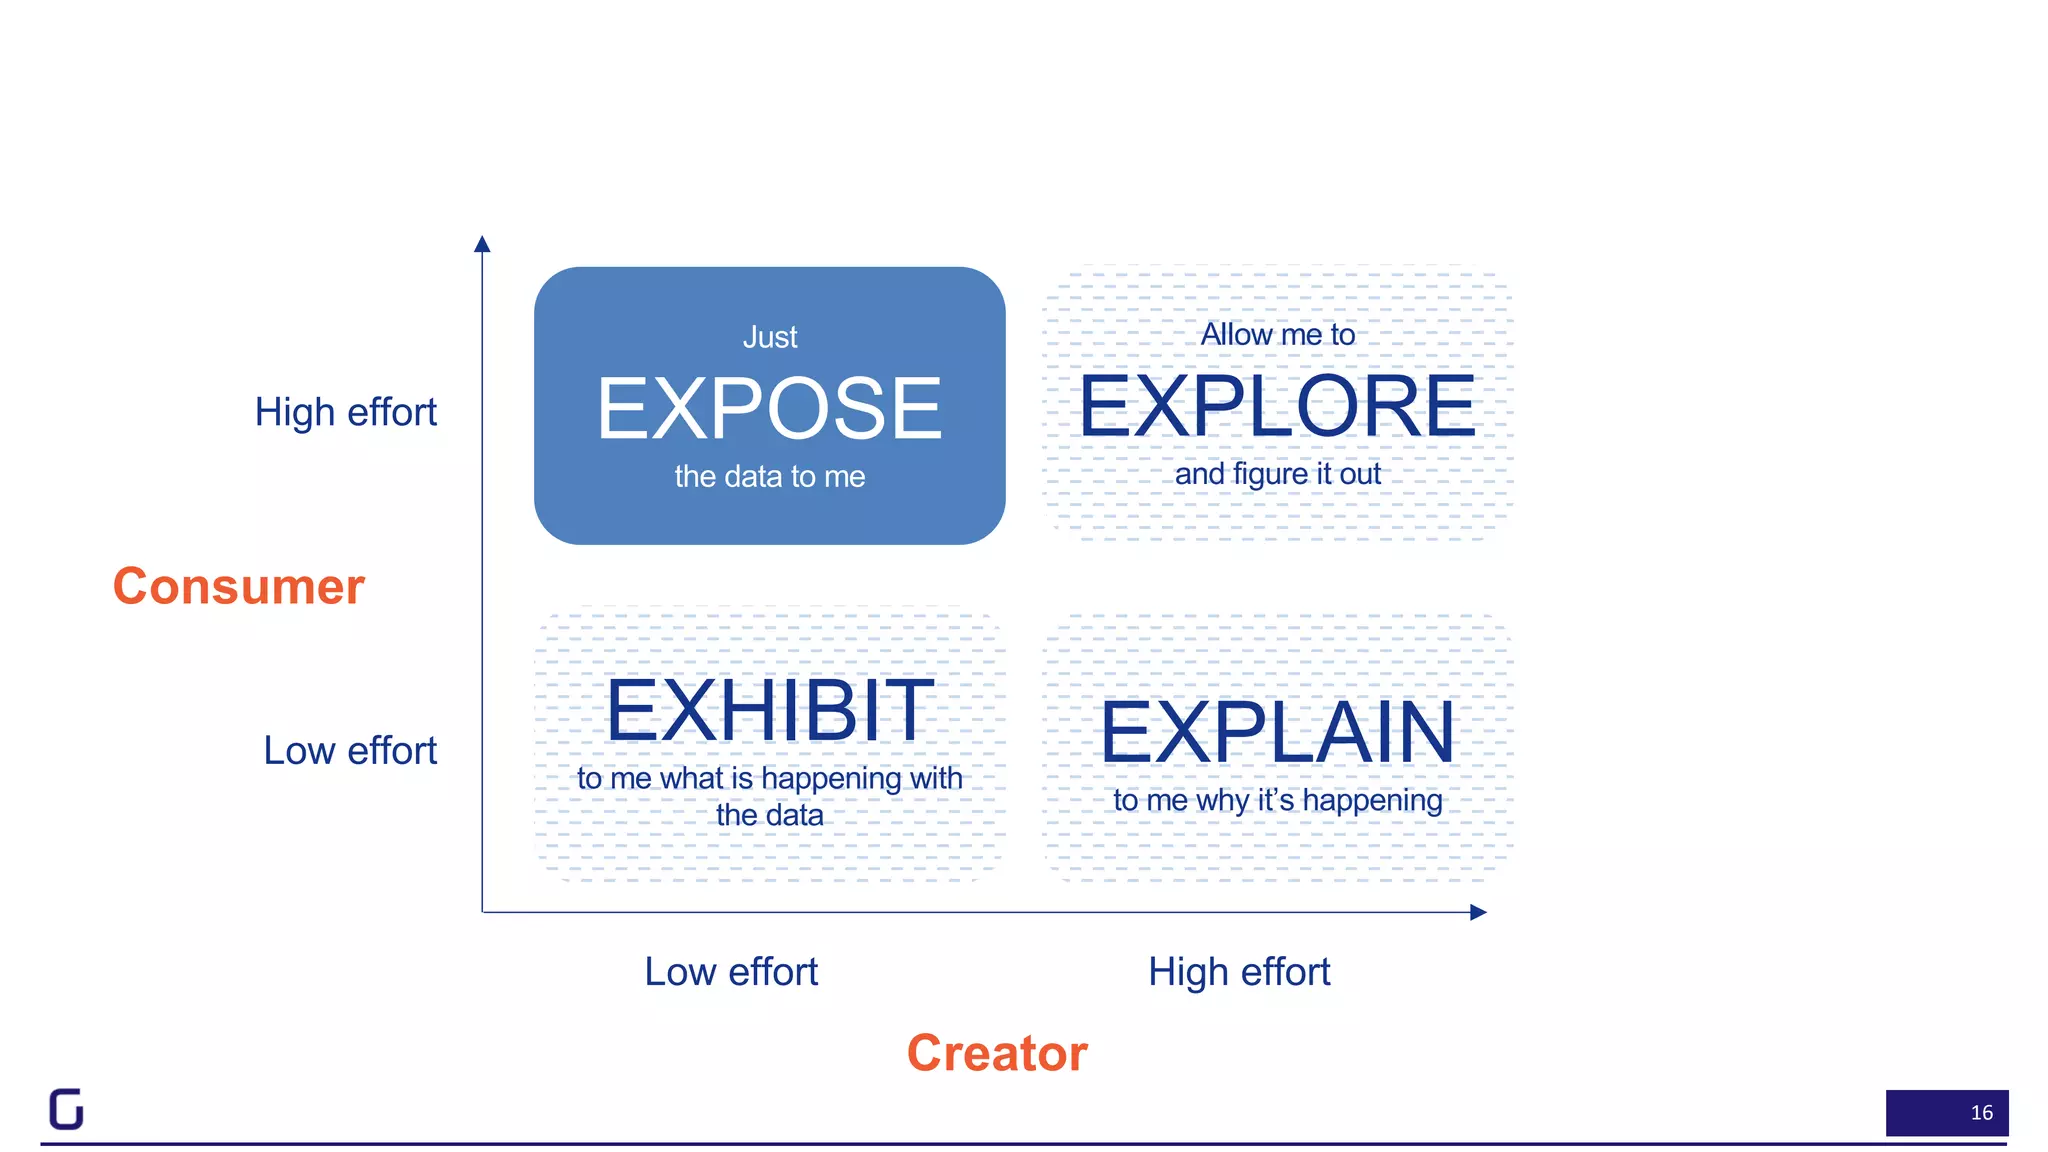
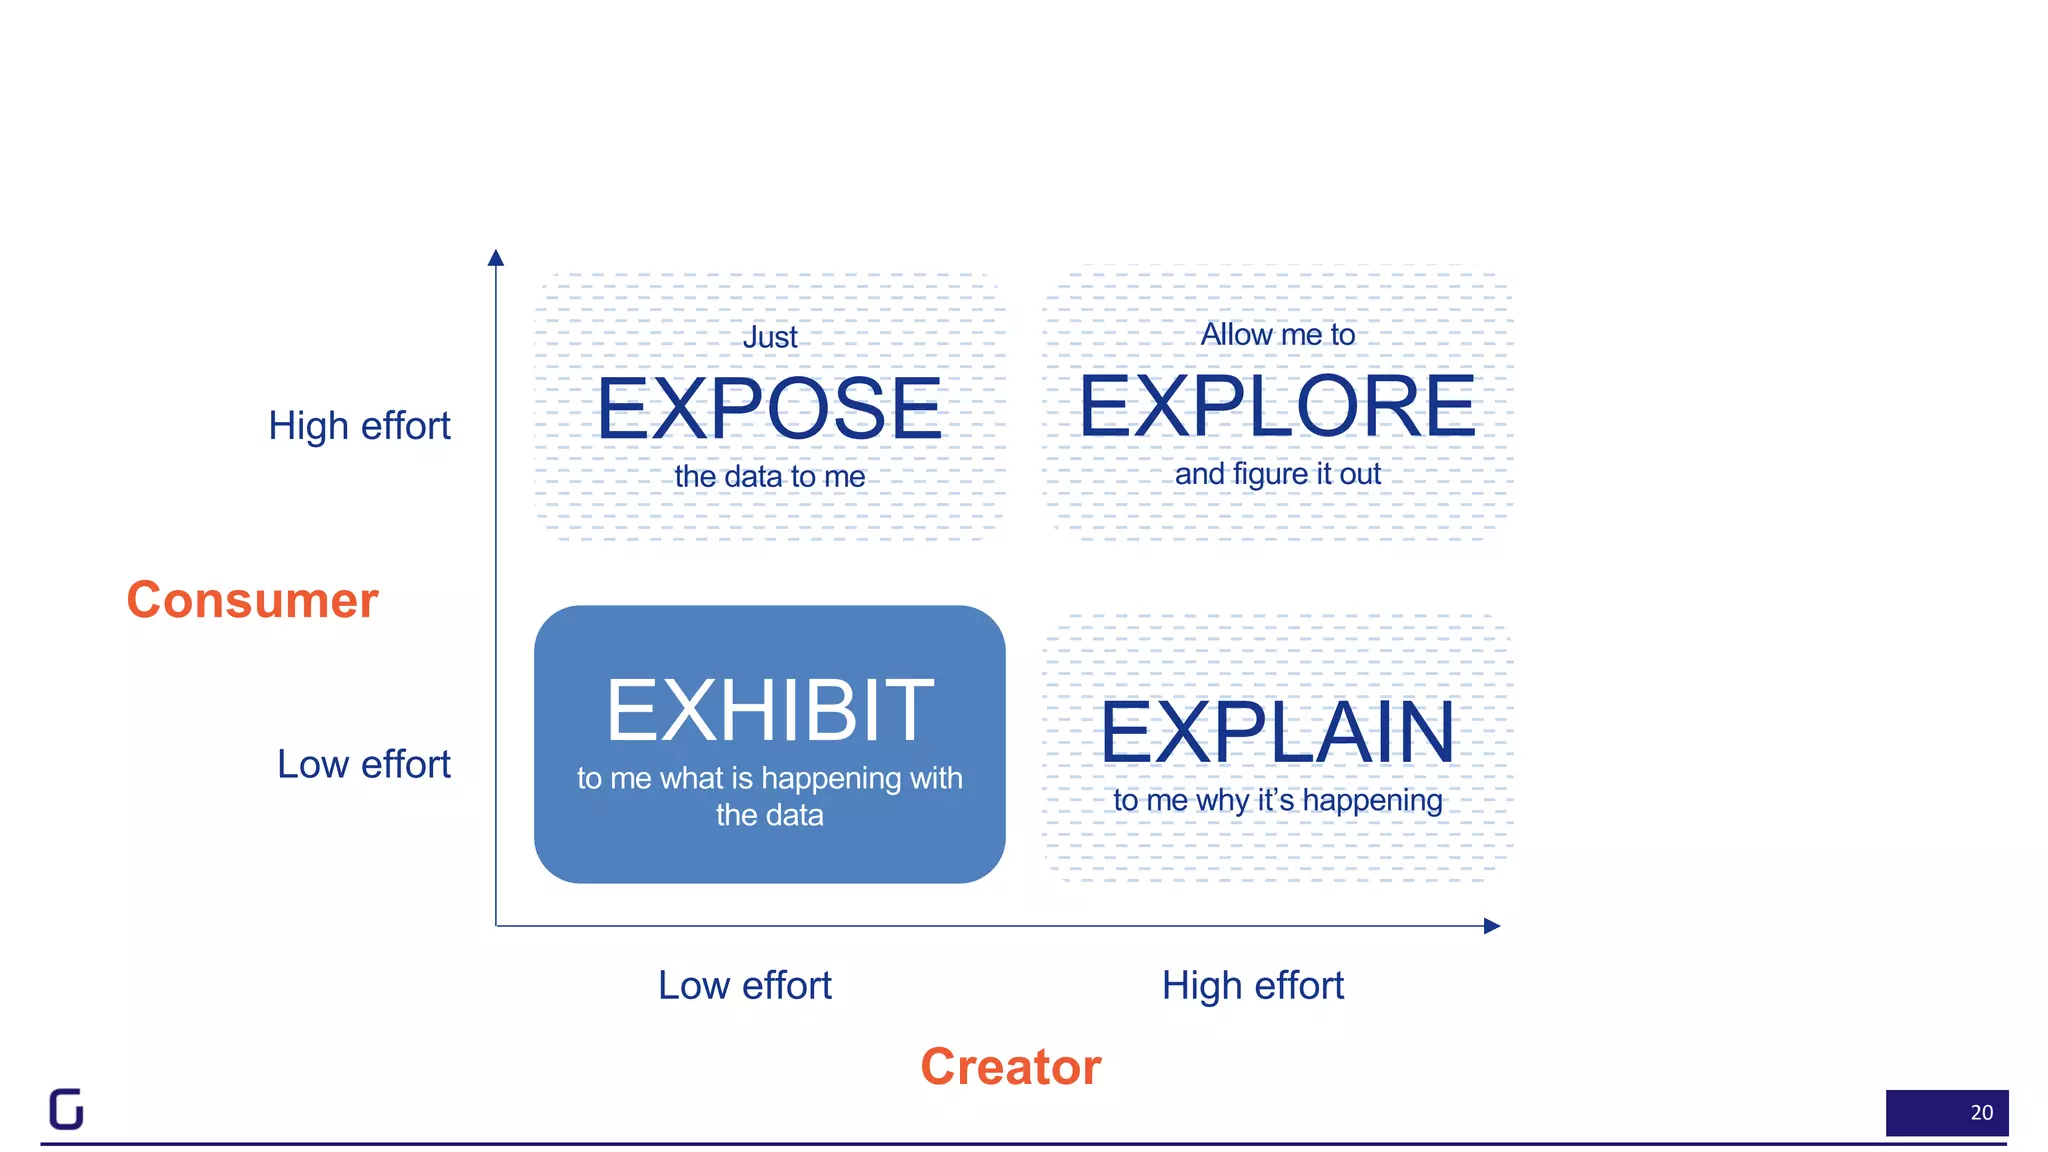
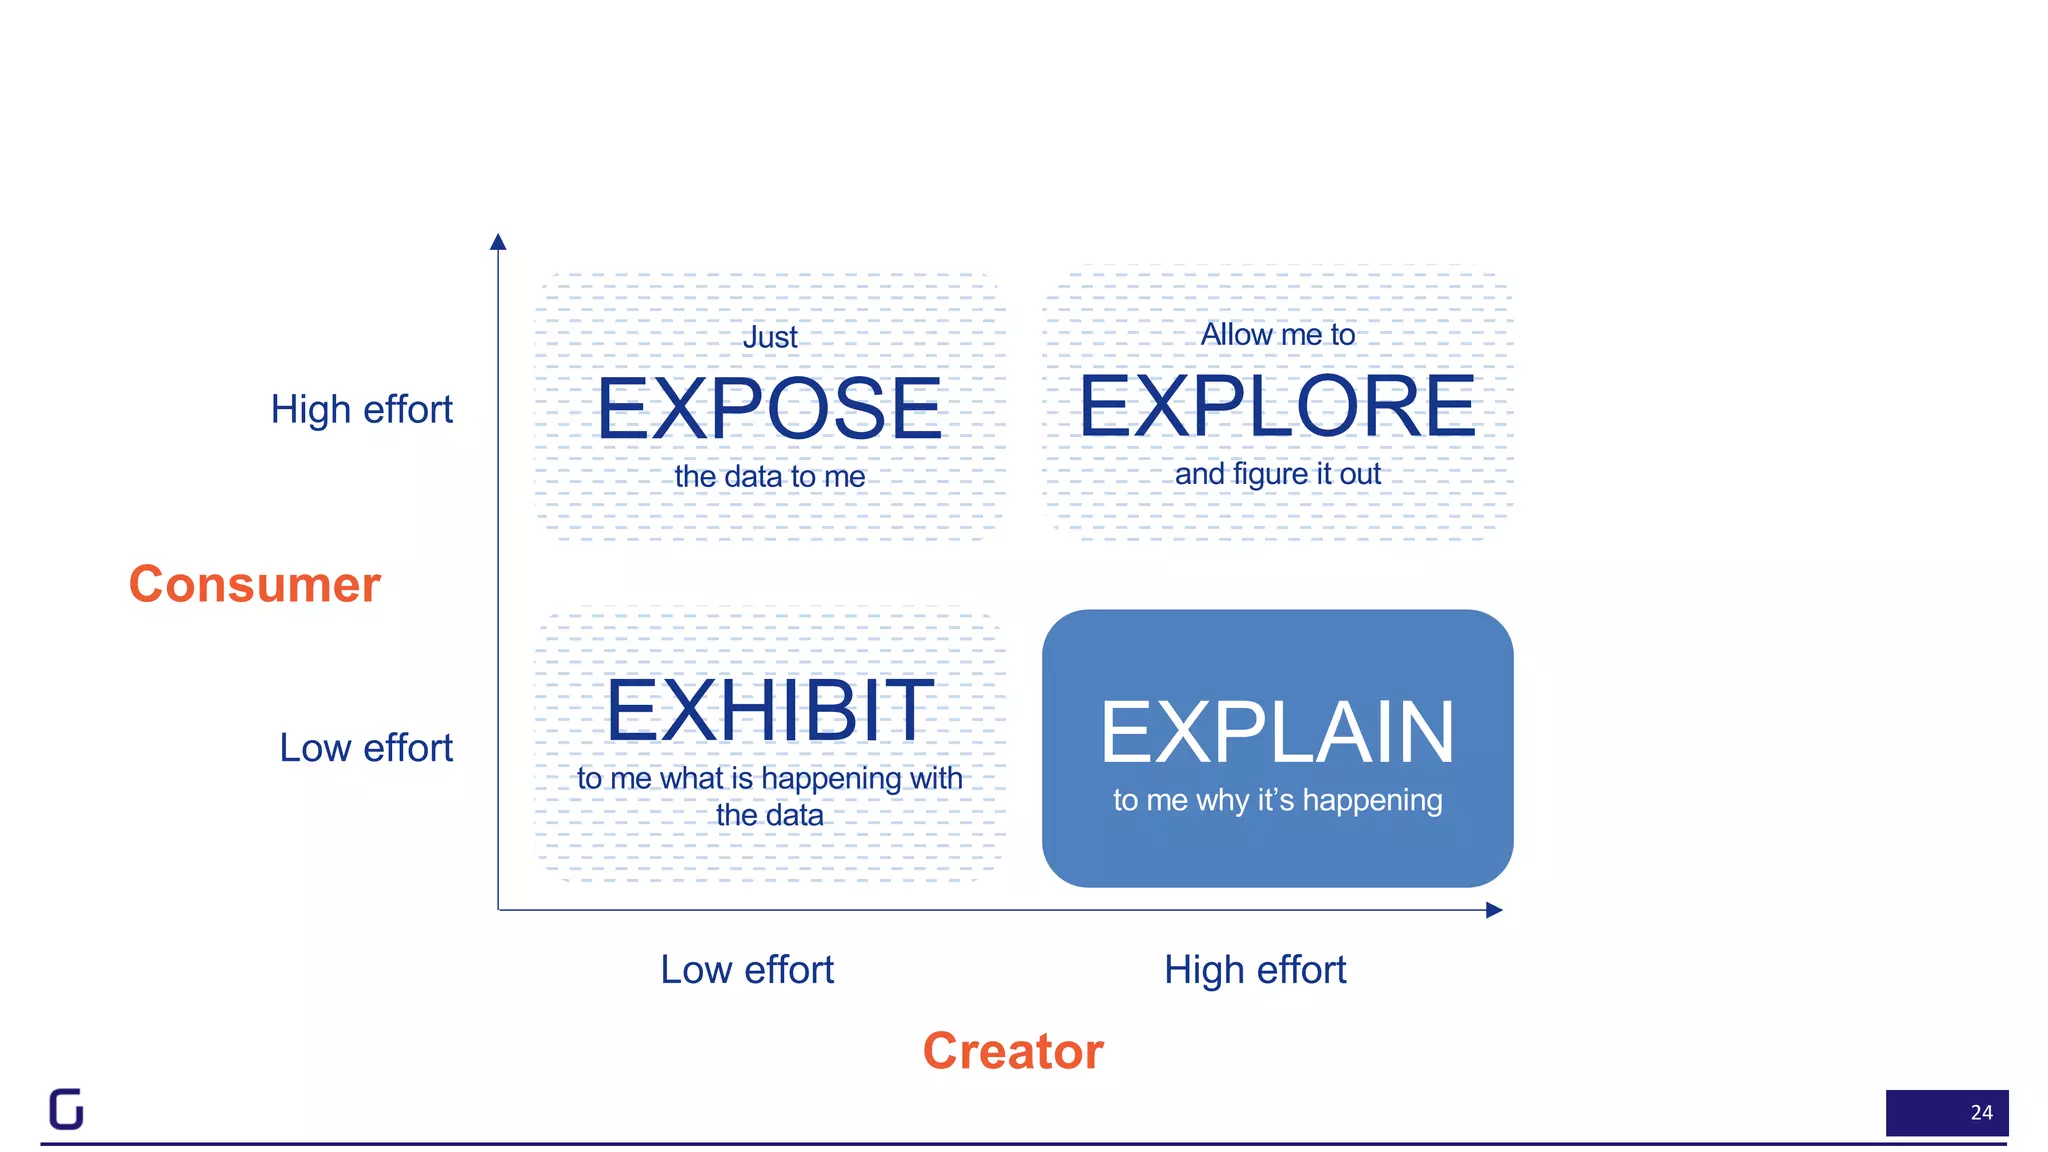
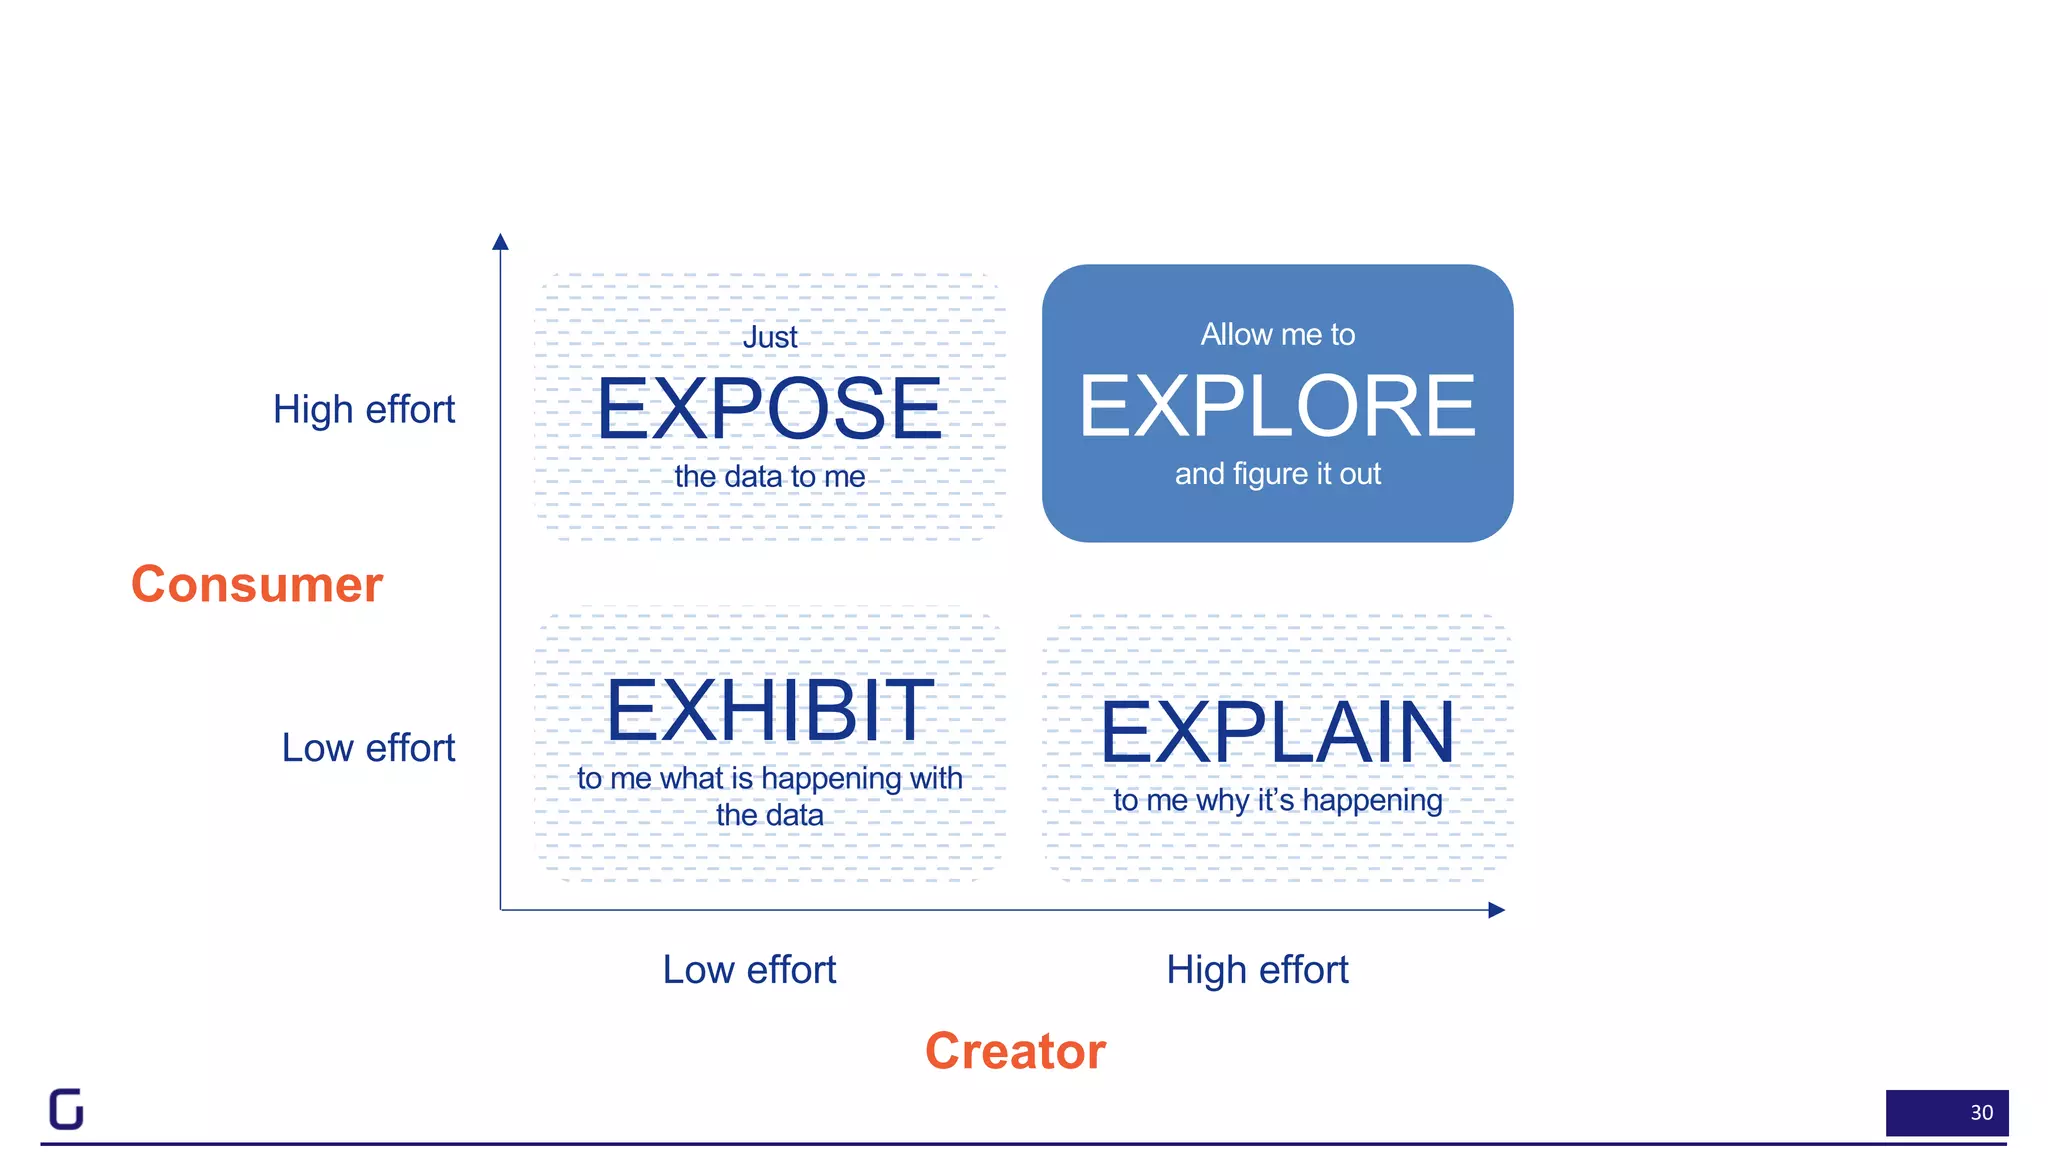
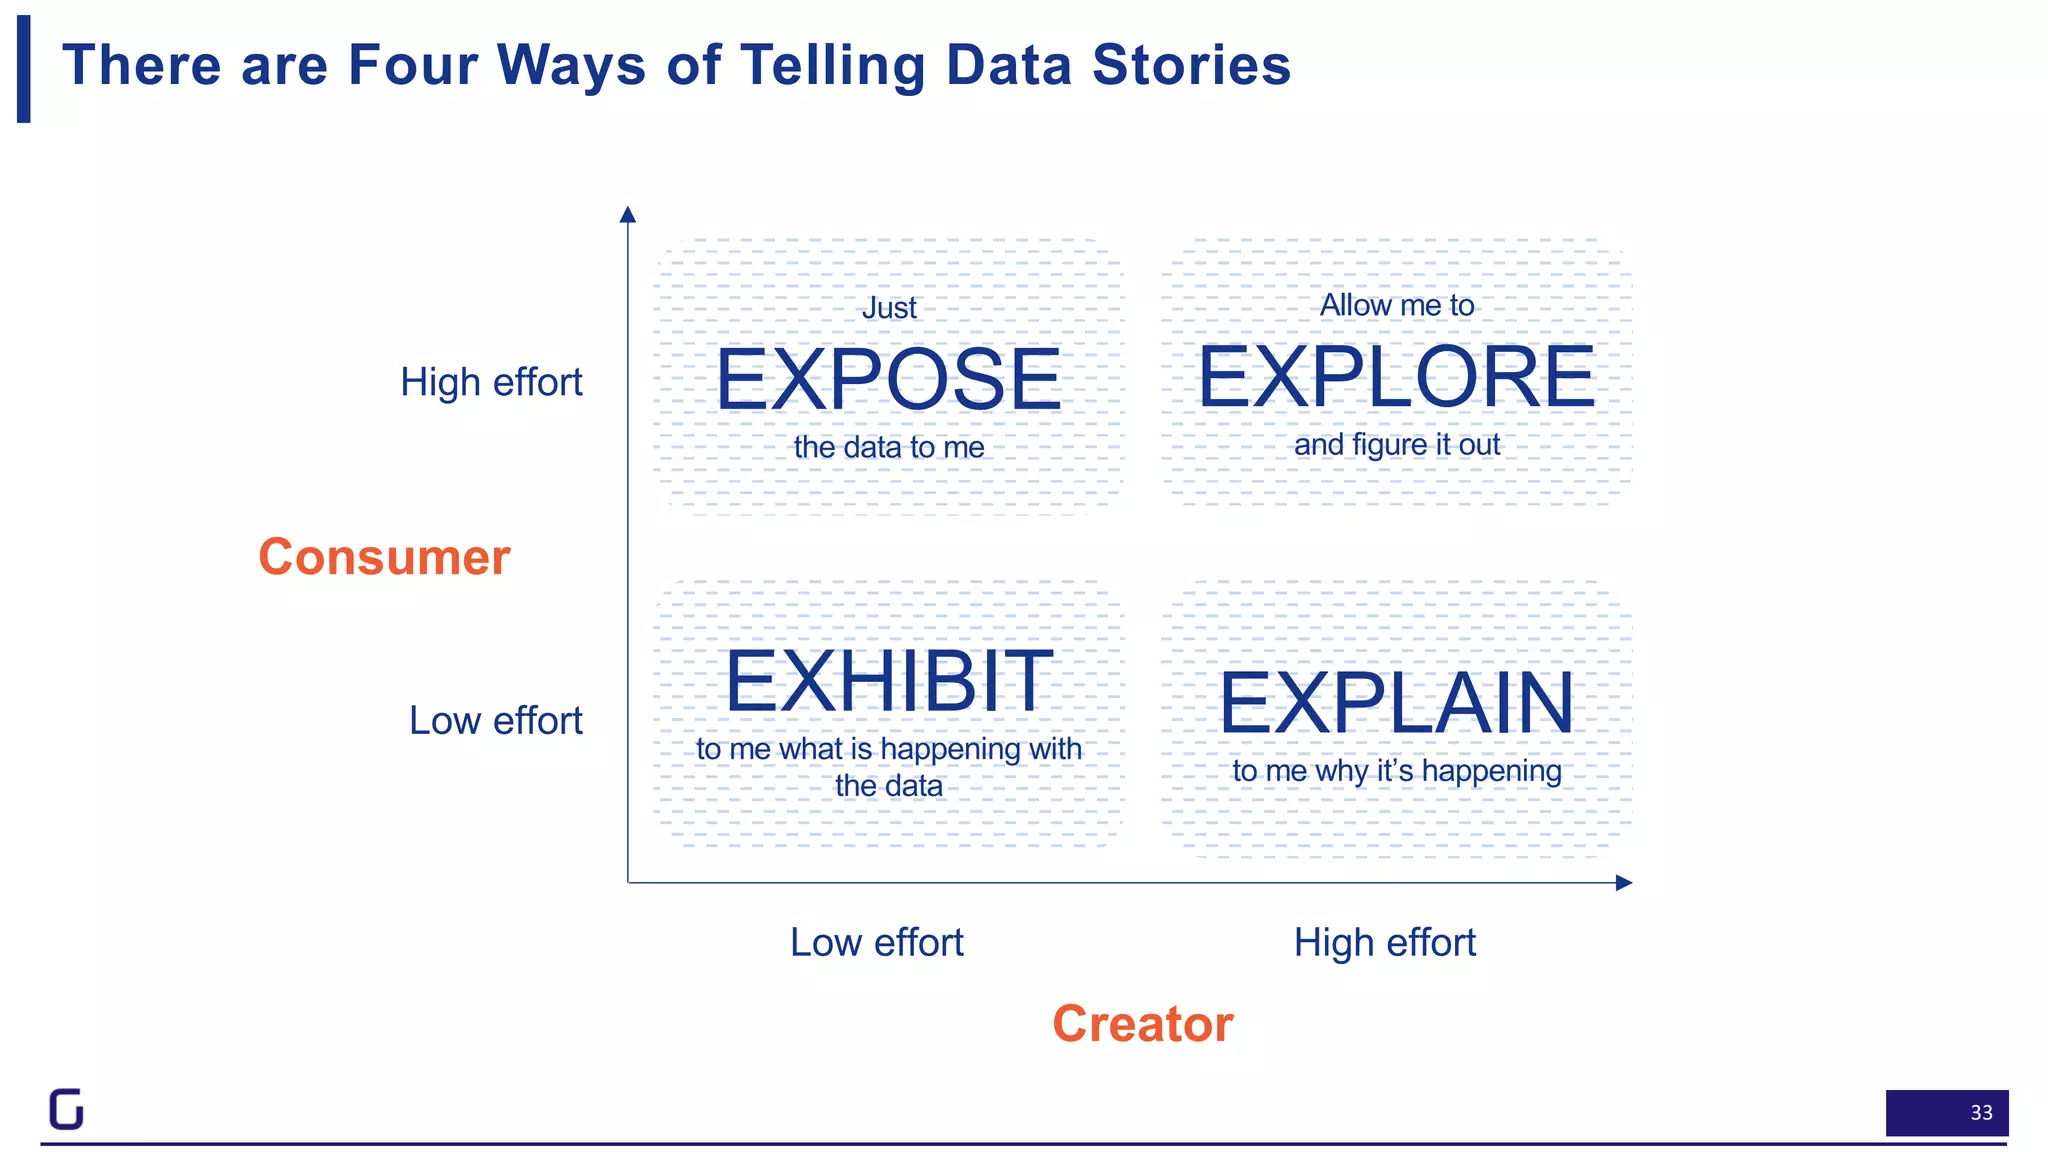
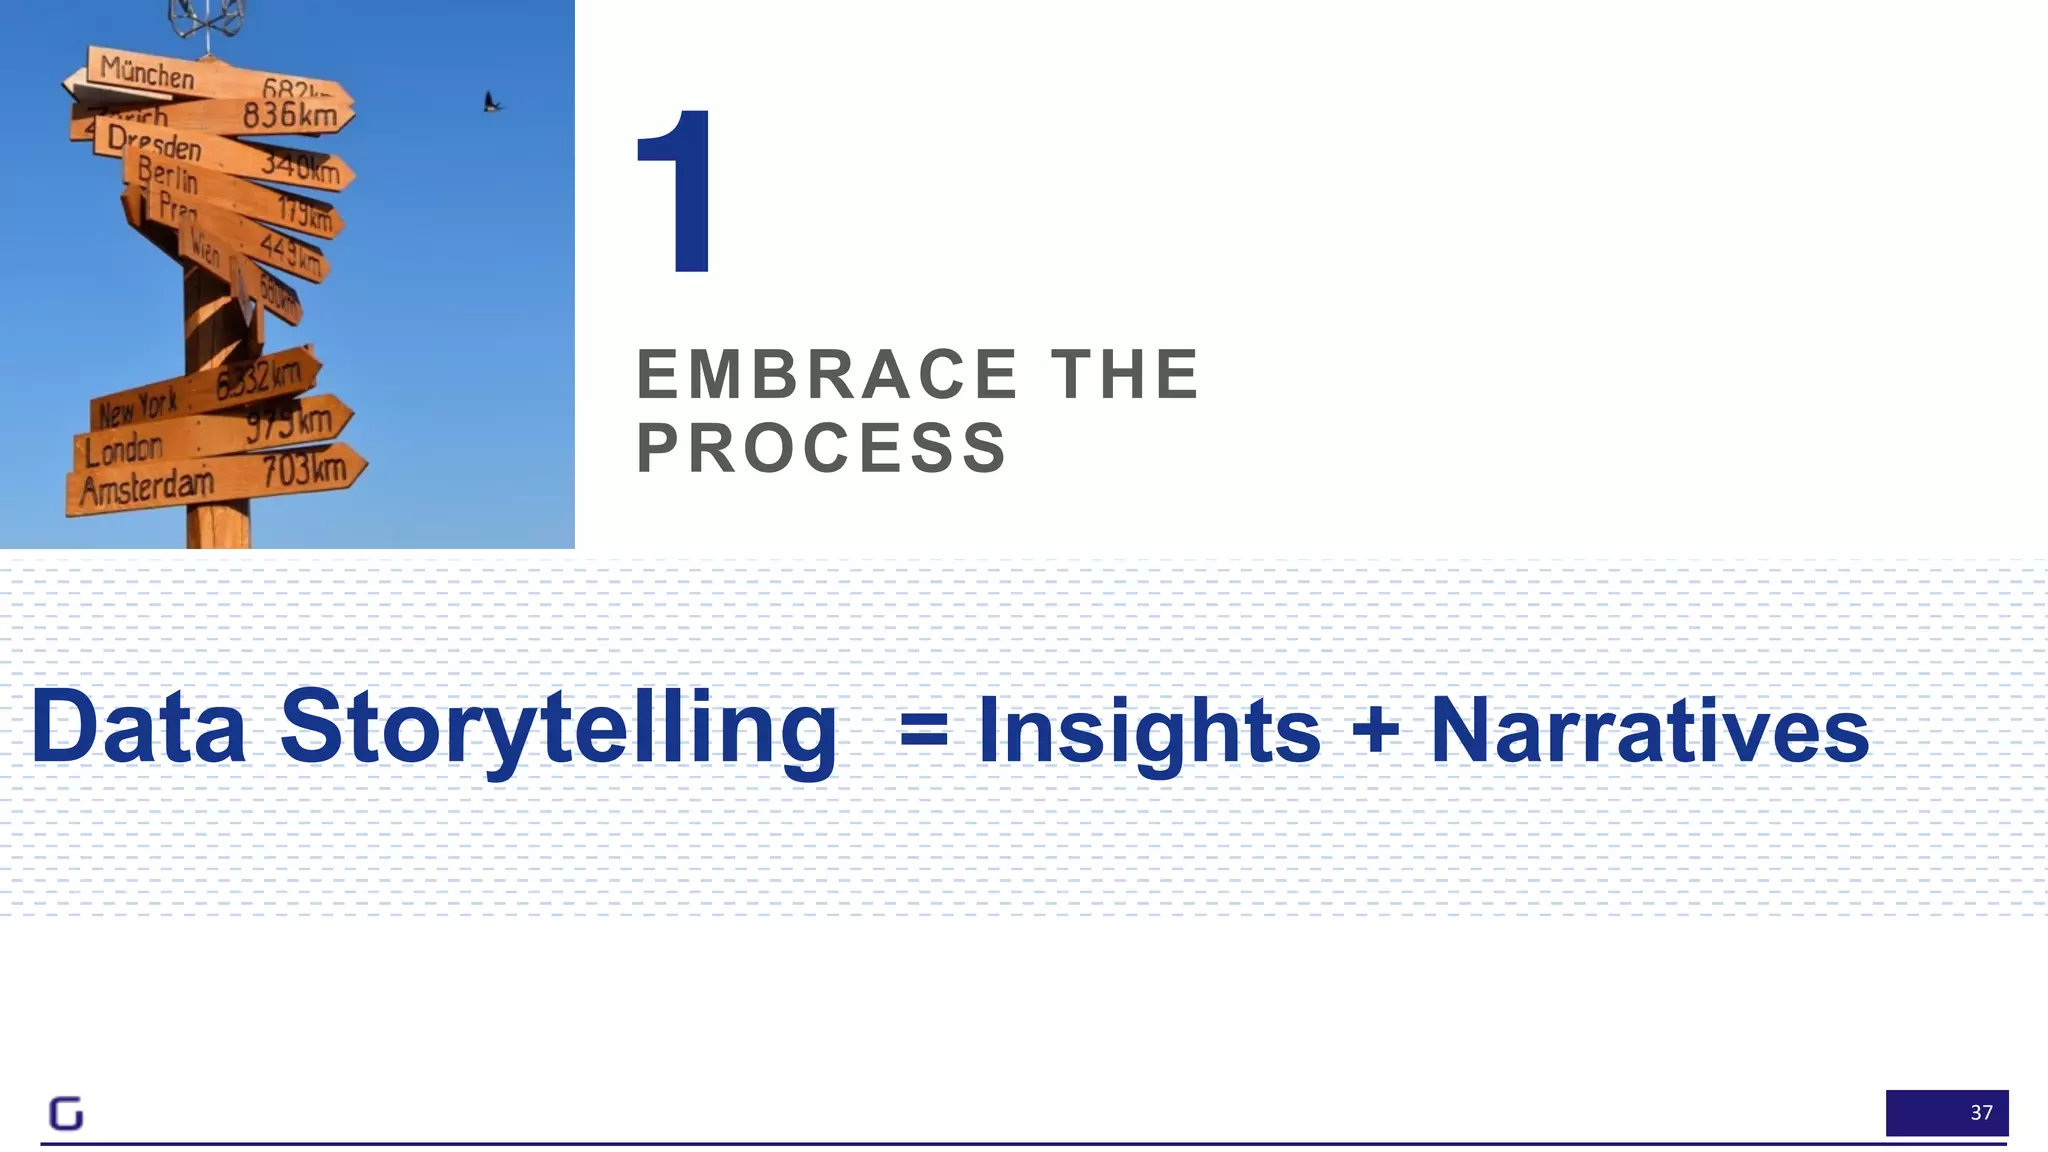
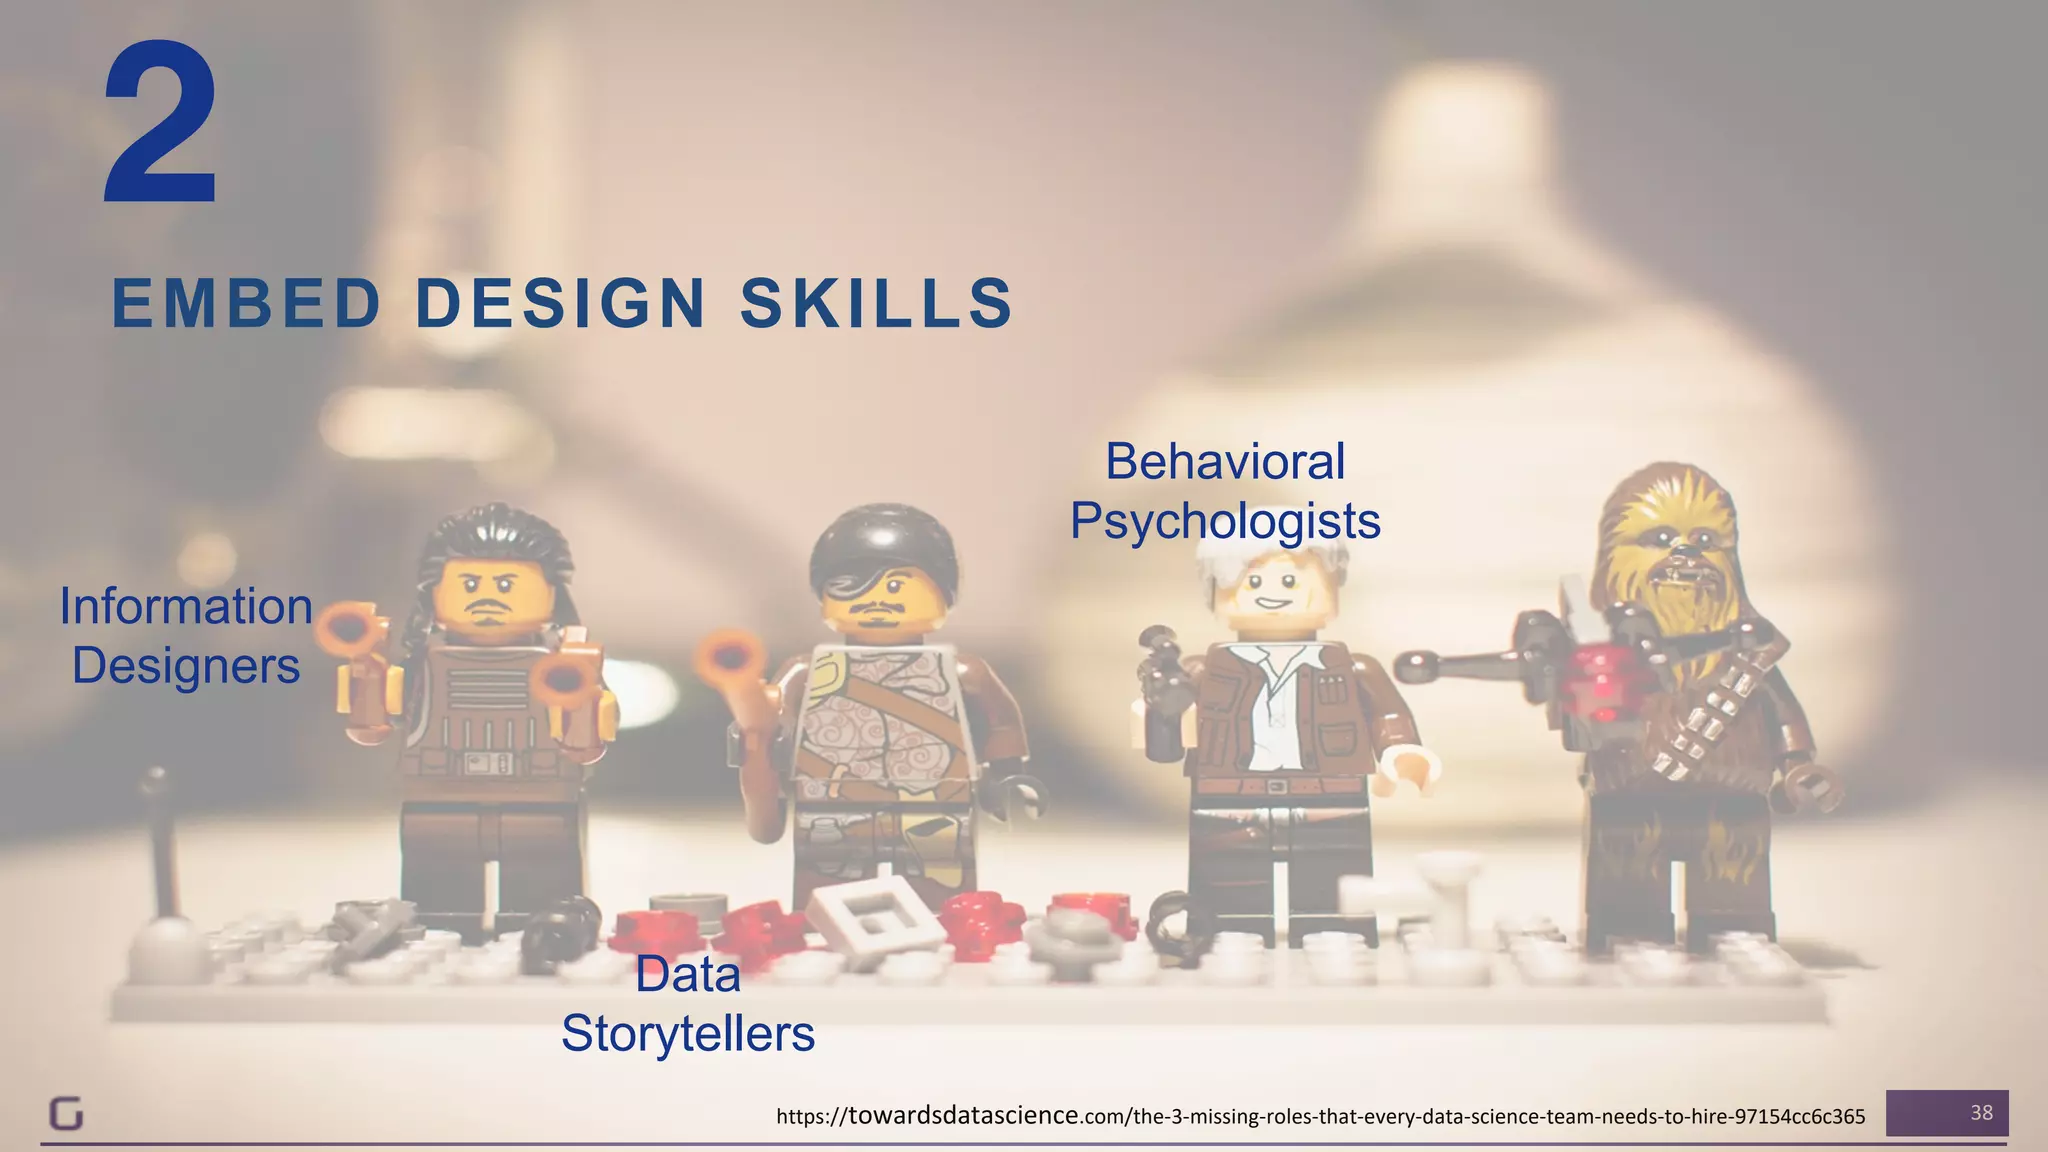
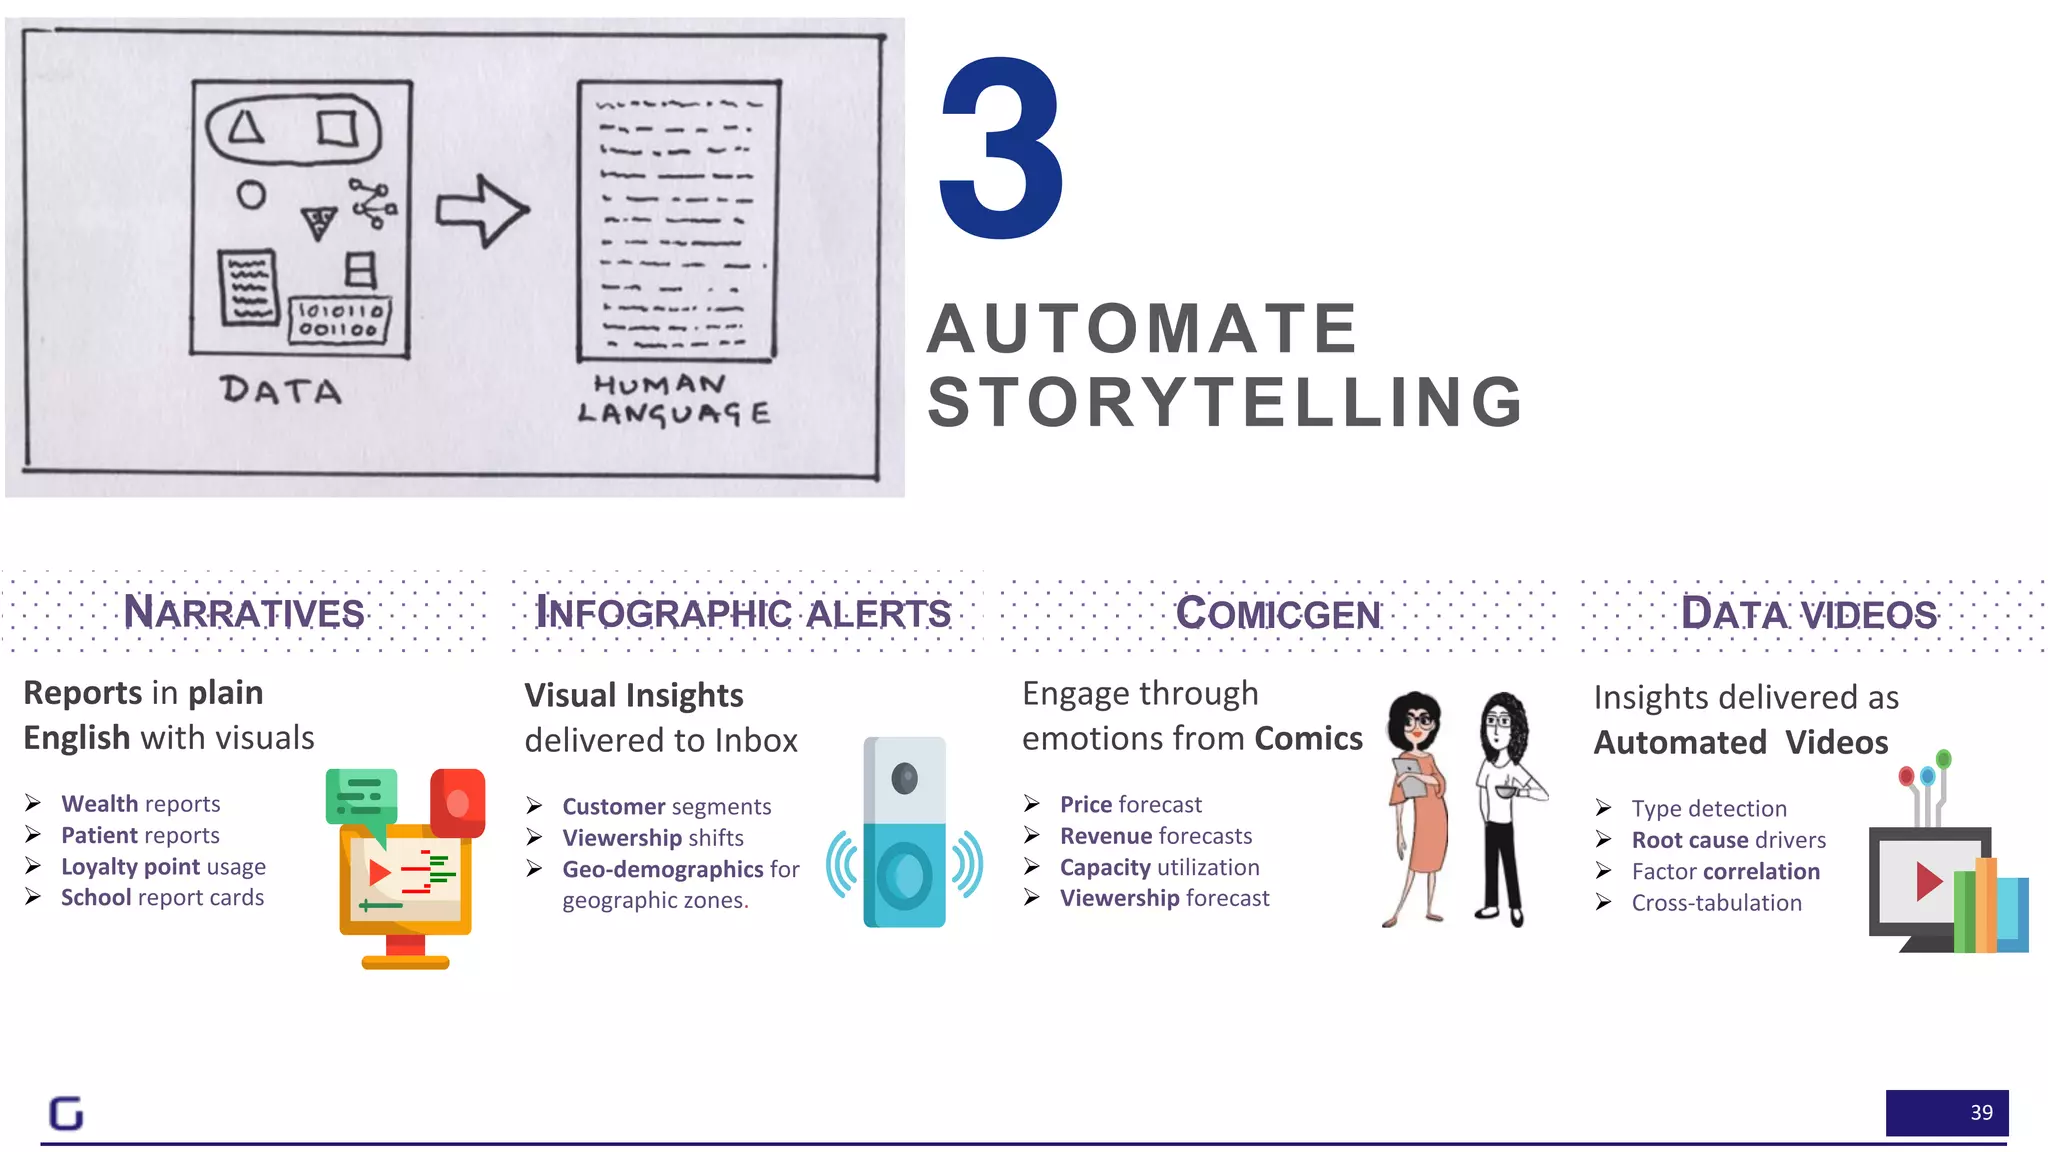
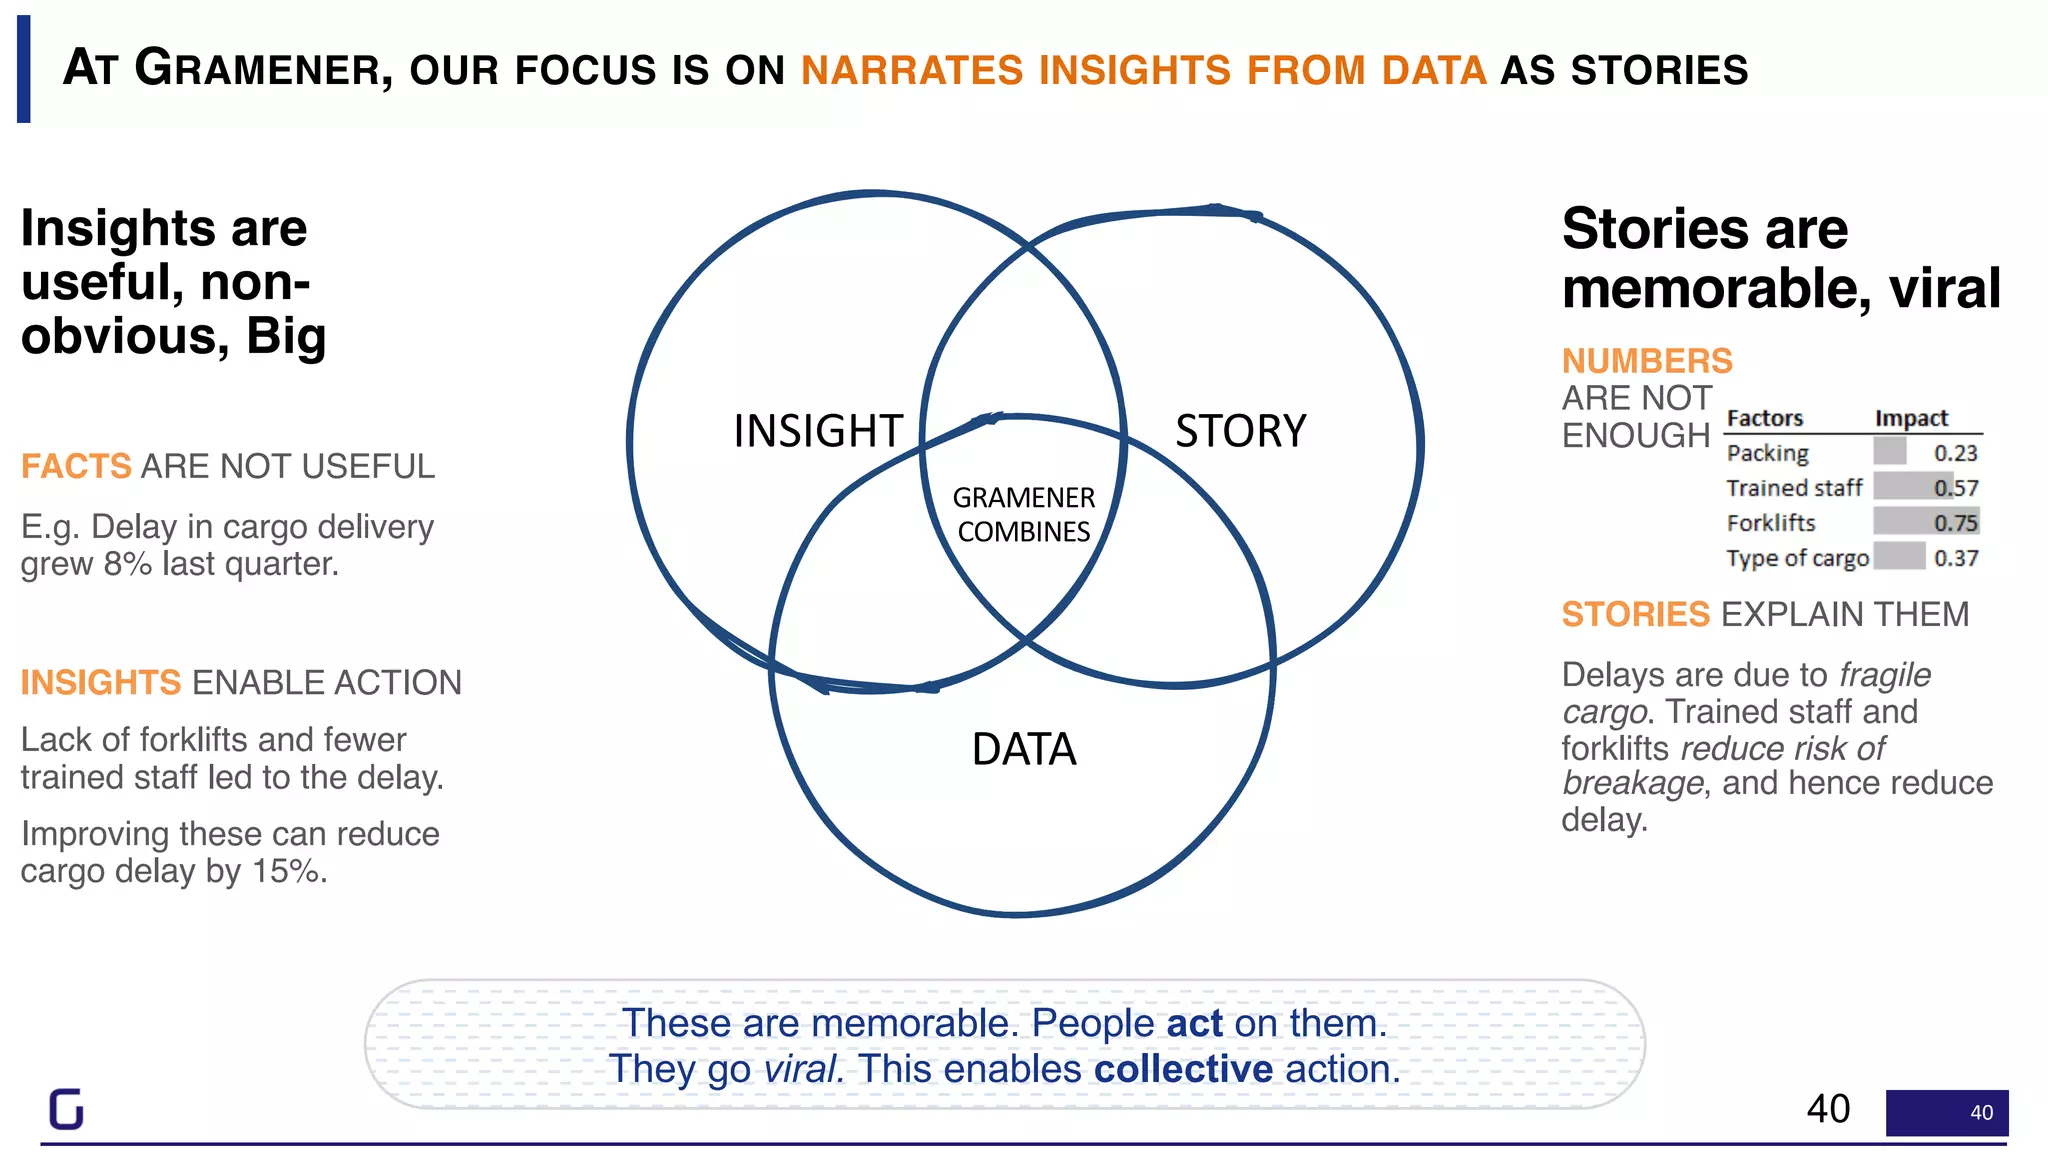
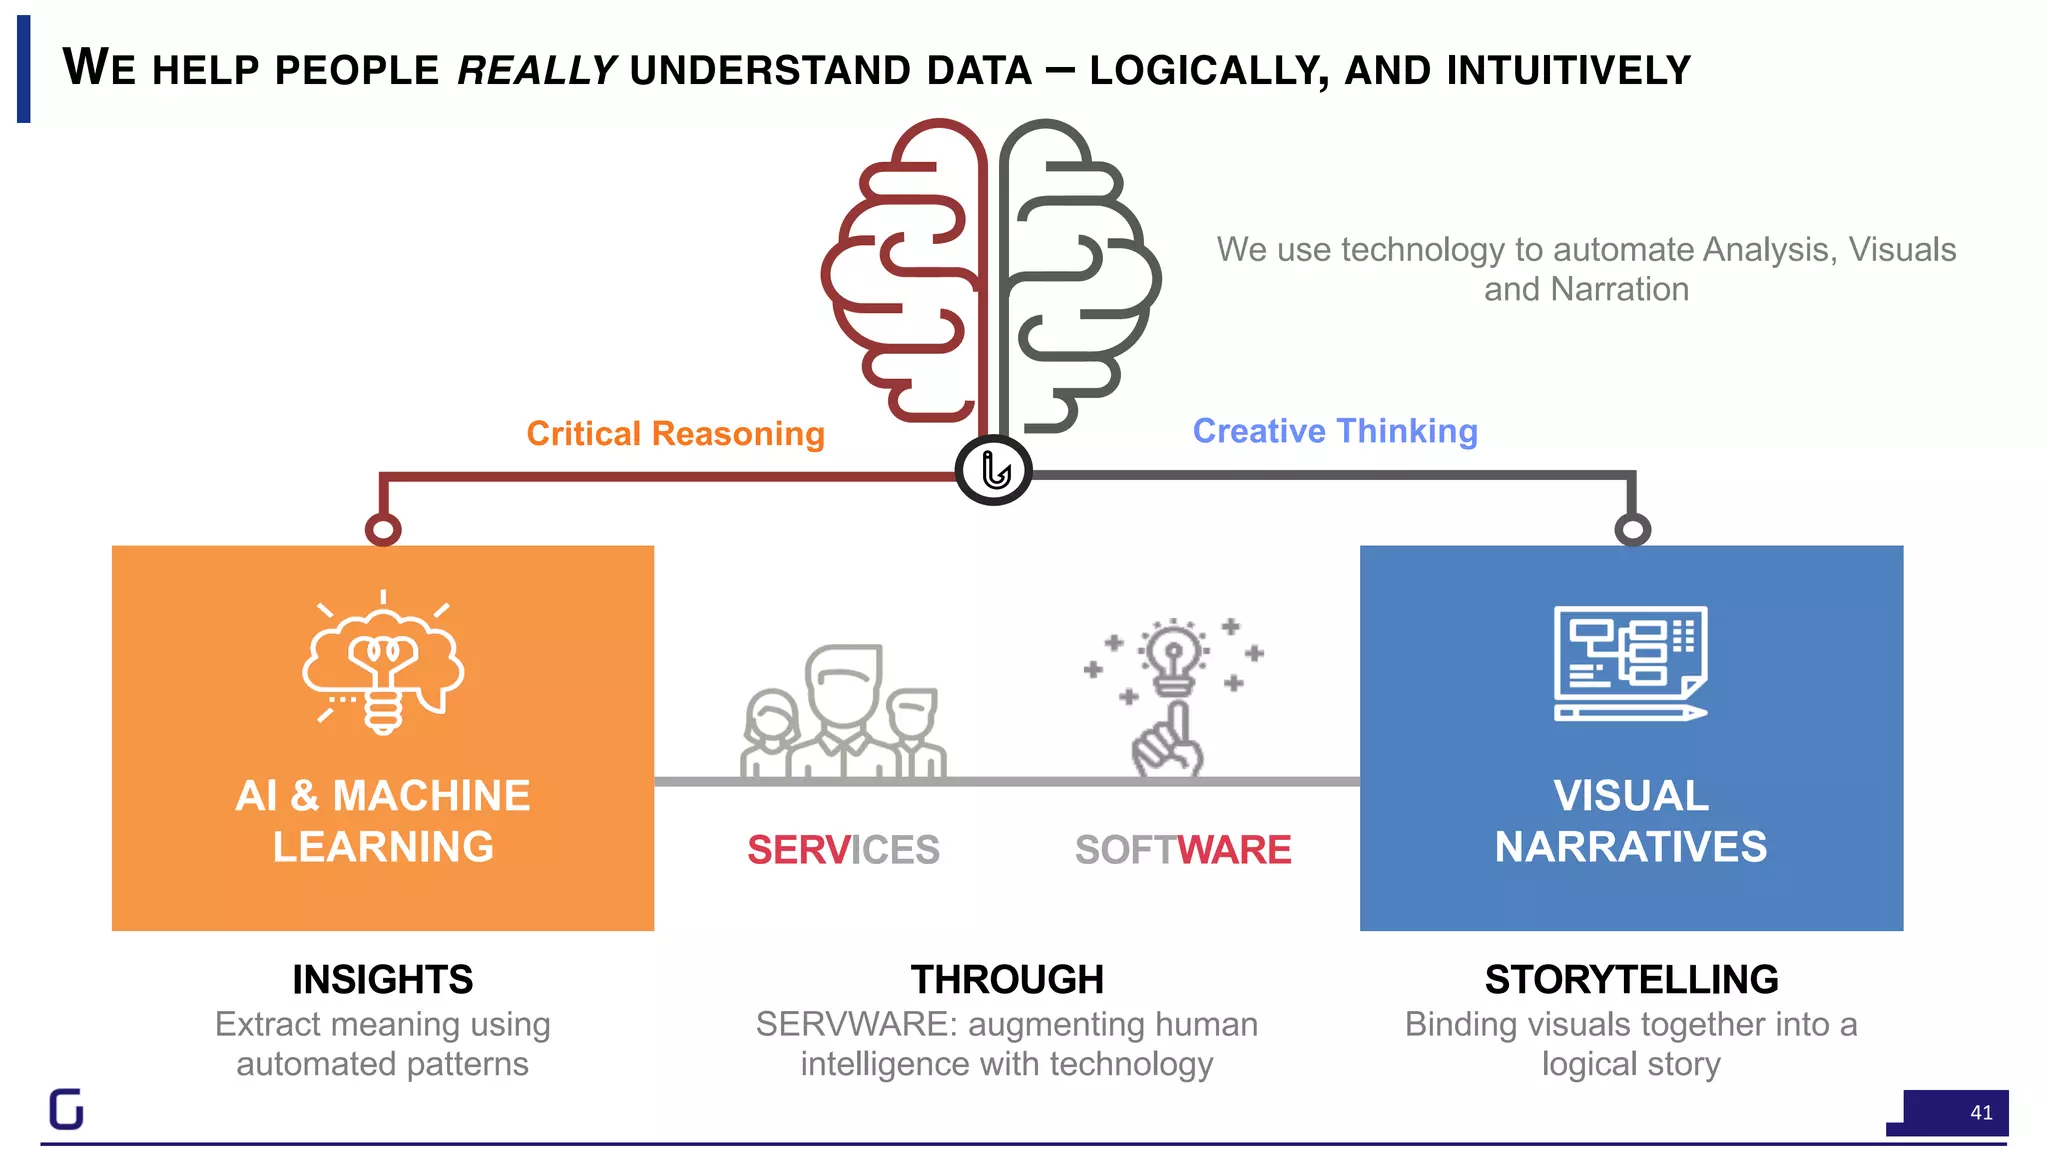
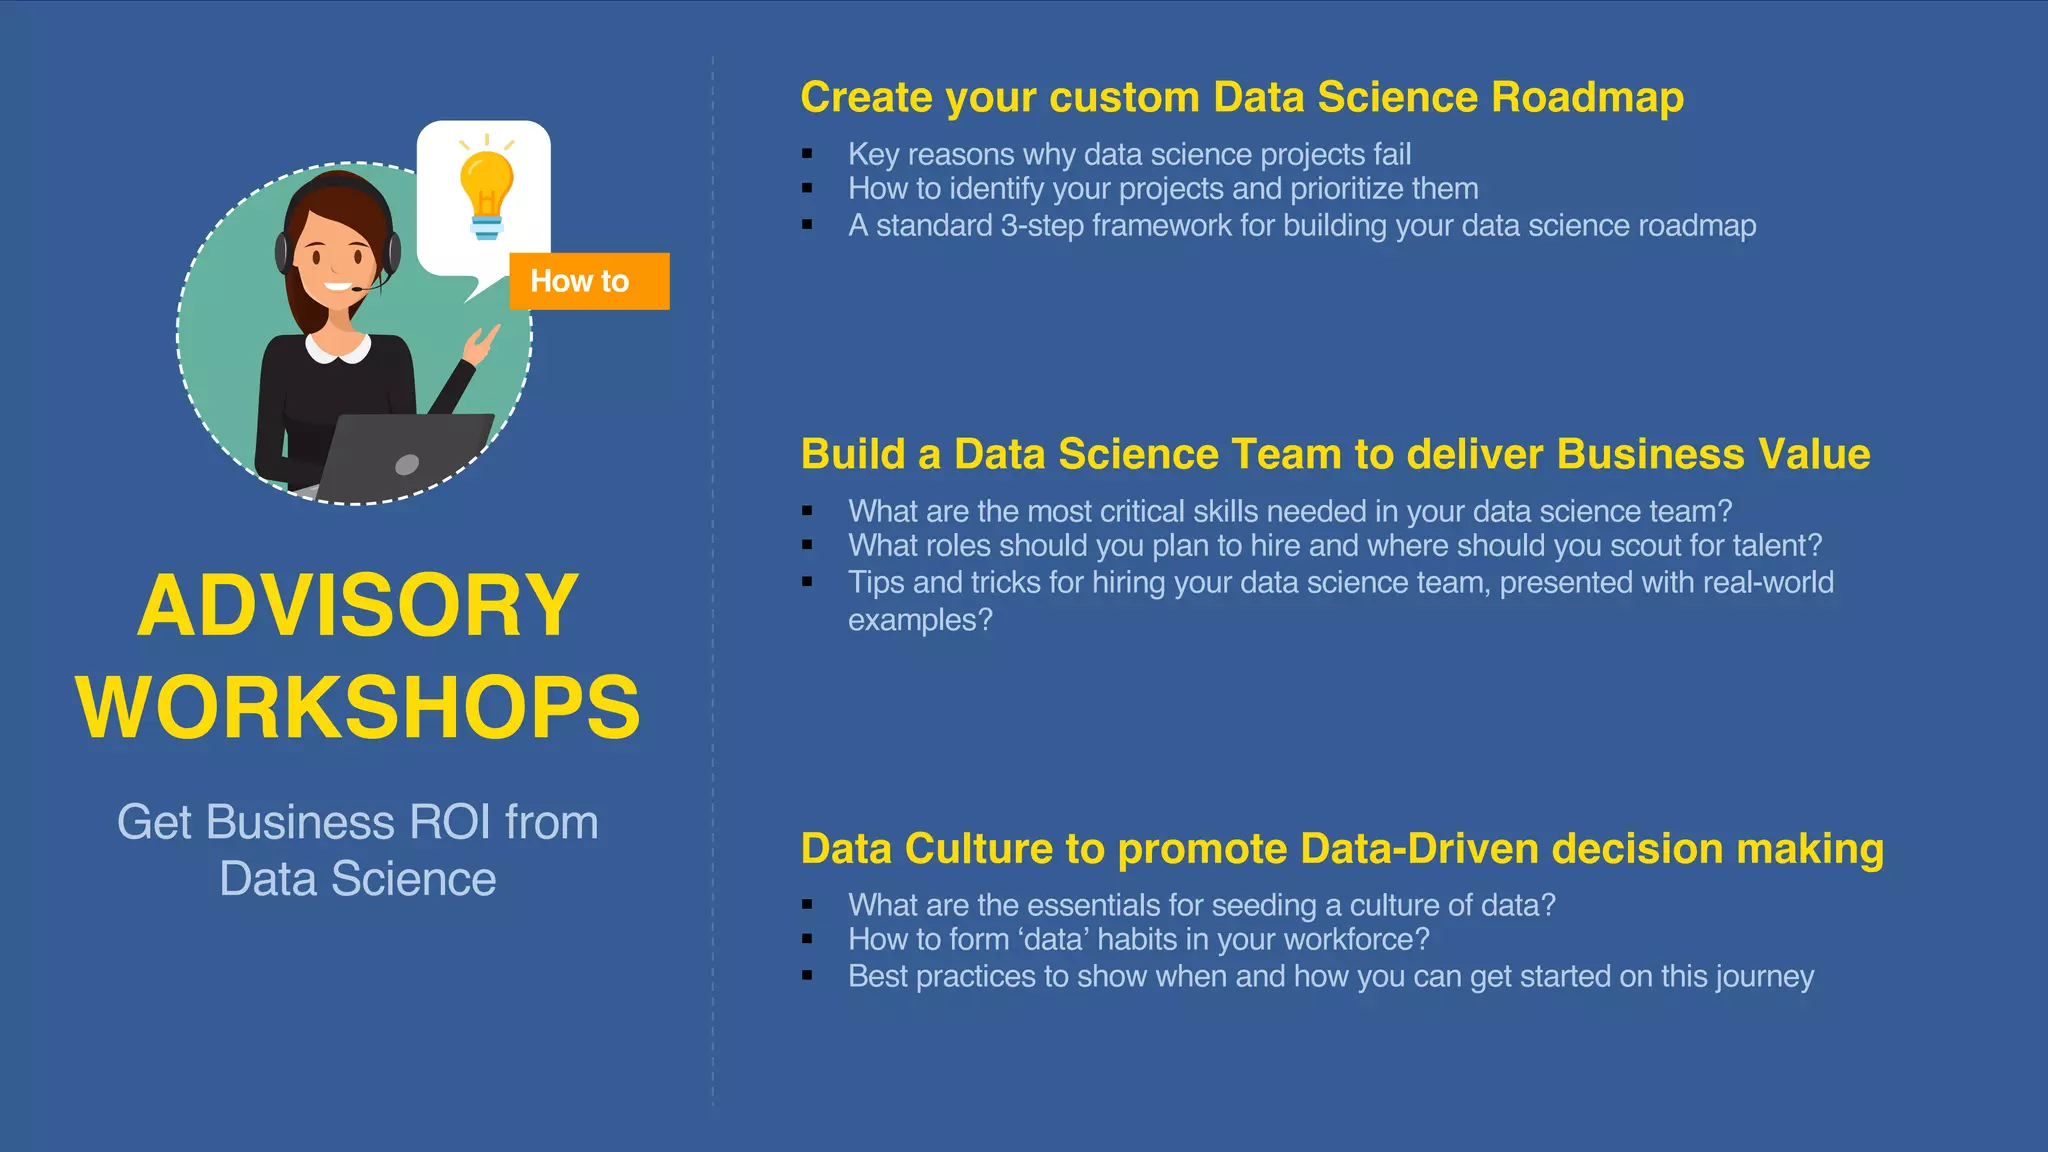
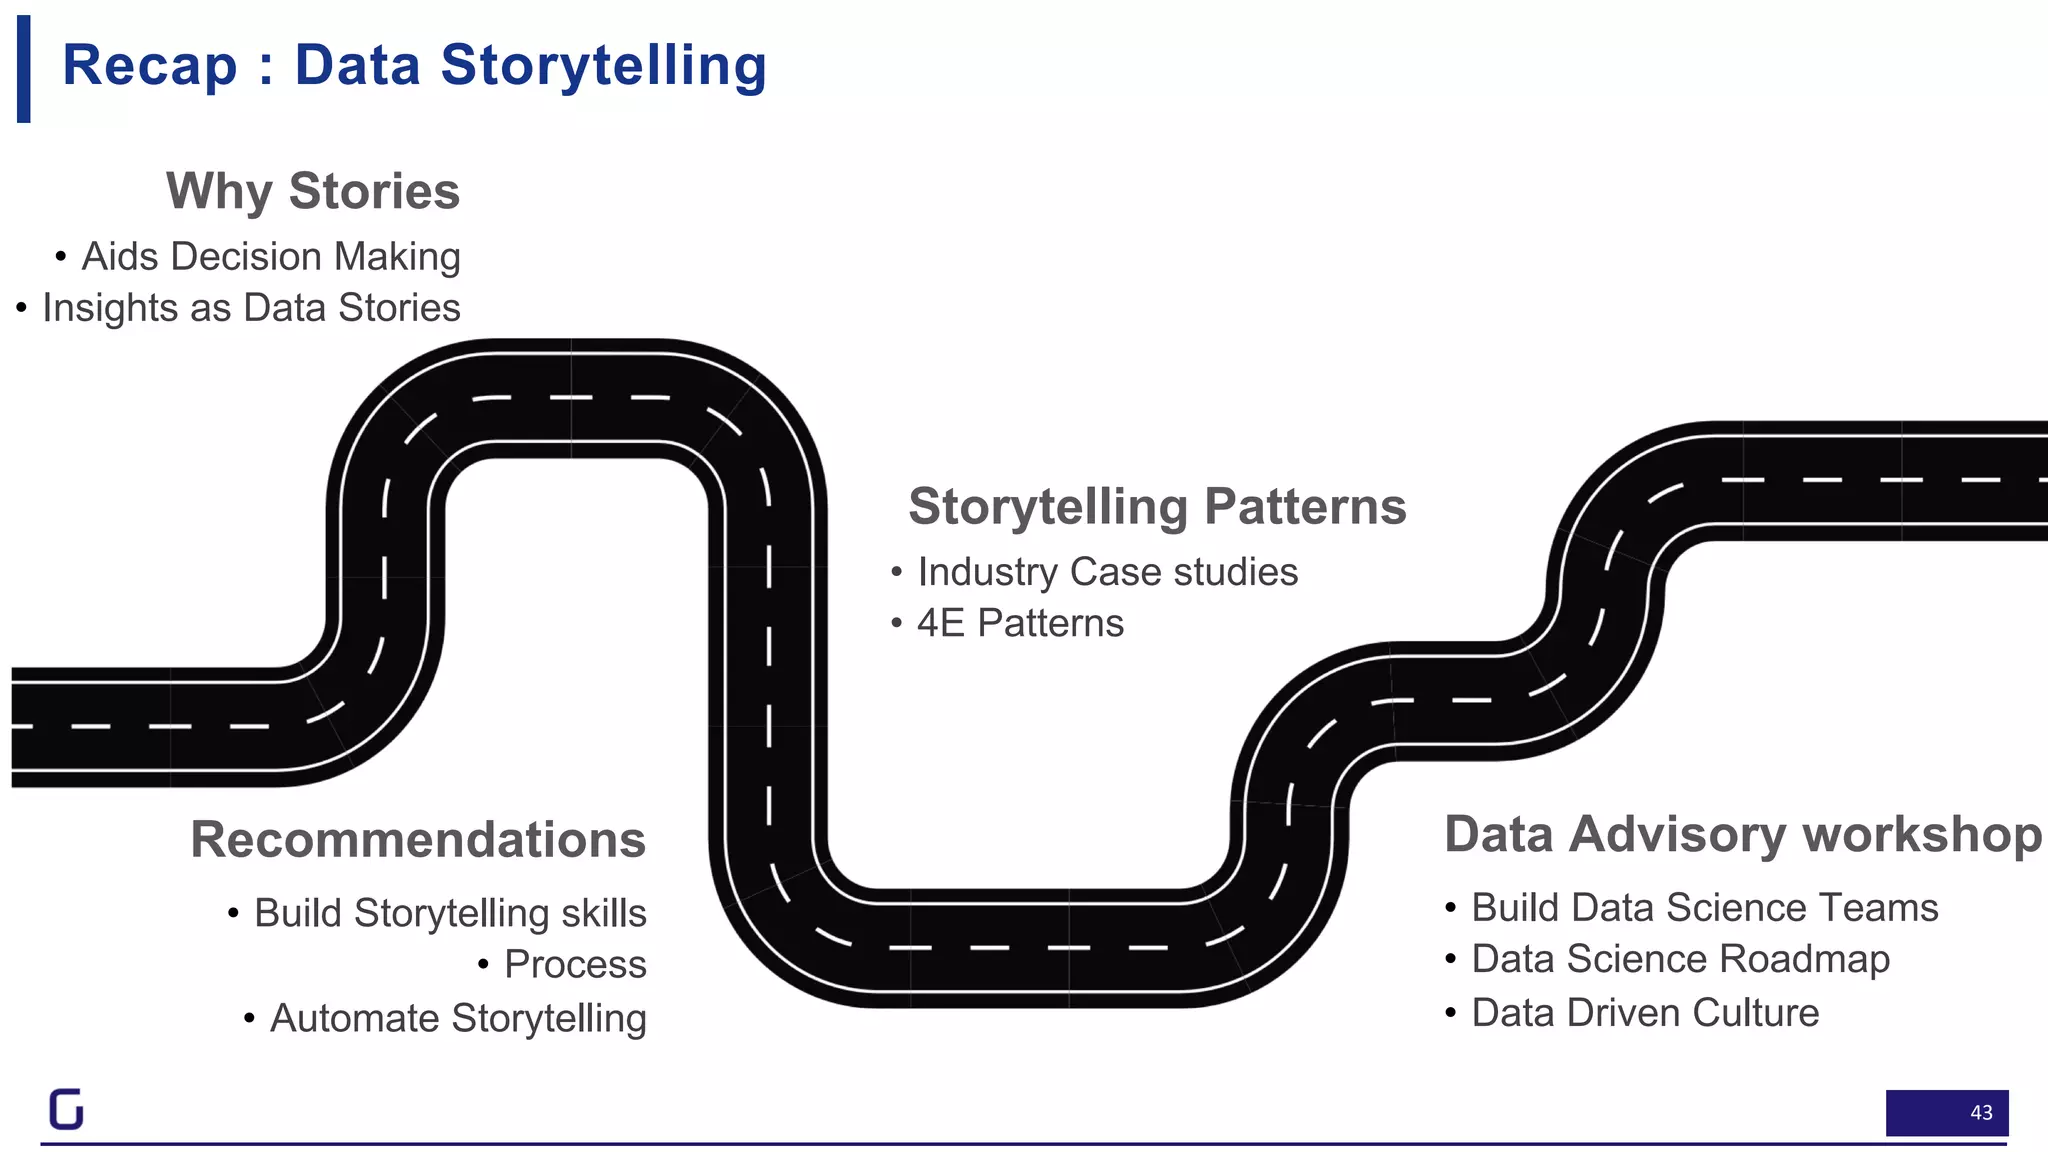
This document discusses the importance of data storytelling and provides recommendations for data leaders. It argues that data stories are more memorable and impactful than raw data or facts. The document outlines four patterns for telling data stories and provides examples. It recommends that organizations embed design skills, automate storytelling, and embrace storytelling as part of the data insights process. Telling data stories can help people really understand data intuitively and aid decision making.
Storytelling for analytics | Naveen Gattu | CDAO Apex 2020Gramener
Chief data and analytics officers (CDAO) Apex Winter 2020 conference in Orlando was an intimate gathering of analytics leaders from across the world.
Gramener's Co-founder and COO, Naveen Gattu, spoke about the importance of storytelling on easy data consumption and impact on data-driven decision making for business users.
How AI Can Help You Make Your Audience Sit Up and Take NoticeGramener
How do you cut through the clutter and connect with your audience? Can data make your message more credible? Can analytics help you craft compelling content? How can AI help understand your audience’s response?
This PPT was presented by Ganes Kesari for his talk at the IABC Conference 2020.
Storyfying your Data: How to go from Data to Insights to StoriesGramener
Gramener's Director - Client success, Shravan Kumar A, delivered an online session to the students of Praxis Business School.
In his session he talked about how converting data into stories can benefit businesses and enable quick decision making. Furthermore, he shared approaches to create data stories along with some use cases and case studies we solved at Gramener to benefit our clients.
Check out our initiative to teach data storytelling to data scientists and analysts so that they can think out of the box and create wonderful data stories for their stakeholders: https://gramener.com/data-storytelling-workshop
The ultimate guide to data storytelling | MaterclassGramener
Gramener collaborated with Nasscom to conduct an online masterclass session on "Storytelling With Data." Gramener's CEO, S Anand, led the masterclass and shared some important slides on how to make data stories and how to drive storytelling.
The slides talk about the structure of data stories and how to find meaning full insights from data. There are real-time examples of data analysis and visualizations we created a Gramener to communicate insights as stories.
This is an ultimate guide on data storytelling that offers tips to create data stories, things to keep in mind while making storylines, and choosing designs to make a design-led data story.
Know more about Gramener's data storytelling workshop for analysts and data scientists at https://gramener.com/data-storytelling-workshop
Gramener's Shravan Kumar took a virtual session with the students of IIM Shillong. It was a fantastic interaction and the participants were keen to understand how data and storytelling are making a difference to new-age businesses. Check out the slides from the session
Humanizing Data Storytelling for Greater Business ImpactGramener
This presentation was shared by Gramener's Kanishk Kumar Abhishek during his guest lecture session at School of Business Management, NMIMS Mumbai.
Check out Gramener's data storytelling workshop for analysts and data scientists at https://gramener.com/data-storytelling-workshop
The Art of Storytelling Using Data ScienceGramener
Gramener's VP - Sales, APAC Region, Vijayam Sirikonda interacted with the students of IIM Raipur and talked about the importance of data storytelling for business users.
A key challenge faced by social organisations is the last mile gap -- communicating the insights and actions to the masses.
The problem is one of attention. Very few people spend time on anything that appears unengaging.
The problem is also one of complexity. Most of the audience is lost if the message is not communicated in the form of a simple story.
Data visualisation provides a mechanism for visually engaging stories that can can explain complex results in a simple fashion. It is seeing widespread adoption among the media, NGOs and the Government.
This Webinar discusses examples of how data visualisation has provided insights in areas of social interest, and has communicated these to a broader audience. We will what techniques and support mechanisms are available in the market today to enable visual storytelling.
http://www.eventbrite.com/e/data-visualization-for-social-problems-tickets-15044842529
Presentation on the uses & misues of data, embracing illustrations & examples, as presented to the Numis Securities Media Conference in London April 2011
How to use data to build a better business faster. Based on the book Lean Analytics, this presentation looks at startup metrics and offers a framework for deliberate growth and iterative improvement of a new business. It also includes examples from larger organizations trying to change from within.
The process of finding, loading and cleaning data in the real world. This is the pre-cursor to data analysis and data science.
This presentation explains sources where you can find data, the various formats in which data is usually available or stored, and a checklist of activities to perform when cleaning the data.
Lean Analytics for Intrapreneurs (Lean Startup Conf 2013)Lean Analytics
Lean Analytics for Intrapreneurs workshop by Alistair Croll, based on Lean Analytics book and research done with dozens of large organizations on how they're using data, analytics and Lean principles to innovate and improve.
How To Get Into Data Science & Analytics - feliperego.com.auFelipe Rego
These are the slides from my talk at Academy Xi on How to Get Started in Data Science and Analytics. On the day, I had the pleasure of having Joel Stein from Precision Sourcing and his team presenting with me. Also, big thank you to Byron Allen for providing valuable content. Finally, thank you yo Academy Xi for hosting us.
Big Data: The Force That’s Good for Consumers and SocietyExperian_US
Craig Boundy, CEO of Experian North America, discusses how big data is being used as a force for good. Good for consumers, good for business, and good for society. He shares his perspective how Experian’s work in data and analytics has real-life applications.
The Most Effective Method For Selecting Data Science ProjectsGramener
Ganes Kesari, Gramener's Head of Analytics & Co-Founder gives his insights on how to craft a data science roadmap that maximizes ROI.
The biggest reason why 80% of analytics projects fail is that they don’t solve the right problem. Asking analytics or data-related question is the worst way to initiate a data analytics project.
This webinar will walk you through how to get started in the most efficient way possible. You'll discover a straightforward step-by-step strategy to unlocking corporate value through industry examples.
Things you will learn from this webinar:
-The most common reasons for the failure of data science initiatives
-Identifying projects and prioritizing them
-Building a data science strategy in three easy steps
-Real-life examples are used to explain the approach
Watch this full webinar on: https://info.gramener.com/data-science-roadmap
To know more from our industry experts book a free demo at: https://gramener.com/demorequest/
What's the Value of Data Science for Organizations: Tips for Invincibility in...Ganes Kesari
This session was delivered as an Open Colloquium on Apr 30th 2020 for the Master in Information program students. It was organized by the Rutgers School of Communication & Information.
The session covers 3 themes:
- How do enterprises and not-for-profit organizations gain value from data science?
- What are the biggest challenges in data science that professionals are unaware of? How can students translate that into learnings, to make themselves indispensable in the industry
- What's the impact of COVID-19 and the recession on data science industry? How will the data jobs be impacted?
AMES 2016 - The Human Side of AnalyticsStephen Tracy
Last year the global analytics industry was estimated to be worth $125 billion in hardware, software and services revenue. Consequently the market has been flooded with more tools, platforms and tech than you can shake a calculator at. When it comes to data, the core challenge many businesses face today seems to have less to do with analytics technology and infrastructure and more to do with finding the right people, talent and skills. In this presentation Stephen will share 10 lessons for building a successful analytics program through a ‘people-first’ strategy.
"Big Data, big data, big data" is all that anyone can think about today. It is the rage, it is the "in" thing, it is the "pill for all ills". People call it the new oil! It takes a moment to realize that it is gas that run automobile not raw oil. It requires taking a step back to realize that actionability can come from good reasoning, right analyses, incisive research and rigorous testing even if the data is small. Big data is useful in so many ways - statistically significant sample size, ability to manage "unknown-unknown" , micro targeting, etc. but it brings with it associated costs and noise too. This presentation is an attempt to bring back the conversation to quality of analytics, actionability of insights and confident decision making without dependency on complexity or volume of data. Analytics Value Chain is a framework where Strategic goals drive everything in data, analytics, research and testing with a quantifiable benefit on the bottom line. This was presented at Global Big Data Conference 2016 at Santa Clara.
This presentation was for Social Media Week Berlin on Tuesday, 24th September. It was targeted at NGOs, NPOs, activist organisations and charities who have important key messages to share with the community. The event will combine elements of a presentation and workshop. We will examine case studies of campaigns that have successfully used data visualisation in tandem with social media and content marketing techniques to spread information and ideas, and to counteract prevailing myths about climate change and renewable energy technology. We will then allow time for participants to split up into small working groups. Structured discussion tasks and group feedback will allow participants to investigate how these strategies can apply to their own organisation or issue. Participants will learn practical steps for identifying important messages, researching and developing content, incorporating data visualisation in a powerful and meaningful way, and promoting their data visualisation campaigns through social media and email outreach. In particular, the event will focus on developing powerful stories that will attract the support of influential sharers and thought leaders from a range of backgrounds, from activism through to industry, so as to maximise the campaign's reach and impact.
Born in London in the 1960s, planning has struggled to keep pace with the significant changes in consumer behaviors. Here we’ll explore how planning can evolve to make advertising more effective, both now, and into the future.
Analytic Transformation | 2013 Loras College Business Analytics SymposiumCartegraph
Loras College is proud to present our annual Business Analytics Symposium on March 27, 2014 at the Grand River Center in Dubuque, IA. Industry experts will share their insights about the evolving field of business analytics opportunities. Learn about everything from best practices when analyzing data to the importance and benefits of building a culture of analytics within your organization.
To learn more, secure your seat or to take advantage of group discounts visit www.loras.edu/bigdata.
In this deck I discuss why, and how data makes me tick. I've been doing work with data for decades but it's more exciting now than ever. Why do I get nerdy excitement from data? Because of my personal data, because data fuels change, because data is used for good. I'm immersed in data that has purpose on a daily basis.
Can you distinguish between data that has purpose and data that fuels vanity? Can you tell when data is for activation and when it's for reporting? Which data gets you promoted and which data gets you bogged down? A click bait teaser - you already know the answer...
What is Data Science and How to Succeed in itKhosrow Hassibi
The use of machine learning and data mining to create value from corporate or public data is nothing new. It is not the first time that these technologies are in the spotlight. Many remember the late ‘80s and the early ‘90s when machine learning techniques—in particular neural networks—had become very popular. Data mining was at a rise. There were talks everywhere about advanced analysis of data for decision making. Even the popular android character in “Star Trek: The Next Generation” had been named appropriately as “Data.” Data science has been the cornerstone of many data products and applications for more than two decades, e.g., in finance, Telco, and retail. Credit scores have been in use for decades to assess credit worthiness of people when applying for credit or loan. Sophisticated real-time fraud scores based on individual’s transaction spending patterns have been used since early ‘90s to protect credit card holders from a variety of fraud schemes. However, the popularity of web products from the likes of Google, Linked-in, Amazon, and Facebook has helped analytics become a household name. Every new technology comes with lots of hype and many new buzzwords. Often, fact and fiction get mixed-up making it impossible for outsiders to assess the technology’s true relevance. Due to the exponential growth of data, today there is an ever increasing need to process and analyze big data which has required a rethinking of every aspect of the data science life cycle, from data management, to data mining and analysis, to deployment. The purpose of this talk is first to describe what data science is and how it has evolved historically. Second, I share my own experiences as a data scientist across different industries and through time with the audience emphasizing the challenges and rewards.
Why Sales and Marketing Specialists will become Big Data ScientistsCindyGordon
Dr. Cindy Gordon's presentation on Big Data and Predictive Analytics at the Sales & Marketing Middle East Conference May19-20 Abu Dhabi. Dr Gordon's presentation "Why Sales and Marketing Specialists will become Big Data Scientists" highlights the trends and skills needed in this era of accelerating volumes of data, along with predictive and prescriptive analytics that will help make sense of it all
Automated Decision making with Predictive Applications – Big Data HamburgLars Trieloff
Most businesses are making most decisions the way Lizards do: based on very simple reflex-response patterns and let cognitive biases taint their decision making. Instead of letting gut feel and biases take over, predictive applications make decisions fast, cheap and fact-based.
Lean Analytics: Using Data to Build a Better Business FasterLean Startup Co.
Alistair Croll, Solve for Interesting , @acroll
At the core of Lean Startup approaches is a continuous cycle of measurement and learning. But what should you measure? To find the right metric, you need to understand the stage you’re at and the business model you’re in, as well as where to draw the line so you know when to cut your losses—and when to step on the gas. In these two sessions, entrepreneur and best-selling author of Lean Analytics Alistair Croll will show you how to put data to work.
How to think about data and what makes a good metric
The importance of cohorts and proper analysis
The five stages every startup goes through
Six business model archetypes and how to find your own
What “good enough” looks like and how to run experiments
What works for larger organizations trying to change and innovate.
This session is relevant for both early-stage founders and intrapreneurs in large organizations. Based on interviews with over 130 analysts, entrepreneurs, and investors, this session is packed with practical information, hard numbers, and concrete steps you can put to work immediately. Attendees need not be technical but should come armed with a basic understanding of web analytics, business metrics, and their current business model, plus a willingness to share with one another.
This workshop is sponsored by Amplitude.
6 Methods to Improve Your Manufacturing Process with Computer VisionGramener
Computer vision is a technology that enables computers to interpret and comprehend visual information from their surroundings, and it has the potential to transform the manufacturing industry. Manufacturers can improve their processes in a variety of ways by using computer vision, from ensuring quality control and optimizing production to inspecting and measuring products and monitoring machinery.
In this presentation you will find out 6 methods how you can improve your manufacturing process with computer vision.
Download our E-book
bit.ly/ebookcomputervision
Detecting Manufacturing Defects with Computer VisionGramener
Computer vision is the field of artificial intelligence that deals with the ability of computers to interpret and understand visual data from the world around them. In the manufacturing industry, computer vision can be used to detect defects in products as they are being produced. This can help to improve the quality of the final product and reduce the cost of rework or recalls.
In this presentation you will find out the use of computer vision for defect detection in manufacturing which aids in improving the efficiency and effectiveness of the production process, leading to higher quality products and lower costs.
Book a discovery call
https://reachus.gramener.com/damage-detection/
How to Identify the Right Key Opinion Leaders (KOLs) in Pharma & HealthcareGramener
Find out the importance of KOLs (Key Opinion leaders) in the Pharma industry and everything you need to know about them.
In the presentation, we will show you who is a KOL in the Pharmaceutical Industry, what role they play and how to identify the right KOLs.
Book a free demo
https://gramener.com/demorequest/
Automated Barcode Generation System in ManufacturingGramener
Find out how automating barcode generation can improve the efficiency of your company's operations.
In the presentation, we will show you how barcodes play a significant role in enabling accurate inventory control and real-time stock information and how businesses can reduce 67% of their time in handling label standards.
Get a Free BarGen Demo.
https://gramener.com/demorequest/
#barcode #lowcode
The Role of Technology to Save BiodiversityGramener
Find out what are the major challenges biodiversity is facing such as deforestation, species endangerment, and poaching.
In the presentation, we will show you how some of the major technology and nature conservation organizations are building innovative solutions to protect our biodiversity.
Download this E-book to know how geospatial AI is impacting biodiversity conservation and sustainable development.
https://info.gramener.com/geospatial-analytics-ai-solutions-esg-sector-ebook
Enable Storytelling with Power BI & Comicgen PluginGramener
Gramener’s Lead Data Consultant Mrinal Ghosh and Principal Information Designer Richie Lionell conducted an exciting webinar on Power BI Comicgen.
In this webinar, they talk about the Comicgen Power BI plugin and how to use it to generate compelling comic data stories.
Who should watch: If you're a Power BI Developer, Consultant, or anyone who often develops data graphics on the Power BI dashboard.
Full webinar link: https://info.gramener.com/storytelling-with-power-bi-and-comicgen-plugin
Would you like to learn more about our Power BI capabilities? Check out: https://gramener.com/power-bi-consulting/
Low Code Platform To Build Data & AI ProductsGramener
Gramener's CEO, Anand S conducted this webinar where he explained how to build Data and AI products using a low-code platform in less than two weeks.
Few takeaways:
-How low-code approaches can be tailored to your data/digital needs?
-Decisions on Building vs. Buying
-Production-ready use cases to stimulate your thinking
Who should watch?
You will find this webinar to be valuable if you're a CPO, VP IT, handling product development, or building analytical solutions for your company.
Watch this full webinar on: https://info.gramener.com/low-code-platform-to-build-process-optimization-solutions?
Want to know more about our low-code platform, Gramex?
Visit: https://gramener.com/gramex/
5 Key Foundations To Build An Effective CX ProgramGramener
Gramener's VP of Analytics Amit Garg hosted this webinar and talked about what are the principles of a good customer experience program, and why is it important.
This webinar will be beneficial to leaders in the CMO, CCO, Customer Service, and any other customer-facing departments within a firm.
Pain points discussed:
-You'll be able to assess the level of CX maturity in your company.
-You'll learn the high-level steps to creating a successful CX program.
-You'll figure out what tools you'll need to improve your talents.
To watch the full webinar visit: https://info.gramener.com/5-key-foundations-effective-cx-program
Learn more about CX Analytics: https://gramener.com/customer-experience-analytics/
Using Power BI To Improve Media Buying & Ad PerformanceGramener
Gramener's Senior Lead Data Consultant, Sidharth Parameswaran, and Navya Sri Channamsetty, Gramener's Associate Lead Data Science Engineer conducted this joint webinar session.
Pain points discussed:
-Actual vs. planned results of a campaign
-Competitor Evaluation & Comparison
-Modeling of Media Mix
-Metrics assessed across the Agency, Client, and Brand levels
- Genre/Channel Performance Evaluation
Things you will learn:
1. Power BI may be used in a variety of ways to investigate findings.
2. Various dashboards would be used to analyze ad/program performance.
3. How can you help your clients obtain higher ROI and acquire a competitive advantage?
Do join us if you are a:
Power BI Developer, Media buyer, Campaign Manager, Brand Manager, Consultant, etc.
To watch this webinar visit: https://info.gramener.com/power-bi-media-buying-ad-performance
Learn more about Gramener: https://gramener.com/
This webinar was hosted by Gramener's CEO/Co-Founder, Anand S, and Ganes Kesari, Head of Analytics/Co-Founder on how data can help firms recover quickly throughout the recession and recovery period.
Who should watch this webinar :
Analytics Leaders, Business Leaders, CDOs, CTOs, etc.
Few takeaways :
-Which aspects of your company could benefit the most from a data-driven response?
-A strategy for identifying use cases that will provide the most value for the money.
How to use data in creative ways to uncover new market opportunities and customers.
Objectives :
-Data's utility in COVID situation
-How data science may assist you in navigating the recession
-Gramener's industry case studies to assist businesses in responding to COVID-19
Full Webinar: https://info.gramener.com/recession-proofing-your-business-with-data
To know more from industry leaders visit our official website: https://gramener.com/
Engage Your Audience With PowerPoint Decks: WebinarGramener
Gramener's CEO and Co-Founder Anand S hosted a webinar on how interactive PowerPoint decks can engage your audiences.
Pain points discussed in this webinar :
-How to utilize interactive slides to answer business questions like "Where is the problem?" and "What created this problem?"
-What forms of interactivity does PowerPoint offer, and when should you utilize each?
-What tools and plug-ins can aid in the creation of interactive presentations?
Watch the full webinar on: https://info.gramener.com/interactive-powerpoint-for-operations
Book a free demo to know more about Gramener's solutions: https://gramener.com/demorequest/
Structure Your Data Science Teams For Best OutcomesGramener
Gramener's Head of Analytics, Ganes Kesari conducted this webinar and discussed the following points :
-Why do data analytics and visualization initiatives require teams to work in silos?
-What are the best organizational structures for data science?
-As your data journey progresses, how should the organizational structure evolve?
-Best methods for encouraging team collaboration in data projects
This is a unique webinar designed for Executives, Chief Analytics Officers, Heads of Analytics, Directors, Technology Leaders, and Managers that work with data science teams on a daily basis.
To check out the full webinar visit: https://info.gramener.com/data-science-teams-structure-for-best-outcomes
To contact us & book a free demo visit: https://gramener.com/demorequest/
Gramener's Lead Data Scientist Soumya Ranjan and Senior Data Science Engineer Sumedh Ghatage conducted a webinar on Geospatial AI.
In this webinar, they discussed the technical know-how to get started, as well as some strategies for navigating this fascinating realm of Geospatial Analytics.
Pain points covered :
-How to begin with Geospatial Analytics in Python
-How can large-scale geospatial datasets be cleaned and analyzed?
-What is the best way to design geospatial workflows?
-How to use Geospatial Datasets for Deep Learning?
No matter whatever industry you're in, Geospatial Analytics will provide you with a wealth of unique solutions.
To watch the full webinar visit: https://info.gramener.com/geospatial-ai-technical-sneak-peek
To know more about Gramener's Geospatial AI solutions book a free demo on: https://gramener.com/demorequest/
5 Steps To Become A Data-Driven Organization : WebinarGramener
Gramener's Chief Data Scientist and Co-founder Ganes Kesari conducted an interesting webinar that will give you an idea of how to analyze your data maturity and plan the five steps to transforming your business using data.
Who should watch this webinar?
Executives, Chief Data/Analytics Officers, Technology leaders, Business heads, Directors, and Managers.
Important points discussed on the webinar:
-The majority of businesses reach a halt in the middle of their data journey.
-According to Gartner, approximately 87% of companies in the business have a poor degree of data maturity (levels 1 and 2 on a scale of 5).
-Adding more data science projects to your portfolio will not boost your talents or results. The truth is that CDOs' primary issues are divided into five categories.
Learnings from this webinar:
-Data Science Maturity. What is it and why is it important?
-How can you determine the maturity of data science and its limitations?
-How does data science maturity (described with an example) assist your business in progressing?
Watch the full webinar on:
https://info.gramener.com/5-steps-to-transform-into-data-driven-organization
To know more about Data Maturity visit:
https://gramener.com/data-maturity/#
5 Steps To Measure ROI On Your Data Science Initiatives - WebinarGramener
Gramener's Chief Decision Scientist & Co-Founder Ganes Kesari conducted an exciting webinar on how to measure ROI on your data science initiatives.
In this webinar people from the C-suite level CEO, COO, Directors, Managers across various industries joined.
Ganes Kesari covered the following points with industry examples:
-Identifying business use cases with a high impact
-Choosing effective success indicators
-Ascertaining that the consequences may be traced back to your data project
The attendees had a good time. Learnings from the webinar:
-Why do businesses struggle to get a return on their data investments?
-A straightforward framework for calculating the return on investment from your data projects
-Benchmarking of typical payback from data initiatives in the industry
To check out the complete recording of the webinar please visit:
https://info.gramener.com/5-steps-to-measure-roi-on-your-data-science-initiatives
To know more about data advisory check out:
https://gramener.com/advisory-consulting/
Saving Lives with Geospatial AI - Pycon Indonesia 2020Gramener
There’s a powerful way to fight dengue. Infect a mosquito with Wolbachia, release it in highly populated regions, and wait for it to infect all mosquitoes in the region.
But this process is expensive, and we need to release it in the most densely populated regions in a city.
And no one really knows what population density is at a 100m x 100m level.
Can we use satellite imagery and use this to identify building density?
Driving Transformation in Industries with Artificial Intelligence (AI)Gramener
Gramener's Director of Delivery, Priyaranjan Mohanty, delivered a virtual session at IIM Nagpur and talked about how organizations are moving towards digital transformation by leveraging advanced technologies such as Artificial Intelligence (AI), Machine Learning (ML) and Deep Learning.
Starting from what the industry leaders think about digital transformation to how it can shape the global economy, this presentation explores the scope of AI in the digital world.
Having data doesn't solve any business problem. Finding actionable insights and stories and implementing them to optimize business processes does.
This presentation was created by Sundeep Reddy Mallu for a virtual session with people at Indian School of Business (ISB) - Institute of Data Science.
The slides talk about how to create data stories and what parameters to keep in mind while creating one. With real-time case-studies and use cases of data storytelling, this presentation talks about how business leaders can identify Big, Useful, and surprising insights from big data sets.
Data Analysis has been the buzz word this decade. Data Storytelling will be the next big influencer in Value creation.
Find out how Gramener is shaping the Data Storytelling landscape.
Introduction to Data Storytelling | Rasagy Sharma - GramenerGramener
Rasagy Sharma, Gramener's Principal Information Designer, created this PPT to introduce data storytelling to the students at Symbiosis Institute of Business Management (SIBM).
The slide talks about how to create data stories and the impact of data stories on businesses.
Rasagy Sharma also teaches data storytelling to analysts and data scientists. Check out more about Gramener's data storytelling workshop at https://gramener.com/data-storytelling-workshop
Check out more solutions on data storytelling at https://gramener.com
Connect with Rasagy on:
LinkedIn: https://in.linkedin.com/in/rasagy
Twitter: @rasagy
Accelerate your Kubernetes clusters with Varnish CachingThijs Feryn
A presentation about the usage and availability of Varnish on Kubernetes. This talk explores the capabilities of Varnish caching and shows how to use the Varnish Helm chart to deploy it to Kubernetes.
This presentation was delivered at K8SUG Singapore. See https://feryn.eu/presentations/accelerate-your-kubernetes-clusters-with-varnish-caching-k8sug-singapore-28-2024 for more details.
GraphRAG is All You need? LLM & Knowledge GraphGuy Korland
Guy Korland, CEO and Co-founder of FalkorDB, will review two articles on the integration of language models with knowledge graphs.
1. Unifying Large Language Models and Knowledge Graphs: A Roadmap.
https://arxiv.org/abs/2306.08302
2. Microsoft Research's GraphRAG paper and a review paper on various uses of knowledge graphs:
https://www.microsoft.com/en-us/research/blog/graphrag-unlocking-llm-discovery-on-narrative-private-data/
LF Energy Webinar: Electrical Grid Modelling and Simulation Through PowSyBl -...DanBrown980551
Do you want to learn how to model and simulate an electrical network from scratch in under an hour?
Then welcome to this PowSyBl workshop, hosted by Rte, the French Transmission System Operator (TSO)!
During the webinar, you will discover the PowSyBl ecosystem as well as handle and study an electrical network through an interactive Python notebook.
PowSyBl is an open source project hosted by LF Energy, which offers a comprehensive set of features for electrical grid modelling and simulation. Among other advanced features, PowSyBl provides:
- A fully editable and extendable library for grid component modelling;
- Visualization tools to display your network;
- Grid simulation tools, such as power flows, security analyses (with or without remedial actions) and sensitivity analyses;
The framework is mostly written in Java, with a Python binding so that Python developers can access PowSyBl functionalities as well.
What you will learn during the webinar:
- For beginners: discover PowSyBl's functionalities through a quick general presentation and the notebook, without needing any expert coding skills;
- For advanced developers: master the skills to efficiently apply PowSyBl functionalities to your real-world scenarios.
Elevating Tactical DDD Patterns Through Object CalisthenicsDorra BARTAGUIZ
After immersing yourself in the blue book and its red counterpart, attending DDD-focused conferences, and applying tactical patterns, you're left with a crucial question: How do I ensure my design is effective? Tactical patterns within Domain-Driven Design (DDD) serve as guiding principles for creating clear and manageable domain models. However, achieving success with these patterns requires additional guidance. Interestingly, we've observed that a set of constraints initially designed for training purposes remarkably aligns with effective pattern implementation, offering a more ‘mechanical’ approach. Let's explore together how Object Calisthenics can elevate the design of your tactical DDD patterns, offering concrete help for those venturing into DDD for the first time!
In his public lecture, Christian Timmerer provides insights into the fascinating history of video streaming, starting from its humble beginnings before YouTube to the groundbreaking technologies that now dominate platforms like Netflix and ORF ON. Timmerer also presents provocative contributions of his own that have significantly influenced the industry. He concludes by looking at future challenges and invites the audience to join in a discussion.
Transcript: Selling digital books in 2024: Insights from industry leaders - T...BookNet Canada
The publishing industry has been selling digital audiobooks and ebooks for over a decade and has found its groove. What’s changed? What has stayed the same? Where do we go from here? Join a group of leading sales peers from across the industry for a conversation about the lessons learned since the popularization of digital books, best practices, digital book supply chain management, and more.
Link to video recording: https://bnctechforum.ca/sessions/selling-digital-books-in-2024-insights-from-industry-leaders/
Presented by BookNet Canada on May 28, 2024, with support from the Department of Canadian Heritage.
Essentials of Automations: The Art of Triggers and Actions in FMESafe Software
In this second installment of our Essentials of Automations webinar series, we’ll explore the landscape of triggers and actions, guiding you through the nuances of authoring and adapting workspaces for seamless automations. Gain an understanding of the full spectrum of triggers and actions available in FME, empowering you to enhance your workspaces for efficient automation.
We’ll kick things off by showcasing the most commonly used event-based triggers, introducing you to various automation workflows like manual triggers, schedules, directory watchers, and more. Plus, see how these elements play out in real scenarios.
Whether you’re tweaking your current setup or building from the ground up, this session will arm you with the tools and insights needed to transform your FME usage into a powerhouse of productivity. Join us to discover effective strategies that simplify complex processes, enhancing your productivity and transforming your data management practices with FME. Let’s turn complexity into clarity and make your workspaces work wonders!
DevOps and Testing slides at DASA ConnectKari Kakkonen
My and Rik Marselis slides at 30.5.2024 DASA Connect conference. We discuss about what is testing, then what is agile testing and finally what is Testing in DevOps. Finally we had lovely workshop with the participants trying to find out different ways to think about quality and testing in different parts of the DevOps infinity loop.
Enhancing Performance with Globus and the Science DMZGlobus
ESnet has led the way in helping national facilities—and many other institutions in the research community—configure Science DMZs and troubleshoot network issues to maximize data transfer performance. In this talk we will present a summary of approaches and tips for getting the most out of your network infrastructure using Globus Connect Server.
State of ICS and IoT Cyber Threat Landscape Report 2024 previewPrayukth K V
The IoT and OT threat landscape report has been prepared by the Threat Research Team at Sectrio using data from Sectrio, cyber threat intelligence farming facilities spread across over 85 cities around the world. In addition, Sectrio also runs AI-based advanced threat and payload engagement facilities that serve as sinks to attract and engage sophisticated threat actors, and newer malware including new variants and latent threats that are at an earlier stage of development.
The latest edition of the OT/ICS and IoT security Threat Landscape Report 2024 also covers:
State of global ICS asset and network exposure
Sectoral targets and attacks as well as the cost of ransom
Global APT activity, AI usage, actor and tactic profiles, and implications
Rise in volumes of AI-powered cyberattacks
Major cyber events in 2024
Malware and malicious payload trends
Cyberattack types and targets
Vulnerability exploit attempts on CVEs
Attacks on counties – USA
Expansion of bot farms – how, where, and why
In-depth analysis of the cyber threat landscape across North America, South America, Europe, APAC, and the Middle East
Why are attacks on smart factories rising?
Cyber risk predictions
Axis of attacks – Europe
Systemic attacks in the Middle East
Download the full report from here:
https://sectrio.com/resources/ot-threat-landscape-reports/sectrio-releases-ot-ics-and-iot-security-threat-landscape-report-2024/
A tale of scale & speed: How the US Navy is enabling software delivery from l...sonjaschweigert1
Rapid and secure feature delivery is a goal across every application team and every branch of the DoD. The Navy’s DevSecOps platform, Party Barge, has achieved:
- Reduction in onboarding time from 5 weeks to 1 day
- Improved developer experience and productivity through actionable findings and reduction of false positives
- Maintenance of superior security standards and inherent policy enforcement with Authorization to Operate (ATO)
Development teams can ship efficiently and ensure applications are cyber ready for Navy Authorizing Officials (AOs). In this webinar, Sigma Defense and Anchore will give attendees a look behind the scenes and demo secure pipeline automation and security artifacts that speed up application ATO and time to production.
We will cover:
- How to remove silos in DevSecOps
- How to build efficient development pipeline roles and component templates
- How to deliver security artifacts that matter for ATO’s (SBOMs, vulnerability reports, and policy evidence)
- How to streamline operations with automated policy checks on container images
PHP Frameworks: I want to break free (IPC Berlin 2024)Ralf Eggert
In this presentation, we examine the challenges and limitations of relying too heavily on PHP frameworks in web development. We discuss the history of PHP and its frameworks to understand how this dependence has evolved. The focus will be on providing concrete tips and strategies to reduce reliance on these frameworks, based on real-world examples and practical considerations. The goal is to equip developers with the skills and knowledge to create more flexible and future-proof web applications. We'll explore the importance of maintaining autonomy in a rapidly changing tech landscape and how to make informed decisions in PHP development.
This talk is aimed at encouraging a more independent approach to using PHP frameworks, moving towards a more flexible and future-proof approach to PHP development.
Le nuove frontiere dell'AI nell'RPA con UiPath Autopilot™UiPathCommunity
In questo evento online gratuito, organizzato dalla Community Italiana di UiPath, potrai esplorare le nuove funzionalità di Autopilot, il tool che integra l'Intelligenza Artificiale nei processi di sviluppo e utilizzo delle Automazioni.
📕 Vedremo insieme alcuni esempi dell'utilizzo di Autopilot in diversi tool della Suite UiPath:
Autopilot per Studio Web
Autopilot per Studio
Autopilot per Apps
Clipboard AI
GenAI applicata alla Document Understanding
👨🏫👨💻 Speakers:
Stefano Negro, UiPath MVPx3, RPA Tech Lead @ BSP Consultant
Flavio Martinelli, UiPath MVP 2023, Technical Account Manager @UiPath
Andrei Tasca, RPA Solutions Team Lead @NTT Data
2. 2
Source: "Decisive Action: How Businesses Make Decisions and How They Could Do It Better," The Economist, Intelligence Unit.
90%
Proportion of business
decision makers would
prioritize gut feel over
data if there was a
contradiction between
the two.
4. 4
Roadblocks to Success – Gartner CDAO survey
Credit: Gartner
“Consumption of Data as key enabler ”
5. 5
Data Engineering
ActivitiesMaturityPhases
Data Science
Data as
‘Culture’
Data Collection Data Storage
Data
Transformation
Reporting Insights Consumption Decisions
LOGS, IOT
INT/EXTERNAL
STAGE/STREAM
SQL, SPARK..
UN/STRUCTURED
DATA LAKE..
CLEANING
ETL
PREPARATION
AGGREGATES
METRICS/KPI
REPORTS
ML
EDA
AI
Info Design
Narrative
Data Stories
WORKFLOWS
CHANGE MGMT
ACTIONS
Driving Data Supply Driving Data Value
Maturity Levels with Data
6. 6
Insights Output : Examples
Data as
Culture’
Data
Transformation
Consumption
MaturityPhases
“Language of Data Scientist”
8. 8
Data generation and analysis are not sufficient.
“Cohesive Consumption of Data”
Most decision-making discussions
assume that only senior executives
make decisions or that only senior
executives’ decisions matter.
This is a dangerous mistake…
It’s clearly a budget!
It has a lot of numbers in it!
Peter F Drucker George W Bush
9. 9
CDOs Must Address Hearts & Minds to Drive Data Value
Data-driven
culture
Business
valueCDO
Credit: Gartner
14. 14
Just
EXPOSE
the data to me
EXHIBIT
to me what is happening with
the data
EXPLAIN
to me why it’s happening
Allow me to
EXPLORE
and figure it out
Low effort High effort
High effort
Low effort
Creator
Consumer
There are Four Ways of Telling Data Stories
16. 16
Just
EXPOSE
the data to me
EXHIBIT
to me what is happening with
the data
EXPLAIN
to me why it’s happening
Allow me to
EXPLORE
and figure it out
Low effort High effort
High effort
Low effort
Creator
Consumer
20. 20
Just
EXPOSE
the data to me
EXHIBIT
to me what is happening with
the data
EXPLAIN
to me why it’s happening
Allow me to
EXPLORE
and figure it out
Low effort High effort
High effort
Low effort
Creator
Consumer
21. 21
This is a dataset (1975 – 1990) that has
been around for several years, and has
been studied extensively. Yet, a
visualization can reveal patterns that are
neither obvious nor well known.
For example,
• Are birthdays uniformly distributed?
• Do doctors or parents exercise the C-section option to move
dates?
• Is there any day of the month that has unusually high or low births?
• Are there any months with relatively high or low births?
Very high births in September. But this
is fairly well known. Most conceptions
happen during the winter holiday
season.
Relatively few births during the
Christmas & Thanksgiving
holidays, as well as New Year
and Independence Day.
Most people prefer not to have
children on the 13th of any
month, given that it’s an
unlucky day.
Some special days like April
Fool’s day are avoided, but
Valentine’s Day is quite popular.
More births Fewer births … on average, for each day of the year (from 1975 to 1990)
Let’s Look at 15 Years of US Birth Data
Education
LINK
Fraud
22. 22
The Pattern in India is Quite Different
This is a birth date dataset that’s obtained
from school admission data for over 10
million children. When we compare this
with births in the US, we see none of the
same patterns.
For example,
• Is there an aversion to the 13th or is there a local cultural nuance?
• Are holidays avoided for births?
• Which months have a higher propensity for births, and why?
• Are there any patterns not found in the US data?
Very few children are born in the
month of August, and thereafter.
Most births are concentrated in
the first half of the year.
We see a large number of
children born on the 5th
, 10th
,
15th
, 20th
and 25th
of each month
– that is, round numbered dates.
Such round numbered patterns
a typical indication of fraud.
Here, birthdates are brought
forward to aid early school
admission.
More births Fewer births … on average, for each day of the year (from 2007 to 2013)
Education
LINK
Fraud
23. 23
How should you hedge your Portfolio?
68% correlation between AUD & EUR
Plot of 6-month daily
AUD - EUR values
Block of
correlated
currencies
… clustered hierarchically using “Hierarchical
Agglomerative Clustering” Algorithm
LINK
24. 24
Just
EXPOSE
the data to me
EXHIBIT
to me what is happening with
the data
EXPLAIN
to me why it’s happening
Allow me to
EXPLORE
and figure it out
Low effort High effort
High effort
Low effort
Creator
Consumer
25. 25
Financial Reporting Narratives LINK
Financial ServicesNarrativesFinancePlatform
A key problem in financial reporting is
annotating drivers of variance. For e.g.:
• Which account caused the largest
increase in assets?
• Was this the primary cause, or one
among many?
• Were there other accounts that mitigated
its effect?
These are what a financial analyst manually
analyzes, adding annotations to the report.
But this is automatable.
This natural language generator by
Gramener applies these simple rules:
• If there's more than one driver, mention
the top driver.
• If the second driver counteracts the first
driver's effect, mention it.
• Or, if the second driver has 78% of the
influence on the first, mention it
The annotations are similar to a human’s,
but without human error. It sets a starting
point for exploration, letting people focus
on review rather than execution.
26. 26
EUROPEAN BREWERY IDENTIFIED €15 M COST SAVINGS AFTER CONSOLIDATING VENDORS
WATCH A 4-MINUTE VIDEOSEE LIVE DEMO
A leading European brewery’s plants purchased
commodity raw materials from several vendors each –
and had low volume discounts.
Plants also placed multiple orders placed every week,
leading to higher logistics cost.
When plant managers were shown the data, they
objected, saying “That’s not always the case.” Or,
“That’s the only way– no one else does better.”
Gramener built a custom analytics solution that
sourced their SAP order data, automatically identified
which plants ordered which commodities the most
from multiple vendors – and when.
It showed how each plant performed compared to
peers – shaming those with poor performance.
With this, they identified savings of €15 m — which
the plant managers couldn’t refute.
€15 m 40%
savings potential identified
annually
vendor based reduction
identified
27. 27
Challenges Women Face – An Interactive Narrative
Best of the Visualization
Web, Sep 2018
LINK
30. 30
Just
EXPOSE
the data to me
EXHIBIT
to me what is happening with
the data
EXPLAIN
to me why it’s happening
Allow me to
EXPLORE
and figure it out
Low effort High effort
High effort
Low effort
Creator
Consumer
31. 31
Process Optimization, Supported by Augmented Narratives
Navigation filters
Process flow diagram
indicating bottlenecks
& volume of requests
Automated analysis to
identify areas which
need work and which
can create maximum
impact
LINK
33. 33
Just
EXPOSE
the data to me
EXHIBIT
to me what is happening with
the data
EXPLAIN
to me why it’s happening
Allow me to
EXPLORE
and figure it out
Low effort High effort
High effort
Low effort
Creator
Consumer
There are Four Ways of Telling Data Stories
34. 34
By 2025, data stories will be the most widespread way of
consuming analytics
&
75% of stories will be automatically generated using
augmented analytics techniques.
Reference: Gartner report , Augmented Analytics: Teaching Machines to Tell Data Stories to Humans
39. 39
AUTOMATE
STORYTELLING
3
Reports in plain
English with visuals
Ø Wealth reports
Ø Patient reports
Ø Loyalty point usage
Ø School report cards
NARRATIVES
Visual Insights
delivered to Inbox
Ø Customer segments
Ø Viewership shifts
Ø Geo-demographics for
geographic zones.
INFOGRAPHIC ALERTS
Engage through
emotions from Comics
Ø Price forecast
Ø Revenue forecasts
Ø Capacity utilization
Ø Viewership forecast
COMICGEN
Insights delivered as
Automated Videos
Ø Type detection
Ø Root cause drivers
Ø Factor correlation
Ø Cross-tabulation
DATA VIDEOS
40. 40
AT GRAMENER, OUR FOCUS IS ON NARRATES INSIGHTS FROM DATA AS STORIES
Stories are
memorable, viral
NUMBERS
ARE NOT
ENOUGH
STORIES EXPLAIN THEM
Delays are due to fragile
cargo. Trained staff and
forklifts reduce risk of
breakage, and hence reduce
delay.
Insights are
useful, non-
obvious, Big
FACTS ARE NOT USEFUL
E.g. Delay in cargo delivery
grew 8% last quarter.
INSIGHTS ENABLE ACTION
Lack of forklifts and fewer
trained staff led to the delay.
Improving these can reduce
cargo delay by 15%.
40
INSIGHT STORY
DATA
GRAMENER
COMBINES
These are memorable. People act on them.
They go viral. This enables collective action.
41. 41
WE HELP PEOPLE REALLY UNDERSTAND DATA – LOGICALLY, AND INTUITIVELY
41
We use technology to automate Analysis, Visuals
and Narration
INSIGHTS
Extract meaning using
automated patterns
AI & MACHINE
LEARNING SERVICES
VISUAL
NARRATIVES
STORYTELLING
Creative ThinkingCritical Reasoning
SOFTWARE
THROUGH
SERVWARE: augmenting human
intelligence with technology
STORYTELLING
Binding visuals together into a
logical story
42. 42
§ What are the most critical skills needed in your data science team?
§ What roles should you plan to hire and where should you scout for talent?
§ Tips and tricks for hiring your data science team, presented with real-world
examples?
§ What are the essentials for seeding a culture of data?
§ How to form ‘data’ habits in your workforce?
§ Best practices to show when and how you can get started on this journey
§ Key reasons why data science projects fail
§ How to identify your projects and prioritize them
§ A standard 3-step framework for building your data science roadmap
Get Business ROI from
Data Science
ADVISORY
WORKSHOPS
Create your custom Data Science Roadmap
Build a Data Science Team to deliver Business Value
Data Culture to promote Data-Driven decision making
How to
43. 43
Recap : Data Storytelling
• Industry Case studies
• 4E Patterns
Storytelling Patterns
• Build Data Science Teams
• Data Science Roadmap
• Data Driven Culture
Data Advisory workshop
Why Stories
• Aids Decision Making
• Insights as Data Stories
Recommendations
• Build Storytelling skills
• Process
• Automate Storytelling
44. 44
What Next?
• Read these
• Storytelling with data
• Resonate
• Show & Tell
• Data visualization society
Feel free to contact me at Naveen.gattu@gramener.com
• Practice storytelling
• Understand the context systematically
• Review chart annotations with colleagues
• Interact with experts outside your circle
• Automate this in your dashboards
Reach out for inspiration or help