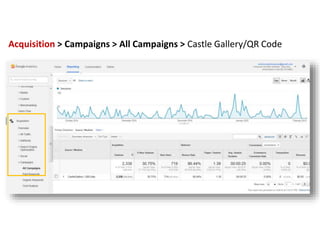
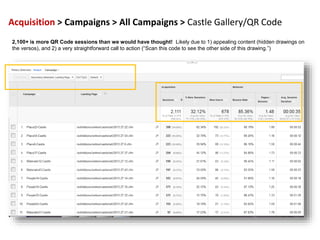
#musedata
Google Analytics for Everyone!
2016 Annual Meeting & MuseumExpo
Brian Alpert & Sara Snyder
5/27/2016
#musedata
Agenda
2
 Brian – Google Analytics 101
 Analytics Process
 GA Basics
 Metrics and Dimensions
 How GA is organized
 How can Google Analytics HELP?
 New(ish) Game-Changing Features
 Universal Analytics mandatory upgrade
 A Few Best Practices
 Sara – Real Life Examples
 Don’t start with the all the data, start with real life questions
 “Is anyone finding this new educational resource that we made?”
 “What parts of our website are local visitors viewing mostly on their phones?”
 “Do we really need to keep maintaining this old microsite?”
 Q&A
#musedata 3
What web analytics is often about
#musedata 4
Web analytics is often about:
“So What?”
#musedata 5
What web analytics is really about:
#musedata
Your goal: use data to tell a story
 What was happening.
 What it meant.
 What you did.
 What’s happening
now.
6
forbes.com
#musedata
There is a systematic, step-by-step process
 Articulate your program’s goals.
 Decide strategies to achieve
those goals.
 Decide tactics to pursue the
strategies.
 Decide what and how to measure
to validate the tactics.
 Benchmark to get a sense of
what’s normal.
7
homedit.com
#musedata
Articulate specific goals
 Express what you’re trying to
accomplish.
 Make high-level goals more
specific:
 “Increase influence” - too broad.
 “Become the definitive source on
Smithsonian history” - more specific.
 Specificity makes it easier to
identify strategies and tactics.
 Not too many!
8
It’s a Wonderful Life
Start the conversation! Articulate
goals & next steps on your own;
work with management to finalize.
#musedata
Determine strategies & tactics
 Strategies – the plans you make to achieve the goals.
 Employing social media is a strategy.
 Tactics – the things you do to advance the strategy.
 Producing a specific type of content is a tactic.
 Individual channels (facebook, twitter) are tactics.
 Per the example:
 Goal: “Become the definitive source on Smithsonian history.”
 Strategy: Increase engagement with history of the Smithsonian
content.
 Tactic: Make SI-history content more findable and measureable.
9
#musedata
Decide how to measure your tactics
 Choose measurements to learn
if your tactics are succeeding.
 Choose a few measurements.
 Trend them over time.
 Per the example:
 Strategy: increase engagement with
SI history website content.
 Tactic: make website history
content more findable /
measureable.
 Make a “history-content” segment
and measure for engagement:
 Visit frequency
 Visit depth
 Bounce rate
10
History-
related visits
All
visits
“Deep history visits” were 94% higher!
#musedata 11
You can’t set targets w/o benchmarks
 You need at least six months of
data.
 Data is seasonal.
 Depends on your traffic.
 Balance targets with factors
beyond your control:
 Are the improvements you’re
seeking difficult to achieve?
 How much resources will you have
to implement tactics?
Drinks Enthusiast
#musedata 12
Keep it simple!
 Don’t do too much!
 Minimize the number of
measurements.
 If they turn-out to be
inconclusive, change up.
 It’s an ongoing process!
arvinddevalia.com
#musedata 13
Army Times
GOOGLE ANALYTICS Basics
#musedata 14
GA Basics
 The most basic thing
 Navigating Google Analytics
 GA in your world
Army Times
#musedata
 Dimensions describe the
data, or an attribute of the
user (“what”):
 Traffic source
 City
 Page
 Metrics measure the data
(“how many”, “how long”):
 Sessions
 Bounce rate
 Time on page
 Lunametrics
 Optimizesmart
 Dimensions & Metrics Explorer
(Google)
15
Optimizesmart
Dimensions Metrics
GA’s familiar
color-coding
helps you
keep track of
Dimensions
and Metrics.
The most basic thing
Dimensions and Metrics
#musedata 16
Navigating Google Analytics
How GA is organized
Home
Searchable list of
all GA accounts
associated with
your Google
Account.
#musedata 17
Navigating Google Analytics
How GA is organized
Reporting
Where GA’s
reports are
located.
#musedata 18
Navigating Google Analytics
How GA is organized
Customization
Where Custom
Reports are located.
#musedata 19
Navigating Google Analytics
How GA is organized
Admin
Settings for your:
1. Account
2. Property (individual
websites)
3. View (you can setup
different “views” –
with custom filters,
etc.)
#musedata 20
LunaMetrics
Navigating Google Analytics
How GA is organized
 These four
sections under
“Reporting”
house most of
the reports.
Audience
Acquisition
Behavior
Conversions
#musedata 21
 Improve your program?
 Yes! Good for you!
 Satisfy your boss with monthly
Big Numbers?
 Sure. It is what it is.
 Validate (or not) something
you’ve already done.
 Um, maybe.
Wikipedia
GA in your world
How can Google Analytics HELP?
#musedata 22
Improve your program!
Segmentation: GA’s most powerful feature?
 Analyze subsets of
traffic.
 Search engine traffic
 Social media traffic
 Demographics
 Import expert-made
segments from the
Solutions Gallery!
 Google Blog
 Kissmetrics Overview
 Examples (Cutroni)
 Examples (Kaushik)
Segments are accessed
by clicking “Add
Segment”. “Organic
Traffic” is shown.
All Users
Organic (Search
Engine) Traffic
#musedata
All Visits data tells a nice story...
23
Minimal
frequency group
(purple)
downward trend
indicates
improving content
engagement
High frequency
group (blue)
upward trend
indicates same
Impact of this Data on the Site or Program
• This good-looking chart may indicate high content engagement and/or perceived value
• This data may correlate to increasing conversion behaviors
Acting on this Data
• Identify moderate and high loyalty pages as a means of duplicating, or improving others
• Examining conversion behaviors of these segments may yield add'l insights
• Correlating high bounce rate pages to one-time visits may yield add'l insights
• Test different content types in an attempt to move 'minimal' visitors into 'moderate' group
Key Trends
and Insights
#musedata 24
This Impact of this Data on the Site or Program
• Organic search listings are driving poorly-targeted traffic
• Will result in decreased organic search performance over time
Acting on this Data
• Refocus title tags, meta-description tags and page content for important pages
• Perform link analysis to see where other SEO improvements can be made
Minimal
frequency group
upward trend
indicates organic
listings are not
appropriately
targeted
Moderate
frequency group
downward trend
indicates same
High frequency
group trending
slightly downward,
in contrast to
previous chart’s
upward slope
Key Trends
and Insights
…But applying segmentation tells a different story
#musedata
 Under Audience >> Behavior
 Frequency
 Recency
 Page Depth (“Engagement”)
 “New vs. Returning” (e-nor post)
 Use with segments:
 Traffic from search
 Traffic from mobile
 Etc.
 ‘Time on site’ is great, but do not rely
solely on it.
 Due to technical issues
25
Improve your program!
Metrics as proxies for user engagement
#musedata
 Create your own reports.
 Import custom reports
from the Solutions
Gallery.
 Create and manage Custom
Reports (Google)
 12 Awesome Custom Reports
Created by the Experts
(Kissmetrics)
 3 Awesome, Downloadable,
Custom Web Analytics Reports
(Kaushik)
 5 Google Analytics Custom Reports
FTW! (Kaushik)
26
Create and access
Custom Reports from
the ‘Customization’ tab.
Improve your program!
Custom Reports can save you time & effort
Custom Reports can be
scheduled for delivery via
email in a variety of
formats.
#musedata
 A conversion is any measureable behavior
with an implicitly (or explicitly) higher value.
 Conversion rates are more informative than
merely counting the number of times
something has happened.
 Typical conversion goals:
 Destination (ex: thanks.html)
 Duration (ex: 5 minutes or more)
 Pages/Screens per session (ex: 3 pages)
 Event (download PDF, play video)
 REQUIRES CODE
27
Improve your program!
Deeper understanding with Conversion Goals
Studying conversion rates
levels the playing field,
versus merely counting!
#musedata
 More sophisticated Goals typically involve creating “Events”:
 External links
 Sign-ups, form submissions
 Downloads
 Many types of conversion goals
 To use Events:
 Define and categorize events.
 Configure and add the javascript code, usually right in the link (not always).
 Many social-share widgets automatically add Events.
 Google Analytics Event Organizer (Smithsonian’s Michelle Herman)
 The Complete Google Analytics Event Tracking Guide Plus 10 Amazing
Examples (old code, good examples)
28
Improve your program!
‘Event Tracking’ is super-important
#musedata
 No actionable data
 Sessions (previously Visits)
 Users (previously Visitors)
 Pages (a.k.a. Pageviews)
 Establish scope / context.
 Measure growth / acquisition.
 You can’t improve your site by
measuring these.
 Reporting them out of context can be
misleading.
29
Satisfy your boss!
The inevitability of “Quantity of Stuff”
Occam's Razor
“All data in
aggregate is crap.”
#musedata
 Display multiple reports
at once.
 “My Dashboard”
(default) included.
 Import from the
Solutions Gallery.
 Share as PDFs.
 Schedule for
distribution by email.
 About Dashboards (Google)
 10 useful Google Analytics
custom dashboards
(Econsultancy)
 How Google Analytics
Dashboards Can Make Your Life
Easier (Kissmetrics)
30
Satisfy your boss!
Dashboards are useful, and easy to make
Customize Dashboards by adding / deleting /
manipulating widgets (up to 12 per dashboard)
Google
#musedata 31
 AAA wanted to make their
content more accessible to
younger students.
 They worked with Wikipedia
to expand their offerings.
 We compared segments of
Wikipedia visitors to other
visitors.
 Wiki-referred visitors were
increasingly less likely to
(need to) visit the AAA site
many times.
 This contrasts with the stable
trend of all visits.
All visits, high
frequency
Wikipedia visits,
high frequency
Validation!
Archives ofAmericanArt Wikipedia Case Study
#musedata
Here is the bottom line!
 Your measurements validate your
tactics (or not).
 To work the process and improve
your site, you need meaningful data:
 Engagement metrics
 Segments
 Goal completion / Conversion rates
 A-B tests
 Qualitative data (surveys)
 If your goal is purely audience
acquisition, you can use “quantity-of-
stuff” metrics to tell your story.
32
NY Daily News
#musedata 33
New(ish), Game-Changing Features
Source: Keith Srakocic, AP
Virginiasports.com
#musedata 34
Demographics and Interests Reports
 Demographics
 Age (traffic by age ranges)
 Gender (traffic by gender)
 Interests – behavior by
 Affinity Categories
 In-Market Categories
 Other Categories
 No PII is tracked!
 You have to add a line of code to your pages
 You have to modify your privacy policy
 https://support.google.com/analytics/answer/2799357
#musedata 35
Insights from Demographics and Interests Reports
 Cyclic Defrost is an online magazine that covers independent electronic music,
avant-rock, experimental sound art, leftfield hip hop and everything in between.
 The largest visitor segment is 25-34 year-olds.
 But… older visitors (45-54) engage the content at a higher rate.
Avg. Visit DurationVisits
#musedata
Benchmarking Reports!
36
 Compare your site to others in the same
category (or across categories).
 Compare by:
 Channels (traffic sources)
 Location
 Devices
 How to find it:
 Search box, or:
 Audience  Benchmarking
 Use top left pull-down; click ‘Reference’
 Scroll down to ‘Libraries & Museums’
 Benchmarking Reports (Google)
#mwmetrics 37
Universal Analytics means all new code
 We are (still…) in phase three of a four-
phased, multi-year rollout.
 All GA accounts have been migrated to
Universal, but many website pages still
carry the old code.
 Phase 4: legacy code will be deprecated
(date TBD – “in the near future”).
 “Data received from deprecated libraries
will... be processed for a minimum of two
years…”
 You should upgrade your code SOON!
 You also need to upgrade custom code,
e.g., events, virtual pageviews, etc.
 Universal Analytics Upgrade Center Vampyre Fangs
A Few Best
Practices
38
Peter Erskine
#mwmetrics
 Create a view that has no
filtering of any kind.
 Leave it alone – it is protection
against unintended
consequences.
 GA filters are powerful, but
irrevocable – if your data is
hosed by a bad or misapplied
filter you are out of luck.
39
Marquette Educator
An add’l ‘playground’ view is
a good idea too, to test those
new filters (and anything else)
You need an unfiltered backup view
#musedata
Filter-out internal-traffic
 Admin >> Account or View >> Filters >> +New Filter
40
41
Use Annotations
 Super easy – a great way to know at-a-glance what
happened historically, launches, promos, etc.
Create new annotationPull-down all annotations
Reveal annotation
#musedata
Google’s “Analytics Academy”
 Free video-based courses
 Digital Analytics
Fundamentals
 Google Analytics Platform
Principles
 Ecommerce Analytics: From
Data to Decisions
 Mobile App Analytics
Fundamentals
 Google Tag Manager
Fundamentals
42
analyticsacademy.withgoogle.com
A few real world questions,
and how I might start trying to
answer them.
43
Question: “Is anybody using
those resources that my
department created?”
44
Behavior > Site Content > All Pages > search for the web directories in
question, e.g. /resources/guides/
Question: “How might we increase
the use of these specific resources?”
46
New custom segment! Let’s benchmark all of those
visitor sessions which include viewing at least one
of the “guide” pages
To work on:
1) making the guides more visible in navigation,
2) getting more inbound links
3) optimizing our page metadata for search engine
findability (SEO)
Acquisition > Overview
Question: “What parts of our
website are most frequently
viewed on phones?”
49
Apply system segment: Mobile Traffic
Behavior > Site Content > All Pages
Behavior > Site Content > All Pages (con’t)
1. Homepage
2. WONDER exhibition page
3. Hours & Directions
4. Exhibitions Overview
5. WONDER online gallery/slideshow
6. Collections Search*
7. Irving Penn exhibition page
8. Highlights from the Collection
9. FAQs
10.Researching your art*
*Not likely to be in-person visitors. Are people really doing research
on their phones?
Raises more questions that need further investigation!
Question: “How about those QR
codes we put in the gallery last
year? Did anybody scan them?”
53
Generate unique custom “campaigns” for each of your
advertising or in-gallery URLs
Acquisition > Campaigns > All Campaigns > Castle Gallery/QR Code
2,100+ is more QR Code sessions than we would have thought! Likely due to 1) appealing content (hidden drawings on
the versos), and 2) a very straightforward call to action (“Scan this code to see the other side of this drawing.”)
What are your real world
questions?
57
#musedata
Resources
 Google Analytics Academy (Google)
 Google Analytics Blog (Google)
 Universal Analytics Upgrade Guide (Google)
 Absolute Beginner's Guide to Google Analytics (moz.com)
 Occam’s Razor (Avinash Kaushik)
 Analytics Talk (Google’s Justin Cutroni)
 Jeffalytics (Jeff Saur)
 Annielytics (Annie Cushing)
 Analytics Edge (Mike Sullivan)
 Kissmetrics blog
 Lunametrics blog / Lunametrics Training
 Cardinal Path Training
 Discover the Google Analytics Platform (advanced tools)
58
#musedata 59
Thanks!
 @balpert
 @sosarasays

Google Analytics for Everyone!

  • 1.
    #musedata Google Analytics forEveryone! 2016 Annual Meeting & MuseumExpo Brian Alpert & Sara Snyder 5/27/2016
  • 2.
    #musedata Agenda 2  Brian –Google Analytics 101  Analytics Process  GA Basics  Metrics and Dimensions  How GA is organized  How can Google Analytics HELP?  New(ish) Game-Changing Features  Universal Analytics mandatory upgrade  A Few Best Practices  Sara – Real Life Examples  Don’t start with the all the data, start with real life questions  “Is anyone finding this new educational resource that we made?”  “What parts of our website are local visitors viewing mostly on their phones?”  “Do we really need to keep maintaining this old microsite?”  Q&A
  • 3.
    #musedata 3 What webanalytics is often about
  • 4.
    #musedata 4 Web analyticsis often about: “So What?”
  • 5.
    #musedata 5 What webanalytics is really about:
  • 6.
    #musedata Your goal: usedata to tell a story  What was happening.  What it meant.  What you did.  What’s happening now. 6 forbes.com
  • 7.
    #musedata There is asystematic, step-by-step process  Articulate your program’s goals.  Decide strategies to achieve those goals.  Decide tactics to pursue the strategies.  Decide what and how to measure to validate the tactics.  Benchmark to get a sense of what’s normal. 7 homedit.com
  • 8.
    #musedata Articulate specific goals Express what you’re trying to accomplish.  Make high-level goals more specific:  “Increase influence” - too broad.  “Become the definitive source on Smithsonian history” - more specific.  Specificity makes it easier to identify strategies and tactics.  Not too many! 8 It’s a Wonderful Life Start the conversation! Articulate goals & next steps on your own; work with management to finalize.
  • 9.
    #musedata Determine strategies &tactics  Strategies – the plans you make to achieve the goals.  Employing social media is a strategy.  Tactics – the things you do to advance the strategy.  Producing a specific type of content is a tactic.  Individual channels (facebook, twitter) are tactics.  Per the example:  Goal: “Become the definitive source on Smithsonian history.”  Strategy: Increase engagement with history of the Smithsonian content.  Tactic: Make SI-history content more findable and measureable. 9
  • 10.
    #musedata Decide how tomeasure your tactics  Choose measurements to learn if your tactics are succeeding.  Choose a few measurements.  Trend them over time.  Per the example:  Strategy: increase engagement with SI history website content.  Tactic: make website history content more findable / measureable.  Make a “history-content” segment and measure for engagement:  Visit frequency  Visit depth  Bounce rate 10 History- related visits All visits “Deep history visits” were 94% higher!
  • 11.
    #musedata 11 You can’tset targets w/o benchmarks  You need at least six months of data.  Data is seasonal.  Depends on your traffic.  Balance targets with factors beyond your control:  Are the improvements you’re seeking difficult to achieve?  How much resources will you have to implement tactics? Drinks Enthusiast
  • 12.
    #musedata 12 Keep itsimple!  Don’t do too much!  Minimize the number of measurements.  If they turn-out to be inconclusive, change up.  It’s an ongoing process! arvinddevalia.com
  • 13.
  • 14.
    #musedata 14 GA Basics The most basic thing  Navigating Google Analytics  GA in your world Army Times
  • 15.
    #musedata  Dimensions describethe data, or an attribute of the user (“what”):  Traffic source  City  Page  Metrics measure the data (“how many”, “how long”):  Sessions  Bounce rate  Time on page  Lunametrics  Optimizesmart  Dimensions & Metrics Explorer (Google) 15 Optimizesmart Dimensions Metrics GA’s familiar color-coding helps you keep track of Dimensions and Metrics. The most basic thing Dimensions and Metrics
  • 16.
    #musedata 16 Navigating GoogleAnalytics How GA is organized Home Searchable list of all GA accounts associated with your Google Account.
  • 17.
    #musedata 17 Navigating GoogleAnalytics How GA is organized Reporting Where GA’s reports are located.
  • 18.
    #musedata 18 Navigating GoogleAnalytics How GA is organized Customization Where Custom Reports are located.
  • 19.
    #musedata 19 Navigating GoogleAnalytics How GA is organized Admin Settings for your: 1. Account 2. Property (individual websites) 3. View (you can setup different “views” – with custom filters, etc.)
  • 20.
    #musedata 20 LunaMetrics Navigating GoogleAnalytics How GA is organized  These four sections under “Reporting” house most of the reports. Audience Acquisition Behavior Conversions
  • 21.
    #musedata 21  Improveyour program?  Yes! Good for you!  Satisfy your boss with monthly Big Numbers?  Sure. It is what it is.  Validate (or not) something you’ve already done.  Um, maybe. Wikipedia GA in your world How can Google Analytics HELP?
  • 22.
    #musedata 22 Improve yourprogram! Segmentation: GA’s most powerful feature?  Analyze subsets of traffic.  Search engine traffic  Social media traffic  Demographics  Import expert-made segments from the Solutions Gallery!  Google Blog  Kissmetrics Overview  Examples (Cutroni)  Examples (Kaushik) Segments are accessed by clicking “Add Segment”. “Organic Traffic” is shown. All Users Organic (Search Engine) Traffic
  • 23.
    #musedata All Visits datatells a nice story... 23 Minimal frequency group (purple) downward trend indicates improving content engagement High frequency group (blue) upward trend indicates same Impact of this Data on the Site or Program • This good-looking chart may indicate high content engagement and/or perceived value • This data may correlate to increasing conversion behaviors Acting on this Data • Identify moderate and high loyalty pages as a means of duplicating, or improving others • Examining conversion behaviors of these segments may yield add'l insights • Correlating high bounce rate pages to one-time visits may yield add'l insights • Test different content types in an attempt to move 'minimal' visitors into 'moderate' group Key Trends and Insights
  • 24.
    #musedata 24 This Impactof this Data on the Site or Program • Organic search listings are driving poorly-targeted traffic • Will result in decreased organic search performance over time Acting on this Data • Refocus title tags, meta-description tags and page content for important pages • Perform link analysis to see where other SEO improvements can be made Minimal frequency group upward trend indicates organic listings are not appropriately targeted Moderate frequency group downward trend indicates same High frequency group trending slightly downward, in contrast to previous chart’s upward slope Key Trends and Insights …But applying segmentation tells a different story
  • 25.
    #musedata  Under Audience>> Behavior  Frequency  Recency  Page Depth (“Engagement”)  “New vs. Returning” (e-nor post)  Use with segments:  Traffic from search  Traffic from mobile  Etc.  ‘Time on site’ is great, but do not rely solely on it.  Due to technical issues 25 Improve your program! Metrics as proxies for user engagement
  • 26.
    #musedata  Create yourown reports.  Import custom reports from the Solutions Gallery.  Create and manage Custom Reports (Google)  12 Awesome Custom Reports Created by the Experts (Kissmetrics)  3 Awesome, Downloadable, Custom Web Analytics Reports (Kaushik)  5 Google Analytics Custom Reports FTW! (Kaushik) 26 Create and access Custom Reports from the ‘Customization’ tab. Improve your program! Custom Reports can save you time & effort Custom Reports can be scheduled for delivery via email in a variety of formats.
  • 27.
    #musedata  A conversionis any measureable behavior with an implicitly (or explicitly) higher value.  Conversion rates are more informative than merely counting the number of times something has happened.  Typical conversion goals:  Destination (ex: thanks.html)  Duration (ex: 5 minutes or more)  Pages/Screens per session (ex: 3 pages)  Event (download PDF, play video)  REQUIRES CODE 27 Improve your program! Deeper understanding with Conversion Goals Studying conversion rates levels the playing field, versus merely counting!
  • 28.
    #musedata  More sophisticatedGoals typically involve creating “Events”:  External links  Sign-ups, form submissions  Downloads  Many types of conversion goals  To use Events:  Define and categorize events.  Configure and add the javascript code, usually right in the link (not always).  Many social-share widgets automatically add Events.  Google Analytics Event Organizer (Smithsonian’s Michelle Herman)  The Complete Google Analytics Event Tracking Guide Plus 10 Amazing Examples (old code, good examples) 28 Improve your program! ‘Event Tracking’ is super-important
  • 29.
    #musedata  No actionabledata  Sessions (previously Visits)  Users (previously Visitors)  Pages (a.k.a. Pageviews)  Establish scope / context.  Measure growth / acquisition.  You can’t improve your site by measuring these.  Reporting them out of context can be misleading. 29 Satisfy your boss! The inevitability of “Quantity of Stuff” Occam's Razor “All data in aggregate is crap.”
  • 30.
    #musedata  Display multiplereports at once.  “My Dashboard” (default) included.  Import from the Solutions Gallery.  Share as PDFs.  Schedule for distribution by email.  About Dashboards (Google)  10 useful Google Analytics custom dashboards (Econsultancy)  How Google Analytics Dashboards Can Make Your Life Easier (Kissmetrics) 30 Satisfy your boss! Dashboards are useful, and easy to make Customize Dashboards by adding / deleting / manipulating widgets (up to 12 per dashboard) Google
  • 31.
    #musedata 31  AAAwanted to make their content more accessible to younger students.  They worked with Wikipedia to expand their offerings.  We compared segments of Wikipedia visitors to other visitors.  Wiki-referred visitors were increasingly less likely to (need to) visit the AAA site many times.  This contrasts with the stable trend of all visits. All visits, high frequency Wikipedia visits, high frequency Validation! Archives ofAmericanArt Wikipedia Case Study
  • 32.
    #musedata Here is thebottom line!  Your measurements validate your tactics (or not).  To work the process and improve your site, you need meaningful data:  Engagement metrics  Segments  Goal completion / Conversion rates  A-B tests  Qualitative data (surveys)  If your goal is purely audience acquisition, you can use “quantity-of- stuff” metrics to tell your story. 32 NY Daily News
  • 33.
    #musedata 33 New(ish), Game-ChangingFeatures Source: Keith Srakocic, AP Virginiasports.com
  • 34.
    #musedata 34 Demographics andInterests Reports  Demographics  Age (traffic by age ranges)  Gender (traffic by gender)  Interests – behavior by  Affinity Categories  In-Market Categories  Other Categories  No PII is tracked!  You have to add a line of code to your pages  You have to modify your privacy policy  https://support.google.com/analytics/answer/2799357
  • 35.
    #musedata 35 Insights fromDemographics and Interests Reports  Cyclic Defrost is an online magazine that covers independent electronic music, avant-rock, experimental sound art, leftfield hip hop and everything in between.  The largest visitor segment is 25-34 year-olds.  But… older visitors (45-54) engage the content at a higher rate. Avg. Visit DurationVisits
  • 36.
    #musedata Benchmarking Reports! 36  Compareyour site to others in the same category (or across categories).  Compare by:  Channels (traffic sources)  Location  Devices  How to find it:  Search box, or:  Audience  Benchmarking  Use top left pull-down; click ‘Reference’  Scroll down to ‘Libraries & Museums’  Benchmarking Reports (Google)
  • 37.
    #mwmetrics 37 Universal Analyticsmeans all new code  We are (still…) in phase three of a four- phased, multi-year rollout.  All GA accounts have been migrated to Universal, but many website pages still carry the old code.  Phase 4: legacy code will be deprecated (date TBD – “in the near future”).  “Data received from deprecated libraries will... be processed for a minimum of two years…”  You should upgrade your code SOON!  You also need to upgrade custom code, e.g., events, virtual pageviews, etc.  Universal Analytics Upgrade Center Vampyre Fangs
  • 38.
  • 39.
    #mwmetrics  Create aview that has no filtering of any kind.  Leave it alone – it is protection against unintended consequences.  GA filters are powerful, but irrevocable – if your data is hosed by a bad or misapplied filter you are out of luck. 39 Marquette Educator An add’l ‘playground’ view is a good idea too, to test those new filters (and anything else) You need an unfiltered backup view
  • 40.
    #musedata Filter-out internal-traffic  Admin>> Account or View >> Filters >> +New Filter 40
  • 41.
    41 Use Annotations  Supereasy – a great way to know at-a-glance what happened historically, launches, promos, etc. Create new annotationPull-down all annotations Reveal annotation
  • 42.
    #musedata Google’s “Analytics Academy” Free video-based courses  Digital Analytics Fundamentals  Google Analytics Platform Principles  Ecommerce Analytics: From Data to Decisions  Mobile App Analytics Fundamentals  Google Tag Manager Fundamentals 42 analyticsacademy.withgoogle.com
  • 43.
    A few realworld questions, and how I might start trying to answer them. 43
  • 44.
    Question: “Is anybodyusing those resources that my department created?” 44
  • 45.
    Behavior > SiteContent > All Pages > search for the web directories in question, e.g. /resources/guides/
  • 46.
    Question: “How mightwe increase the use of these specific resources?” 46
  • 47.
    New custom segment!Let’s benchmark all of those visitor sessions which include viewing at least one of the “guide” pages
  • 48.
    To work on: 1)making the guides more visible in navigation, 2) getting more inbound links 3) optimizing our page metadata for search engine findability (SEO) Acquisition > Overview
  • 49.
    Question: “What partsof our website are most frequently viewed on phones?” 49
  • 50.
    Apply system segment:Mobile Traffic
  • 51.
    Behavior > SiteContent > All Pages
  • 52.
    Behavior > SiteContent > All Pages (con’t) 1. Homepage 2. WONDER exhibition page 3. Hours & Directions 4. Exhibitions Overview 5. WONDER online gallery/slideshow 6. Collections Search* 7. Irving Penn exhibition page 8. Highlights from the Collection 9. FAQs 10.Researching your art* *Not likely to be in-person visitors. Are people really doing research on their phones? Raises more questions that need further investigation!
  • 53.
    Question: “How aboutthose QR codes we put in the gallery last year? Did anybody scan them?” 53
  • 54.
    Generate unique custom“campaigns” for each of your advertising or in-gallery URLs
  • 55.
    Acquisition > Campaigns> All Campaigns > Castle Gallery/QR Code
  • 56.
    Acquisition > Campaigns> All Campaigns > Castle Gallery/QR Code 2,100+ is more QR Code sessions than we would have thought! Likely due to 1) appealing content (hidden drawings on the versos), and 2) a very straightforward call to action (“Scan this code to see the other side of this drawing.”)
  • 57.
    What are yourreal world questions? 57
  • 58.
    #musedata Resources  Google AnalyticsAcademy (Google)  Google Analytics Blog (Google)  Universal Analytics Upgrade Guide (Google)  Absolute Beginner's Guide to Google Analytics (moz.com)  Occam’s Razor (Avinash Kaushik)  Analytics Talk (Google’s Justin Cutroni)  Jeffalytics (Jeff Saur)  Annielytics (Annie Cushing)  Analytics Edge (Mike Sullivan)  Kissmetrics blog  Lunametrics blog / Lunametrics Training  Cardinal Path Training  Discover the Google Analytics Platform (advanced tools) 58
  • 59.