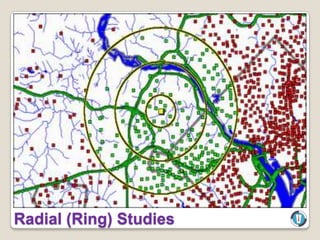
Lecture 13


Trade Area Analysis
   A trading area is a contiguous area from which a
    retailer gets customers for the merchandise he is
    selling

   Trade area analysis and mapping describe the
    characteristics of the area around a store or
    network of stores

   Without accurate trade area definitions, it is not
    possible to measure the key statistics that impact
    a store's performance


Introduction
Percentage Distribution
   Trade area analysis and mapping tells:

       Where a store's customers are coming from

       How many customers you have in a trade area

       Where to look for more customers


Aid Site Selection & Target Marketing
   Analyzing trade areas should be performed regularly to
    provide key metrics for improving sales and marketing
    performance.

   Adding new stores to the network will cause the trade area
    of nearby stores to change.

   In a saturated market, or if stores are placed too close to
    one another, cannibalization can occur.

   A change to product offerings will impact the trade area, as
    will shifts in population and demographics, the existence of
    competitors, changes to highways and roads, and the
    addition of other businesses that attract people to the area.

Factors Impacting Trade Area
   Total size & density (demand & supply) of the population

   Per capita disposable income

   Education level

   Family system (Joint / Nuclear)

   Occupation (job / professional / Business)

   Standard of living

   Age group distribution

   No. of residents owning homes

   No. of manufacturers, suppliers, wholesalers available

   Size of competition

Factors to be Considered for TAA
   Traffic Flow
       Direction of traffic

       Movement of Vehicular Traffic

       Parking facilities

       Distance to store

       Access from major roads

       State of traffic congestion

       Ease of deliveries


Demand Density
   Procurement

   Merchandise Management

   Store Location

   Transportation

   Information


Supply Density
   Personal Factors like:
       Preferences & Emotional Attachment
       Prejudices, Likes & dislikes


   Political Reasons & compulsions

   Unwillingness of key persons to a new & better
    location on the grounds of far distances

   Preference to residential or suburban areas
    eventually getting crowded with time

   Selection without thorough investigation

Common Errors in Store Location
   Identify gaps or overlaps in the market coverage of the
    existing store network, and make corrections by opening,
    closing or moving stores

   Make better site selection decisions by using
    characteristics of existing trade areas to predict trade
    areas around potential locations

   Define a geographic area to analyze for market potential,
    market penetration, and competitive threats

   Become more efficient and effective at target marketing by
    reaching out only to those customers and prospects in a
    store's trade area

   Use as a key input into customer profiling


Benefits of TAA
   Three Theoretical approaches:

       Radial (Ring) Studies

       Gravity Models

       Drive Time Analysis


Techniques of TAA
   Performed by selecting and evaluating demographic
    variables that fall within a pre-defined distance from a store
    location

   This technique assumes that the trade area is circular, with
    the store at its centre

   Ring analysis does not account for barriers such as rivers
    or railroad tracks that may cross through a trade area and
    restrict access to a retail site.

   Radial studies are a simplistic approach that can result in
    an incorrect delineation of the trade area and errors of
    omission or commission

Radial (Ring) Studies
   Gravity models, or spatial interaction models, define a trade area
     based on its attractiveness relative to other trade areas

    These models provide an approximation of store trade area by
     putting the distribution of all locations (including competitors) into a
     geographical context and evaluating each location's relative
     attractiveness

    A distance decay curve is used to model the spatial interaction of
     individual locations. Often size of the store, or store sales if
     available, is used to drive the attractiveness parameter.

    Gravity models are more sophisticated than simple radial
     approximations, but still do not account for logistical barriers and
     they are limited by the availability and accuracy of competitor data.

    Not appropriate for Non-Technical Analysts


Gravity Model
Gravity Model
   Use of GIS tools to digitize the roadway systems that indicate the
     type of road such as a city street or a divided highway

    Speed limits are assigned based on the type of road, the mode of
     transportation (car, truck, motorcycle, etc.), congestion parameters,
     and the time of day

    Parameters used to dictate the ease of traveling along road
     segments

    Through this process, a polygon is generated to represent the
     extent to which a vehicle can travel outward from the site in all
     directions along the existing roadway system


Drive Time Analyses
   Unlike the radial distance or gravity model-based trade area
     approximations, GIS based drive time analyses account for
     logistical barriers

    Drive time analyses are generally considered to be valid for
     “convenience” store scenarios, where patrons are expected to go to
     the closest or most logistically convenient location

    Based on the accuracy and the present state of technology


Drive Time Analyses
Drive Time Analyses
   http://www.businessdecision.info/mapsreportsdata
    /images/tradearea_custdistgraph_lg.gif

   http://www.mappinganalytics.com/trade-area-
    analysis/trade-area-analysis.html

   http://www.directionsmag.com/features.php?featur
    e_id=5

   Donald P. Segal, Spatial Insights Inc., Nov 18,
    1998


References

13 trade area analysis

  • 1.
  • 2.
    A trading area is a contiguous area from which a retailer gets customers for the merchandise he is selling  Trade area analysis and mapping describe the characteristics of the area around a store or network of stores  Without accurate trade area definitions, it is not possible to measure the key statistics that impact a store's performance Introduction
  • 3.
  • 4.
  • 5.
    Trade area analysis and mapping tells:  Where a store's customers are coming from  How many customers you have in a trade area  Where to look for more customers Aid Site Selection & Target Marketing
  • 6.
    Analyzing trade areas should be performed regularly to provide key metrics for improving sales and marketing performance.  Adding new stores to the network will cause the trade area of nearby stores to change.  In a saturated market, or if stores are placed too close to one another, cannibalization can occur.  A change to product offerings will impact the trade area, as will shifts in population and demographics, the existence of competitors, changes to highways and roads, and the addition of other businesses that attract people to the area. Factors Impacting Trade Area
  • 7.
    Total size & density (demand & supply) of the population  Per capita disposable income  Education level  Family system (Joint / Nuclear)  Occupation (job / professional / Business)  Standard of living  Age group distribution  No. of residents owning homes  No. of manufacturers, suppliers, wholesalers available  Size of competition Factors to be Considered for TAA
  • 8.
    Traffic Flow  Direction of traffic  Movement of Vehicular Traffic  Parking facilities  Distance to store  Access from major roads  State of traffic congestion  Ease of deliveries Demand Density
  • 9.
    Procurement  Merchandise Management  Store Location  Transportation  Information Supply Density
  • 10.
    Personal Factors like:  Preferences & Emotional Attachment  Prejudices, Likes & dislikes  Political Reasons & compulsions  Unwillingness of key persons to a new & better location on the grounds of far distances  Preference to residential or suburban areas eventually getting crowded with time  Selection without thorough investigation Common Errors in Store Location
  • 11.
    Identify gaps or overlaps in the market coverage of the existing store network, and make corrections by opening, closing or moving stores  Make better site selection decisions by using characteristics of existing trade areas to predict trade areas around potential locations  Define a geographic area to analyze for market potential, market penetration, and competitive threats  Become more efficient and effective at target marketing by reaching out only to those customers and prospects in a store's trade area  Use as a key input into customer profiling Benefits of TAA
  • 12.
    Three Theoretical approaches:  Radial (Ring) Studies  Gravity Models  Drive Time Analysis Techniques of TAA
  • 13.
    Performed by selecting and evaluating demographic variables that fall within a pre-defined distance from a store location  This technique assumes that the trade area is circular, with the store at its centre  Ring analysis does not account for barriers such as rivers or railroad tracks that may cross through a trade area and restrict access to a retail site.  Radial studies are a simplistic approach that can result in an incorrect delineation of the trade area and errors of omission or commission Radial (Ring) Studies
  • 14.
  • 15.
    Gravity models, or spatial interaction models, define a trade area based on its attractiveness relative to other trade areas  These models provide an approximation of store trade area by putting the distribution of all locations (including competitors) into a geographical context and evaluating each location's relative attractiveness  A distance decay curve is used to model the spatial interaction of individual locations. Often size of the store, or store sales if available, is used to drive the attractiveness parameter.  Gravity models are more sophisticated than simple radial approximations, but still do not account for logistical barriers and they are limited by the availability and accuracy of competitor data.  Not appropriate for Non-Technical Analysts Gravity Model
  • 16.
  • 17.
    Use of GIS tools to digitize the roadway systems that indicate the type of road such as a city street or a divided highway  Speed limits are assigned based on the type of road, the mode of transportation (car, truck, motorcycle, etc.), congestion parameters, and the time of day  Parameters used to dictate the ease of traveling along road segments  Through this process, a polygon is generated to represent the extent to which a vehicle can travel outward from the site in all directions along the existing roadway system Drive Time Analyses
  • 18.
    Unlike the radial distance or gravity model-based trade area approximations, GIS based drive time analyses account for logistical barriers  Drive time analyses are generally considered to be valid for “convenience” store scenarios, where patrons are expected to go to the closest or most logistically convenient location  Based on the accuracy and the present state of technology Drive Time Analyses
  • 19.
  • 20.
    http://www.businessdecision.info/mapsreportsdata /images/tradearea_custdistgraph_lg.gif  http://www.mappinganalytics.com/trade-area- analysis/trade-area-analysis.html  http://www.directionsmag.com/features.php?featur e_id=5  Donald P. Segal, Spatial Insights Inc., Nov 18, 1998 References