Download to read offline


![Total of The 50 Stocks
% of IDX (Total)
IDX (Total)
4,914,394,884
73.94%
6,646,654,075
98,793,210
58.48%
168,928,5544,436,440,259,621
21.76%
965,387,711,308
Bank Central Asia Tbk.
HM Sampoerna Tbk.
Telekomunikasi Indonesia (Persero) Tbk. [S]
Bank Rakyat Indonesia (Persero) Tbk.
Unilever Indonesia Tbk. [S]
Bank Mandiri (Persero) Tbk.
Astra International Tbk. [S]
Bank Negara Indonesia (Persero) Tbk.
Gudang Garam Tbk.
Trikomsel Oke Tbk.
Sumber Alfaria Trijaya Tbk.
Indah Kiat Pulp & Paper Tbk.
Waskita Karya (Persero) Tbk. [S]
Barito Pacific Tbk. [S]
Astra Agro Lestari Tbk. [S]
Elang Mahkota Teknologi Tbk.
Mayora Indah Tbk. [S]
Bank Danamon Indonesia Tbk.
Jasa Marga (Persero) Tbk.
Perusahaan Gas Negara (Persero) Tbk. [S]
0.54
0.10
0.16
Tambang Batubara Bukit Asam (Persero) Tbk. [S]
Bank Pan Indonesia Tbk. 0.06
1.93
0.62
0.49
1.10
0.04
0.33
1.04
0.94
0.17
0.29
24
27
87
72
70
35
138
11
4.72
1.12
12.07
4.53
1.50
4.61
2.98
1.74
1.49
2.06
0.59
0.74
0.55
0.52
0.87
0.75
110
88
0.83
0.33
-
0.20
0.92
0.00
0.06
3.05
0.14
1.73
0.40
0.08
0.40
0.10
0.00
39
50
20
167
66
30
67
537
81
28
377
136
6
92
14
57
122
58
112
324
45
1,195,861
103,784
3,265,347
2
19
1
4
16
3
8
13
17
9
40
34
44
47
29
33
167,940
273,949
19,309 246
73
-
339,193
1,553,162
865
105,071
5,153,464
231,558
487,109
521,099
1,756,266
1,595,127
281,011
482,940
1,039,572
830,742
1,861,254
67,850
563,713
166,799
3,869
906,184
Rimo International Lestari Tbk. [S]
Sarana Menara Nusantara Tbk. [S]
Bayan Resources Tbk.
XL Axiata Tbk. [S]
Metropolitan Kentjana Tbk. [S]
Bumi Serpong Damai Tbk. [S]
Indosat Tbk. [S]
Indoritel Makmur Internasional Tbk. [S]
Surya Citra Media Tbk.
Multi Bintang Indonesia Tbk.
Pakuwon Jati Tbk. [S]
AKR Corporindo Tbk. [S]
Vale Indonesia Tbk. [S]
Bank Tabungan Negara (Persero) Tbk.
Semen Baturaja (Persero) Tbk. [S]
Mitra Keluarga Karyasehat Tbk. [S] 0.41
0.40
0.39
0.39
m. IDR Rank %
7,981,308
1,888,289
20,396,900
7,655,611
2,527,829
7,793,188
5,029,083
2,931,936
2,523,652
3,474,253
995,252
1,256,870
921,088
884,130
0.45
0.44
0.44
0.73
0.71
0.70
0.43
0.43
0.43
0.42
0.42
0.42
0.63
0.55
0.54
0.51
0.50
0.49
0.48
0.47
0.46
0.46
0.46
0.46
27,064,369
26,439,913
25,983,034
25,789,680
7.68
6.97
6.11
5.73
5.69
4.90
4.87
2.11
2.03
1.95
1.54
1.52
1.24
1.13
1.08
0.97
0.96
0.88
0.81
0.78
29,847,154
29,212,836
28,936,116
28,859,529
28,859,435
28,776,622
28,198,767
28,052,332
27,676,142
33,684,592
33,104,317
32,603,601
31,772,160
31,436,443
30,851,561
30,813,519
30,393,475
30,340,550
9,919,764,281
14,550,736,000
2,304,131,850
23,837,645,998
40,936,000,000
Market Capitalization
%m. IDR
510,136,796
462,945,946
406,223,985
380,990,538
378,448,000
325,710,000
323,868,425
140,312,491
134,686,160
129,342,436
102,624,790
101,294,395
82,643,652
75,000,195
71,999,497
64,653,568
48,159,602,400
4,006,329,420
9,936,338,720
10,484,100,000
41,524,501,700
5,470,982,941
13,573,878,400
13,959,785,568
1,924,688,333
24,408,459,120
116,318,076,900
100,799,996,400
24,422,470,380
7,630,000,000
46,199,999,998
40,483,553,140
18,462,169,893
1,924,088,000
3,730,135,136
11,661,908,000
3,566,704,052
3,681,231,699
46,875,122,110
8,780,426,500
5,931,520,000
Bank CIMB Niaga Tbk.
Tower Bersama Infrastructure Tbk.
5,433,933,500
14,184,000,000
14,621,601,234
24,880,290,775
4,531,399,889
United Tractors Tbk. [S]
Indofood CBP Sukses Makmur Tbk. [S]
Chandra Asri Petrochemical Tbk. [S]
Indocement Tunggal Prakarsa Tbk. [S]
Kalbe Farma Tbk. [S]
Indofood Sukses Makmur Tbk. [S]
Semen Indonesia (Persero) Tbk. [S]
Sinar Mas Multiartha Tbk.
Adaro Energy Tbk. [S]
Charoen Pokphand Indonesia Tbk. [S]
30.
31.
43.
44.
45.
46.
47.
48.
49.
32.
33.
34.
35.
36.
37.
38.
39.
40.
21.
22.
23.
24.
25.
26.
27.
28.
29.
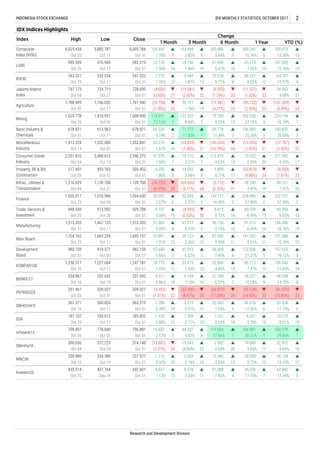
INDONESIA STOCK EXCHANGE IDX MONTHLY STATISTICS, OCTOBER 2017 15
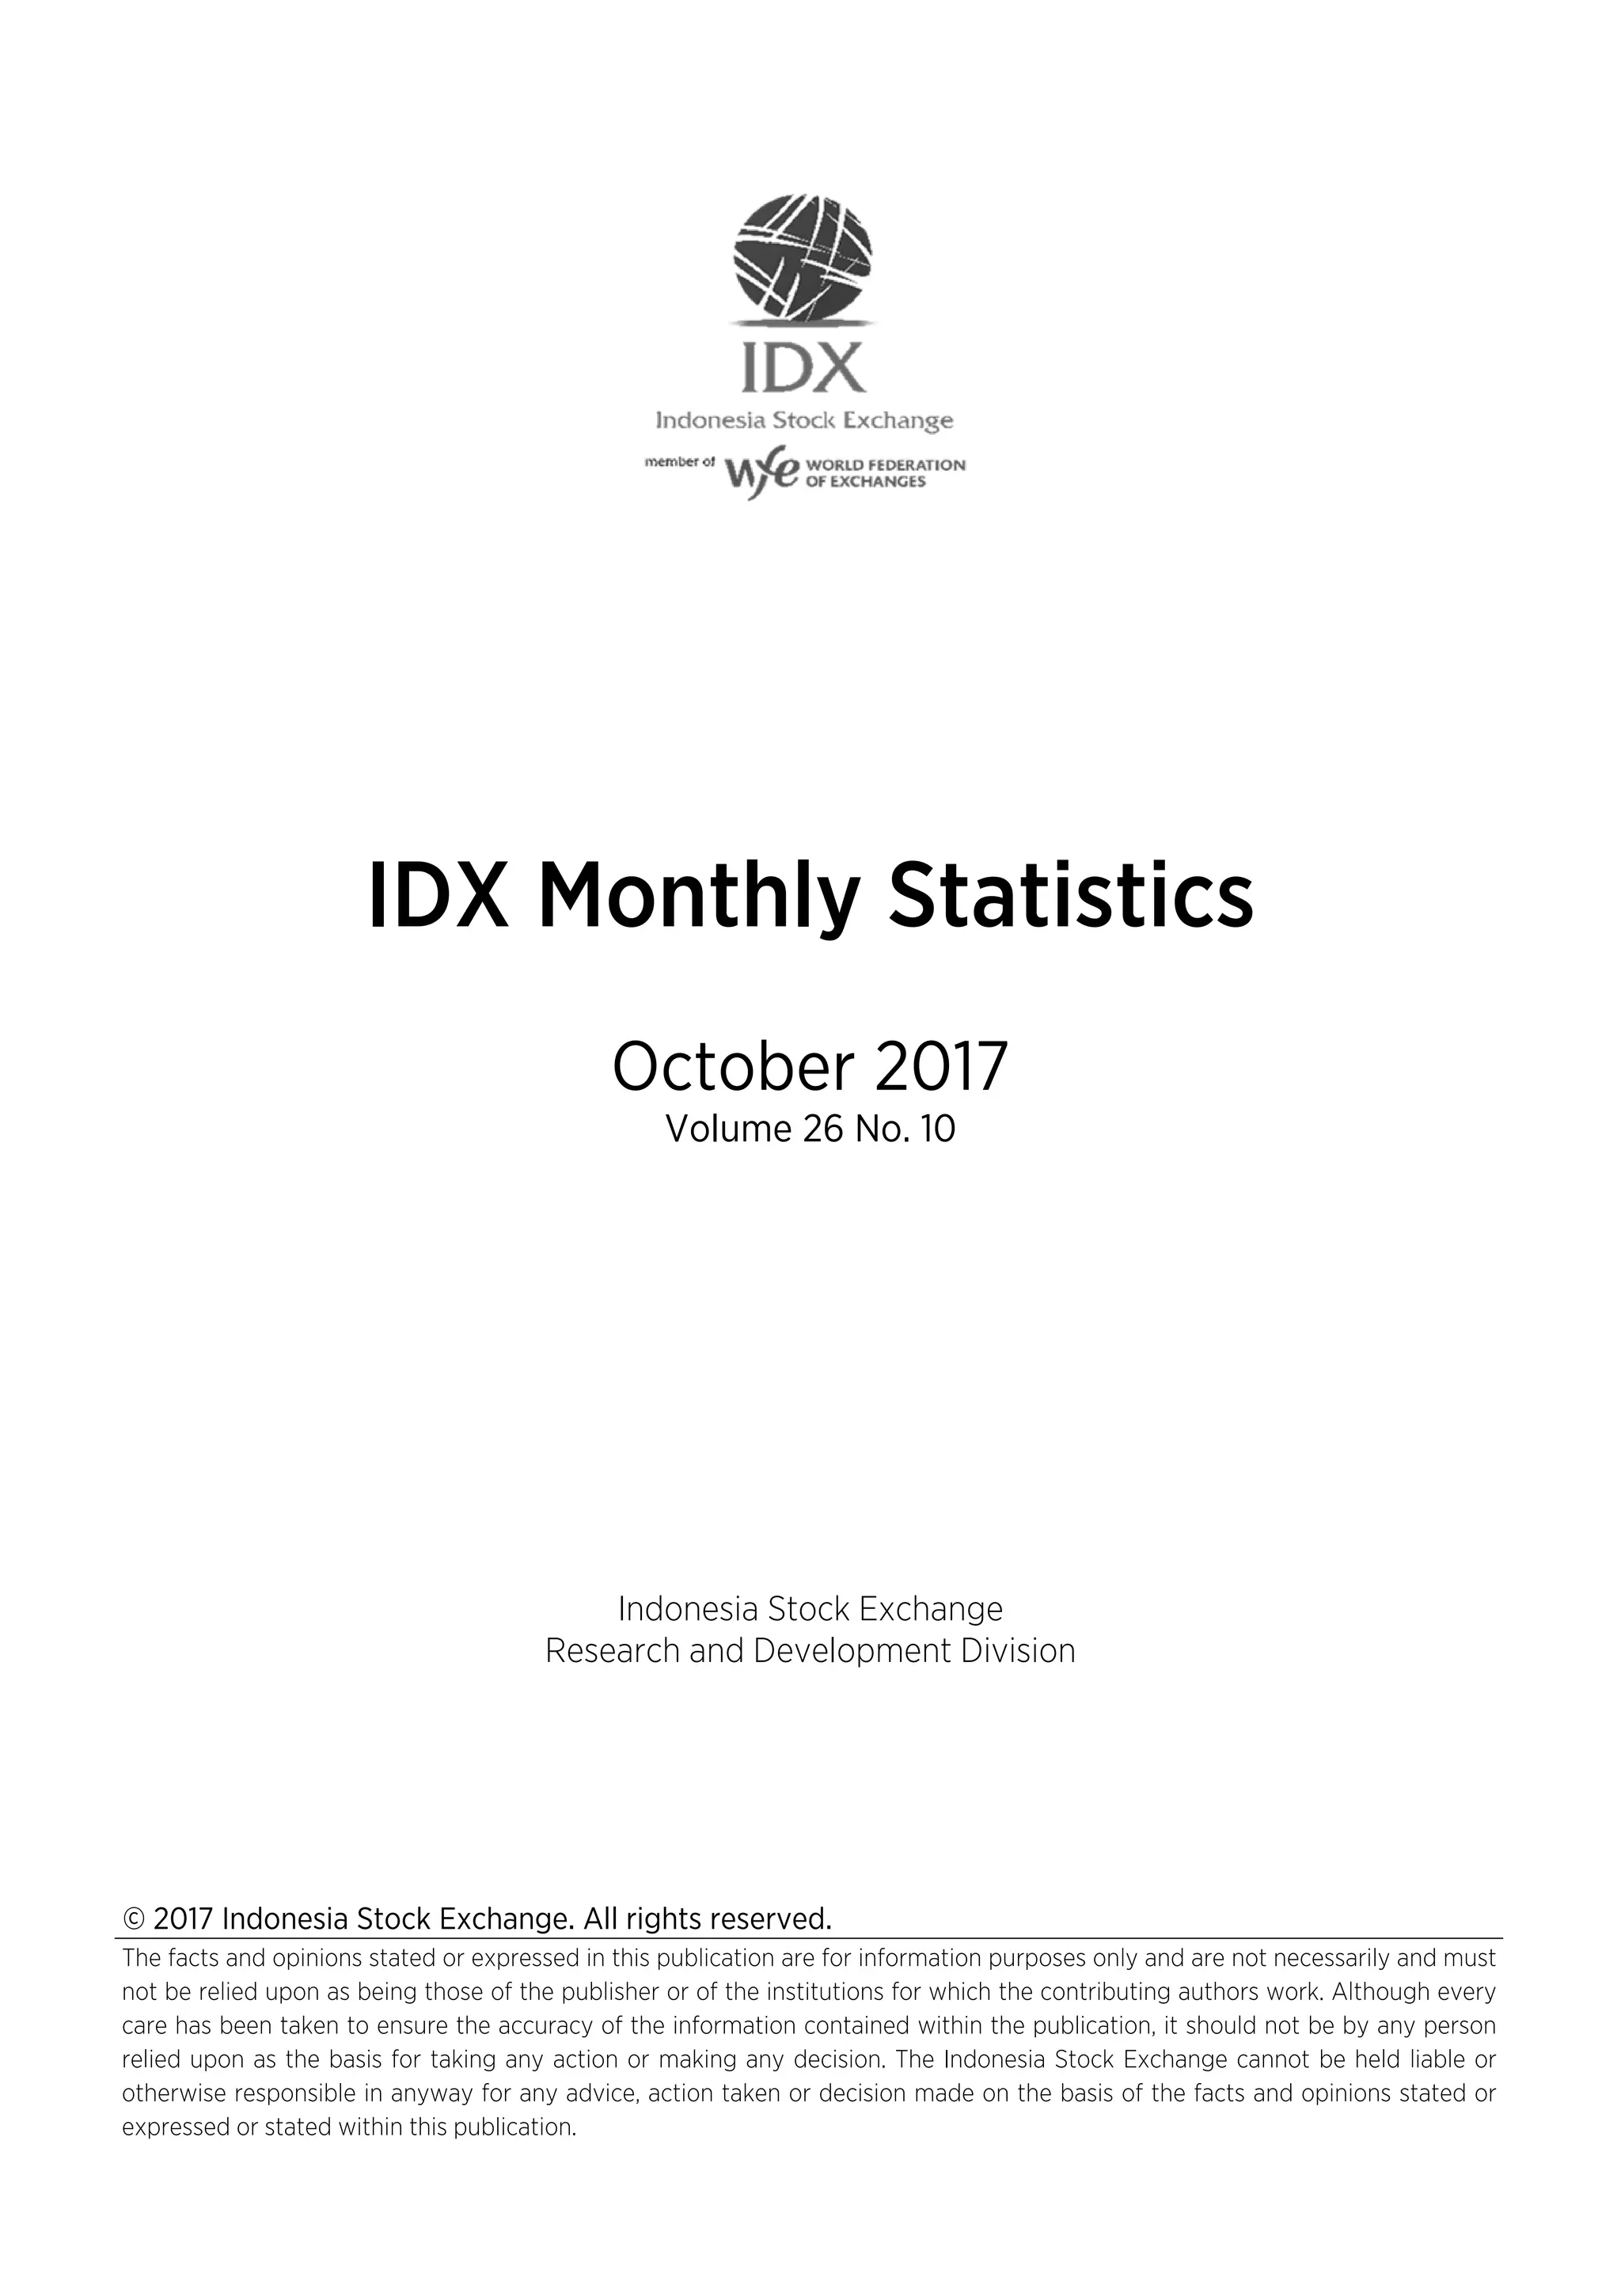
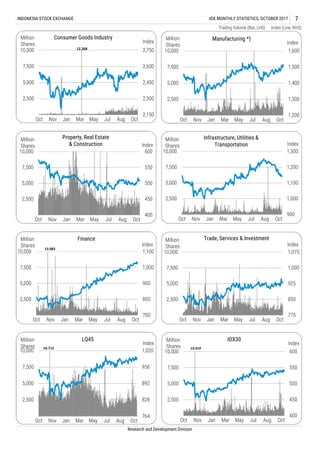
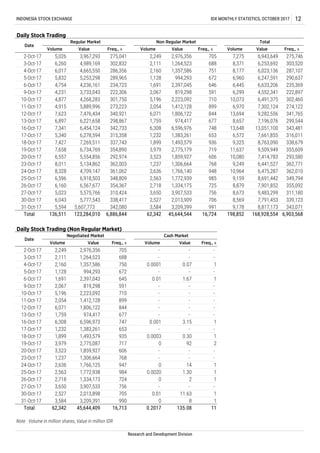
50 Biggest Market Capitalization
No.
Number of Listed
Shares
1.
Trading Value
Listed Stocks
2.
3.
4.
5.
6.
7.
8.
9.
10.
14.
11.
12.
13.
1,463,871
1,260,583
455,309 75 0.27
52,014,989
6,367,664,717
31,985,962,000
16,398,000,000
26,007,494,645
15.
16.
17.
18.
19.
20.
63,517,456
58,374,381
54,113,400
1,394,964
562,300
48,392,864
47,176,163
0.69
0.67
19,246,696,192
2,929,590
683,307
134,056
676,804
22,358,699,725
24,241,508,196
10,202,925,000
3,333,333,500
10,687,960,423
948,194,000
9,488,796,931
7,257,871,200
5,640,032,442 46,248,266
45,835,334
44,604,375
41,831,993
36,583,335
36,125,306
0.01
0.29
41.
42.
0.31
0.71
50.
2,107,000,000
Research and Development Division](https://image.slidesharecdn.com/10idxmonthlystatisticsoktober2017-201219125924/85/10-idx-monthly-statistics-oktober-2017-18-320.jpg)
![Total of The 20 Stocks
% of Total Trading
Total Trading
Total of The 20 Stocks
% of Total Trading
Total Trading
22
22
22
22
22
22
22
22
22
22
22
22
22
22
22
22
1.09
Volume
Total Trading Trading
Days
15,557,548,130
14,088,634,988
13,047,622,000
12,731,822,400
6,687,820,772
5,844,947,790
4,707,517,526
4,329,782,420
4,162,655,640
3,714,315,370
3,639,640,375
3,508,613,185
3,309,375,201
3,232,680,581
3,213,316,540
2,174,886,574
22
22
22
22
3,003,837,300
2,720,744,700
2.18
2.09
1.87
1.83
1.76
1.66
1.63
1.62
1.51
15.
16.
17.
18.
19.
20.
Hanson International Tbk. [S]
Bumi Resources Tbk.
Sri Rejeki Isman Tbk.
Inti Agri Resources Tbk. [S]
Rimo International Lestari Tbk. [S]
Trada Alam Minera Tbk
Telekomunikasi Indonesia (Persero) Tbk. [S]
Waskita Beton Precast Tbk. [S]
Sentul City Tbk. [S]
Nusantara Infrastructure Tbk. [S]
Medco Energi Internasional Tbk.
Sawit Sumbermas Sarana Tbk. [S]
Bakrieland Development Tbk.
Energi Mega Persada Tbk.
Perusahaan Gas Negara (Persero) Tbk. [S]
10.
7.08
6.56
6.40
3.36
2.94
3,065,037,339,990
5,043,210,801,500
13.
14.
2,800,517,084,200
3,265,346,824,510
924,076,400,800
20,396,899,907,832
1,669,987,918,760
584,079,525,560
731,304,358,554
1,858,427,555,441
5,230,981,720,305
137,250,846,723
306,210,251,426
Research and Development Division
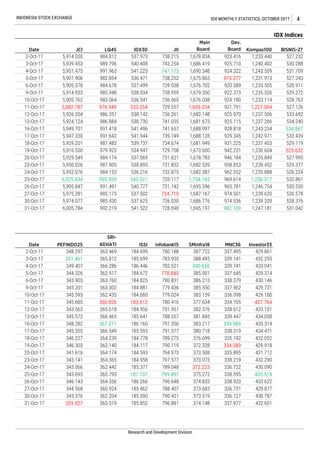
INDONESIA STOCK EXCHANGE IDX MONTHLY STATISTICS, OCTOBER 2017 16
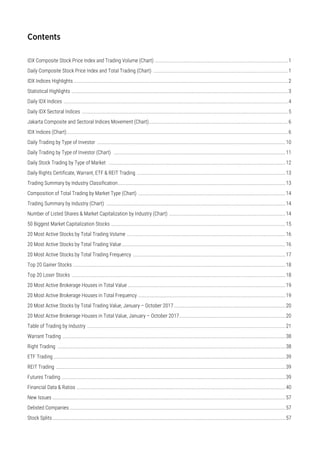
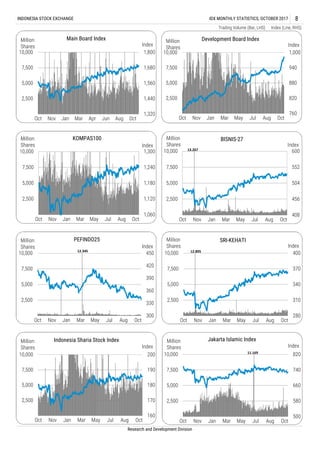
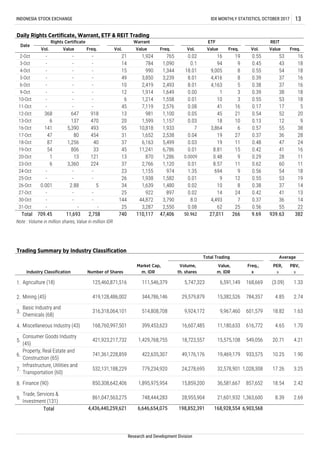
20 Most Active Stocks by Total Trading Volume
No. Listed Stocks
1.
2.
3.
4.
5.
6.
%
7.82
1,037,943,074
6,687,820,772
14,088,634,988
388,193,924
667,289,500
7.
8.
9.
2.37
Freq. (x)
19,136
211,983
204,944
9,641
110,990
126,546
235,688
113,699
58,873
Value (IDR)
1,842,144,020,768
Mas Murni Indonesia Tbk. [S]
11,262
52,343
1. Telekomunikasi Indonesia (Persero) Tbk. [S]
11.
12.
Bakrie & Brothers Tbk.
Bumi Resources Minerals Tbk. [S]
PP Properti Tbk. [S]
Modernland Realty Tbk. [S]
1.37
1.33
1.14
2,641,427,821
2,270,030,500
198,852,391,482
3,213,316,540
13,047,622,000
622,575,885
103,008,326
114,587,219,813
57.6%
198,852,391,482
1,585,947
23.0%
6,903,568
32.5%
168,928,554,438,167
4,707,517,526 235,688
38,138
48,035
26,801
303
48,586
194,826
2,104
26,795
45,254
5,153,463,927,013
126,882,219,500
171,487,015,800
561,948,846,942
870,796,305,775
229,915,671,738
54,969,968,543,137
5.
2.
3.
20 Most Active Stocks by Total Trading Value
No. Listed Stocks
Total Trading Trading
DaysVolume %Value (IDR) Freq. (x)
12.07
4.72
4.61
22
388,987,598
1,130,305,579
495,406,372
3,508,613,185
20. Bank Tabungan Negara (Persero) Tbk. 630,982,840 92,9551,861,254,047,197
18.
19.
16.
17.
14.
15.
12.
13.
10.
11.
8.
9.
6.
7.
4.
Rimo International Lestari Tbk. [S]
Bumi Resources Tbk.
Bank Negara Indonesia (Persero) Tbk.
Bayan Resources Tbk.
Inti Agri Resources Tbk. [S]
Unilever Indonesia Tbk. [S]
Gudang Garam Tbk.
Matahari Department Store Tbk. [S]
HM Sampoerna Tbk.
Bank Central Asia Tbk.
Bank Mandiri (Persero) Tbk.
Bank Rakyat Indonesia (Persero) Tbk.
Sawit Sumbermas Sarana Tbk. [S]
Perusahaan Gas Negara (Persero) Tbk. [S]
Sri Rejeki Isman Tbk.
Astra International Tbk. [S]
United Tractors Tbk. [S]
Pool Advista Indonesia Tbk.
12,731,822,400
50,966,868
38,515,682
262,619,677
483,630,799
20,396,899,907,832
7,981,307,769,173
7,793,188,147,945
7,655,611,053,027
5,230,981,720,305
5,153,463,927,013
5,043,210,801,500
5,029,083,015,625
3,474,252,735,796
3,362,622,818,280
3,265,346,824,510
3,065,037,339,990
2,931,935,666,502
2,929,590,415,000
2,800,517,084,200
2,527,828,595,310
2,523,651,522,300
2,491,377,917,917
1,888,289,386,230
4.53
3.10
3.05
2.99
2.98
2.06
1.99
1.93
1.81
1.74
1.73
1.66
1.50
1.49
1.47
1.12
1.10
108,732
72,621
75,835
26,801
194,826
204,944
78,494
96,112
1,655
110,990
211,983
53,383
490
9,641
48,150
75,945
80,217
47,188
22
22
22
22
22
22
22
22
22
22
22
22
19
22
22
22
22
22
22
64,285,773,535 97,405,450,695,652
57.7%
168,928,554,438,167
1,826,650
6,903,568
32.3% 26.5%](https://image.slidesharecdn.com/10idxmonthlystatisticsoktober2017-201219125924/85/10-idx-monthly-statistics-oktober-2017-19-320.jpg)
![Total of The 20 Stocks
% of Total Trading
Total Trading
49.1%
60,001,823,002
30.2%
INDONESIA STOCK EXCHANGE IDX MONTHLY STATISTICS, OCTOBER 2017 17
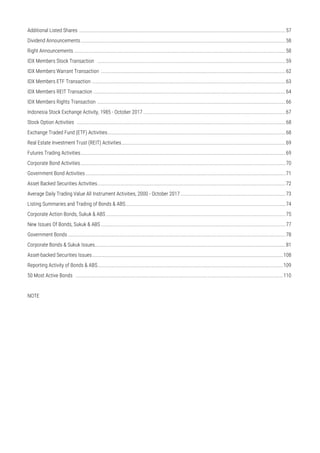
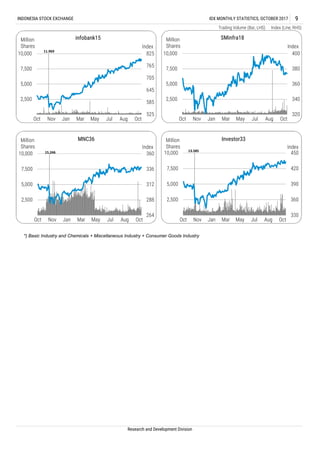
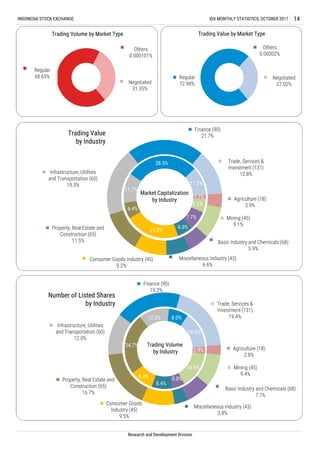
20 Most Active Stocks by Total Trading Frequency
No. Listed Stocks
Total Trading Trading
DaysVolume Value (IDR) %Freq. (x)
9.
10.
7.
8.
5.
6.
3.
4.
1.
2.
19.
20.
17.
18.
15.
16.
13.
14.
11.
12.
198,852,391,482 168,928,554,438,167
Telekomunikasi Indonesia (Persero) Tbk. [S]
Bumi Resources Tbk.
Sri Rejeki Isman Tbk.
Perusahaan Gas Negara (Persero) Tbk. [S]
Pan Brothers Tbk. [S]
Trada Alam Minera Tbk
Global Mediacom Tbk. [S]
Waskita Beton Precast Tbk. [S]
Rimo International Lestari Tbk. [S]
Bank Central Asia Tbk.
United Tractors Tbk. [S]
Bank Tabungan Negara (Persero) Tbk.
Waskita Karya (Persero) Tbk. [S]
Kresna Graha Investama Tbk.
Matahari Department Store Tbk. [S]
Astra International Tbk. [S]
Gudang Garam Tbk.
Bank Rakyat Indonesia (Persero) Tbk.
Indika Energy Tbk. [S]
Bank Mandiri (Persero) Tbk.
4,707,517,526
82,911,760,362,438
1,700,528,402
262,619,677
622,575,885
38,515,682
495,406,372
585,957,100
14,088,634,988
13,047,622,000
3,213,316,540
471,447,400
5,844,947,790
788,120,993
4,329,782,420
6,687,820,772
388,987,598
1,130,305,579
20,396,899,907,832
3,065,037,339,990
5,043,210,801,500
5,153,463,927,013
232,711,062,400
924,076,400,800
459,076,114,895
1,669,987,918,760
3,265,346,824,510
7,981,307,769,173
3,474,252,735,796
1,861,254,047,197
1,756,265,795,990
866,617,405,568
2,491,377,917,917
5,029,083,015,625
2,523,651,522,300
7,655,611,053,027
1,269,340,654,200
7,793,188,147,945
103,008,326
630,982,840
863,725,112
96,112
92,955
88,294
83,312
80,217
78,494
75,945
75,835
235,688
211,983
204,944
194,826
144,927
126,546
114,068
113,699
110,990 22
75,217
72,621
3.41
3.07
2.97
2.82
2.10
1.83
1.65
1.65
1.61
1.58
1.39
1.35
1.28
1.21
1.16
1.14
1.10
1.10
1.09
1.05
108,732
22
22
2,385,405
34.6%
6,903,568
Research and Development Division
22
22
22
22
22
22
22
22
22
22
22
22
22
22
22
22
22](https://image.slidesharecdn.com/10idxmonthlystatisticsoktober2017-201219125924/85/10-idx-monthly-statistics-oktober-2017-20-320.jpg)
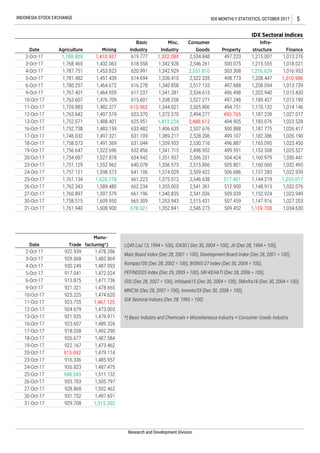
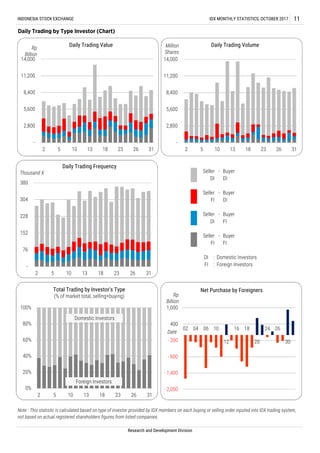
![* Adjusted price if there are any corporate actions/ IPO price of the Company Listed in this month
Research and Development Division
350 350 300 1.00 -50 -14.29
410 410 352 1.00 -58 -14.15
19.
20.
Bank Yudha Bhakti Tbk.
Tunas Alfin Tbk.
330 330 278 1.00 -52 -15.76
380 380 324 1.00 -56 -14.74
2,800 2,800 2,340 1.00 -460 -16.43
3,570 3,570 3,000 1.00 -570 -15.97
164 164 135 1.00 -29 -17.68
1,540 1,540 1,280 1.00 -260 -16.88
4,850 4,850 3,950 1.00 -900 -18.56
3,400 3,400 2,790 1.00 -610 -17.94
10,200 10,200 8,200 1.00 -2,000 -19.61
77 77 62 1.00 -15 -19.48
1,500 1,500 1,150 1.00 -350 -23.33
312 312 244 1.00 -68 -21.79
380 380 290 1.00 -90 -23.68
1,195 1,195 915 1.00 -280 -23.43
296 296 216 1.00 -80 -27.03
192 192 144 1.00 -48 -25.00
240 240 117 1.00 -123 -51.25
193 193 134 1.00 -59 -30.57
Hotel Mandarine Regency Tbk. [S]
Trust Finance Indonesia Tbk.
Victoria Investama Tbk.
First Indo American Leasing Tbk.
Arthavest Tbk. [S]
Tembaga Mulia Semanan Tbk. [S]
Industri dan Perdagangan Bintraco Dharma Tbk.
Armidian Karyatama Tbk.
Elang Mahkota Teknologi Tbk.
Express Transindo Utama Tbk.
Plaza Indonesia Realty Tbk. [S]
Semen Baturaja (Persero) Tbk. [S]
Graha Andrasenta Propertindo Tbk. [S]
Austindo Nusantara Jaya Tbk. [S]
Golden Energy Mines Tbk. [S]
Pelat Timah Nusantara Tbk. [S]
Dua Putra Utama Makmur Tbk. [S]
Alakasa Industrindo Tbk. [S]
10.
11.
12.
13.
14.
15.
16.
17.
18.
1.
2.
3.
4.
5.
6.
7.
8.
9.
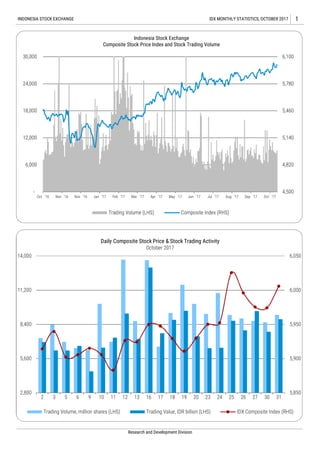
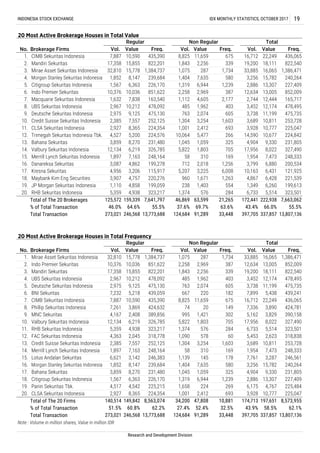
Top 20 Loser Stocks
No. Listed Stocks
Closing Price Dilution
Factors
Change
Last Month Last Month* This Month Price %
412
Listed Stocks Last Month Last Month* This Month
Closing Price Dilution
Factors
Change
Price %
490
52
93
490
300
1,730
2,850
386
10,975
650
605
900
3,660
1,195
675
570
2,330
775
6,400
328
390
1,000
99
308
9,700
490
570
1,445
141
438
695
73
130
Protech Mitra Perkasa Tbk. [S]
Tri Banyan Tirta Tbk.
140
300
100
6,000
386
360
570
2,330
775
6,400
328
390
1,000
99
308
490
52
93
490
300
Inti Bangun Sejahtera Tbk. [S]
Panasia Indo Resources Tbk.
Siwani Makmur Tbk. [S]
Indospring Tbk. [S]
Island Concepts Indonesia Tbk. [S]
Ateliers Mecaniques D'Indonesie Tbk. [S]
Multipolar Technology Tbk. [S]
Anugerah Kagum Karya Utama Tbk.
Bumi Citra Permai Tbk. [S]
Kapuas Prima Coal Tbk. [S]
Kioson Komersial Indonesia Tbk. [S]
Malacca Trust Wuwungan Insurance Tbk.
Bayan Resources Tbk.
Mitrabahtera Segara Sejati Tbk. [S]
Wicaksana Overseas International Tbk. [S]
Asuransi Jasa Tania Tbk.
Mitrabara Adiperdana Tbk. [S]
Mark Dynamics Indonesia Tbk. [S]
6.
7.
8.
18.
19.
20.
9.
10.
11.
12.
13.
14.
15.
16.
17.
INDONESIA STOCK EXCHANGE IDX MONTHLY STATISTICS, OCTOBER 2017 18
Top 20 Gainer Stocks
140
300
100
6,000
386
No.
1.
2.
3.
4.
5.
1135.71
850.00
286.00
82.92
68.39
360
1.00
1.00
1.00
1.00
1.00
1.00
1.00
1.00
1.00
1.00
1.00
1.00
1.00
1.00
1.00
1.00
1.00
1.00
+1,590
+2,550
+286
+4,975
+264
+245
+330
+1,330
+420
+3,300
+162
+180
+445
+42
+130
+205
+21
+37
+185
+112
1.00
1.00
68.06
57.89
57.08
54.19
37.76
37.33
51.56
49.39
46.15
44.50
42.42
42.21
41.84
40.38
39.78](https://image.slidesharecdn.com/10idxmonthlystatisticsoktober2017-201219125924/85/10-idx-monthly-statistics-oktober-2017-21-320.jpg)
![Research and Development Division
Total Trading
Total of The 20 Stocks
% of Total Trading
Total Trading
Total of The 20 Brokerages
% of Total Transaction
Total Transaction
1,901,482,291,655
41.4%
4,593,323,808,838
1,821,188,252,168,310
2,893,834,788,734,410
62.9%
67,019,847
123,652,716
54.2%
57,954,602,209,949
52,077,931,025,528
%
4.8
4.4
4.3
4.2
2.0
1.8
Value (IDR)
138,189,610,856,724
127,084,068,634,336
125,677,620,965,709
120,928,809,673,153
111,566,657,672,614
110,115,065,601,366
108,491,399,141,680
102,741,692,654,270
3.9
3.8
3.7
3.6
3.4
3.2
3.1
3.1
2.4
1,130,202
11,970,915,316 1,723,189
30,143,579,846
347,685,884,137
35,290,583,825
20,645,197,510
136,271,763,835
164,293,136,180
126,167,367,177
98,991,178,699,250
91,709,157,936,136
90,906,375,793,570
88,922,068,945,303
70,551,169,280,442
68,732,297,040,259
67,935,397,287,072
66,443,773,096,133
62,289,075,299,783
59,880,300,355,033
1,449,731
78,131,782,381 2,255,119
190,411,640,762 3,016,138
7,380,886
56,395,588,589 1,925,338
16,521,373,264 2,790,770
1,562,061
46,500,691,326 378,597
188,402,180,839 2,125,175
2.4
2.3
2.3
2.2
2.1
4,600,889
50,896,248,182 2,582,880
34,139,446,759 3,974,512
12,361,486
24,576,949,668 2,180,504
33,104,914,400 2,077,111
2,266,413
200,574,141,299 7,513,329
109,358,906,360 3,725,517
17. Maybank Kim Eng Securities
18. Valbury Sekuritas Indonesia
7. UBS Sekuritas Indonesia
8. Credit Suisse Sekuritas Indonesia
9. Deutsche Sekuritas Indonesia
10. Macquarie Sekuritas Indonesia
11. BCA Sekuritas
Mandiri Sekuritas
3. CIMB Sekuritas Indonesia
4. Mirae Asset Sekuritas Indonesia
19. Ciptadana Sekuritas Asia
20. JP Morgan Sekuritas Indonesia
12. Trimegah Sekuritas Indonesia Tbk.
13. Indo Premier Sekuritas
14. Bahana Sekuritas
15. Merrill Lynch Sekuritas Indonesia
16. Sinarmas Sekuritas
5. Citigroup Sekuritas Indonesia
6. CLSA Sekuritas Indonesia
Sawit Sumbermas Sarana Tbk. [S]
HM Sampoerna Tbk.
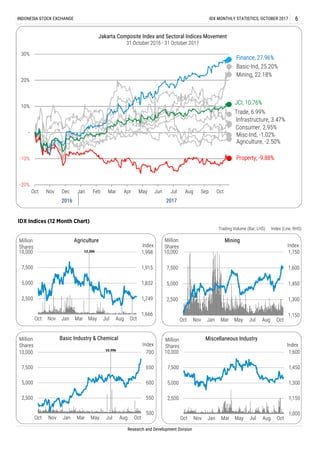
20 Most Active Brokerage Houses by Total Trading Value
January - October 2017
No. Stock Brokerage
20. 1.1 492,70915,433,426,421,821Gudang Garam Tbk.
740,557,447,113,873 14,426,002
51.2%
Volume Freq. (X)
1. Morgan Stanley Sekuritas Indonesia
2.
15,969,918,530,070
INDONESIA STOCK EXCHANGE IDX MONTHLY STATISTICS, OCTOBER 2017 20
20 Most Active Stocks by Total Trading Value
January - October 2017
No. Listed Stocks
1.
%
7.9 863,567
Freq. (X)
114,287,075,380,625
Value (IDR)
Bank Central Asia Tbk.
Total Trading
2.
3.
4.
5.
6.
7.
8.
9.
10.
11.
12.
13.
14.
15.
16.
17.
18.
19. 15,939,338,517,1744,137,978,687
226,042,758
727,192,458,437
94,121,567,148,875
62,575,048,148,223
62,500,391,368,562
55,169,288,055,287
45,215,104,094,399
38,442,844,448,800
33,323,373,736,272
28,151,132,718,925
26,114,788,106,731
24,673,220,887,274
20,376,894,171,496
18,892,583,301,508
18,651,892,151,729
17,260,307,558,891
17,039,224,568,767
16,420,027,798,444
51,891,787,762
75,145,332,567
6,737,796,328
10,430,060,596
1.7
1.4
1.3
1.3
1.2
1.2
1.1
1.1
1.1
468,969
45,417
442,131
346,498
437,828
579,745
1,241,464
761,580
743,202
640,550
1,793,644
417,435
616,646
1,985,144
744,587
709,315
893,764
201,807
1.9
1.8
Telekomunikasi Indonesia (Persero) Tbk. [S]
Bank Rakyat Indonesia (Persero) Tbk.
Astra International Tbk. [S]
Bank Mandiri (Persero) Tbk.
Bumi Resources Tbk.
Hanson International Tbk. [S]
Bank Negara Indonesia (Persero) Tbk.
6.5
4.3
4.3
3.8
3.1
2.7
2.3
Sri Rejeki Isman Tbk.
Matahari Department Store Tbk. [S]
United Tractors Tbk. [S]
Perusahaan Gas Negara (Persero) Tbk. [S]
Chandra Asri Petrochemical Tbk. [S]
Unilever Indonesia Tbk. [S]
Inti Agri Resources Tbk. [S]
Rimo International Lestari Tbk. [S]
BPD Jawa Barat dan Banten Tbk.
61,826,358
DaysVolume
6,480,420,802
21,780,426,183
4,504,368,034
7,778,428,049
5,311,206,393
130,945,776,252
301,438,195,987
5,046,657,611
81,158,867,057
2,063,616,801
907,658,934
9,864,932,458
939,176,267
403,728,911
31.7%
2,296,661,904,419
198
198
198
198
198
198
198
198
198
198
198
198
198
198
198
154
198
198
198
198
23.3%
1,446,917,394,367,210](https://image.slidesharecdn.com/10idxmonthlystatisticsoktober2017-201219125924/85/10-idx-monthly-statistics-oktober-2017-23-320.jpg)
![1
1
1
1
1
2
1
1
1
2
2
1
1
2
1
1
1
1
1
2
2
2
1
2
2
1
1
2
1
2
1
2
5.
Table Trading by Industry
1.1.1.1.
11
12
BISI
1.
2.
7.
1.
10.
1.
3.
11.
9.
4.
15.
16.
14.
13.
244 248 242 246 10/31
1,410 1,540 1,395 1,510 10/31
6.
8.
10/23
10/25
10/03
10/11
10/23
10/02
10/12
217 105,215 12,921 13,361 105,767 12,994 13,365
10/31
10/04
10/18
10/02
10/31
10/26
10/05
Regular Market
226,003
22
10/31
233,888 16,909 22
101,181 24,728 22
375,277 547,565
12,921
19,979
111,878
22
37,303
10/30
10/30
10/30
10/12
10/31
10/26
10/04
10/05
10/17
10/24
820
113 10/31
71 77 70 7,819
1,138
29,344
165
310
1,861
11,283
49
26,801
4,049
6,982
22
22
7
17
22
22
11
22
22
22
Board
06/271,515 1,655 1,455 10/31
14,875 15,175 14,450 14,575 10/31
1,540 1,550 1,210 1,280 10/31
258 264 238 244
Date
10/13
10/19
10/17
10/24
10/16
10/30
10/23
Price
Date
Freq.,
x
168,481
1,138
1,138
153,982
17,033
182
31,325
AALI
ANJT
BWPT
DSNG
GOLL
GZCO
JAWA
LSIP
MAGP
PALM
SGRO
SIMP
SMAR
SSMS
TBLA
UNSP
Prev. High Low Close Date
111,546
4,920
4,920
106,409
28,052
4,293
7,692
5,088
414
432
929
10,303
450
2,392
4,706
8,224
11,489
Industry Classification / Stock Name
10/05
10/03
10/30
2,500 2,300 2,490 10/31
520 580 505 520 10/31
4,150 4,010 3,720 4,000 10/30
480 496 420 480 10/31
109 122 107
72 10/31
1,520 1,550 1,455 1,495 10/31
1,390 1,450 1,385 1,395 10/31
147 216 140 184 10/31
50 50 50 50 10/30
390 400 314 336 10/31
2,380
14,240
7,452
252
12.
49.200
389.677
45.455
91.836
106.410
47.273
1,321.615
223.134
317.659
8.738
Volume,
th. share
Value,
m. IDR
2,888,852
9,682
9,682
2,773,956
15,562
258
900,256
2,425,610
15,005
15,005
2,397,684
229,749
346
224,719
1,518
4,121
372
Days
Days
Freq.,
x
154,161
17,078
185
31,332
377
15,388
3,437
35,813
217
22
26 102 11
3,508,613 5,230,982 22
22,951 32,531 22
112,215 20,812 22
8
42,757 15,868 18
13,201 31,498 22
192,050 102,874
15,388
7,812
1,136
29,302
159
308
1,850
11,268
49
22
22
15
22
17
22
22
1,143
168,669
1,143
19,484 29,762
19,484 29,762 22
5,622,072 6,548,394
19,029 281,011 22
2,778 3,693 15
905,071 226,046 22
19,917 8,834 17
35,813 4,121
Volume,
th. share
Value,
m. IDR
5,747,323 6,591,149
16,375
24,221
513,907
2
1,150
8,813
97,458
102
1,226,121
28,312
20,772
Market
Cap.,
b. IDR
Bisi International Tbk. [S]
Astra Agro Lestari Tbk. [S]
Austindo Nusantara Jaya Tbk. [S]
Eagle High Plantation Tbk.
Dharma Satya Nusantara Tbk.
Golden Plantation Tbk. [S]
Gozco Plantations Tbk.
Jaya Agra Wattie Tbk.
PP London Sumatra Indonesia Tbk. [S]
Multi Agro Gemilang Plantation Tbk.
Provident Agro Tbk. [S]
Sampoerna Agro Tbk. [S]
Salim Ivomas Pratama Tbk. [S]
SMART Tbk.
Sawit Sumbermas Sarana Tbk. [S]
Tunas Baru Lampung Tbk.
Bakrie Sumatera Plantations Tbk.
Index
820.000
1,184.036
106.667
53.365
129.730
39.236
38.274
2213,361 22 105,767 12,994 13,365
22
344,786
99,131
351,599
39
2,977
3,654
181,900
26
821,442
DSFI Dharma Samudera Fishing Industries Tbk. [S] 10/23 10/18 105,215115 134 112 117 10/31
14
26,785
4,044
6,969
21 241,768 15,309,158 7,042,551 460,417 17,799,173 10,818,155 461,473
1. ADRO Adaro Energy Tbk. [S] 1,825 1,935 10/12 1,745 10/03 1,825 10/31 58,374 662,686 1,238,452 72,447 22 746,680 1,394,964 72,586
2.2.2.2. 23,750,464 10,272,168 782,880 29,579,879 15,382,526 784,357
2. ARII Atlas Resources Tbk [S] 775 1,120 10/30 665 10/12 900 10/31 2,700 3,281 2,575 324 22 6,406 5,075 325 22
3. ATPK Bara Jaya Internasional Tbk. [S] 194 - - - - 194 08/26/15 1,117 - - - - - - - -112.677
4. BORN Borneo Lumbung Energi & Metal Tbk. 50 - - - - 50 06/29/15 885 - - - - 16,788 1,124 41 17
5. BRAU Berau Coal Energy Tbk. 82 - - - - 82 05/04/15 2,862 - - - - 439,562 22,286 434 9
4.274
20.500
6. BSSR Baramulti Suksessarana Tbk. [S] 2,350 2,800 10/24 2,020 10/04 2,630 10/31 6,881 146 379 199 19 146 379 199 19
7. BUMI Bumi Resources Tbk. 199 276 10/30 171 10/02 260 10/31 16,998 13,430,837 2,929,527 211,868 22 14,088,635 3,065,037 211,983 22
134.872
15.090
8. BYAN Bayan Resources Tbk. 6,000 12,950 10/25 6,000 10/03 10,975 10/31 36,583 618 5,565 488 19 667,290 2,929,590 490 19
9. DEWA Darma Henwa Tbk. [S] 50 50 10/31 50 10/31 50 10/31 1,093 6,411 321 1,537 21 286,590 13,940 1,612 22
189.224
16.496
11. DSSA Dian Swastatika Sentosa Tbk. [S] 13,800 13,900 10/30 13,800 10/19 13,900 10/30 10,711 4 51 9 8 4 51 9 8
13. GEMS Golden Energy Mines Tbk. [S] 2,800 2,800 10/19 2,270 10/30 2,340 10/31 13,765 5 12 12 6 39,502 114,571 15 8
12. FIRE Alfa Energi Investama Tbk. 1,700 1,695 10/31 1,200 10/13 1,695 10/31 339.000 2,204 1,236 1,897 779 22 67,862 100,565 792 22
14. GTBO Garda Tujuh Buana Tbk. 260 - - - - 260 02/11/15 650 - - - - 10 3 1 1
CROPS
PLANTATION
FISHERY
COAL MINING
Total Market
MININGMININGMININGMINING
AGRICULTUREAGRICULTUREAGRICULTUREAGRICULTURE
10. DOID Delta Dunia Makmur Tbk. 905 1,030 10/18 870 10/03 905 10/31 7,698 902,167 872,944 48,739 22 925,229 894,572 48,770 22
66.587
165.909
60.000
1,225.225
926.667
93.600
226.087
INDONESIASTOCKEXCHANGEIDXMONTHLYSTATISTICS,OCTOBER201721
ResearchandDevelopmentDivision](https://image.slidesharecdn.com/10idxmonthlystatisticsoktober2017-201219125924/85/10-idx-monthly-statistics-oktober-2017-24-320.jpg)
![Table Trading by Industry
Regular Market
Board
Date
Price
Date
Freq.,
xPrev. High Low Close Date
Industry Classification / Stock Name Volume,
th. share
Value,
m. IDR
Days
Days
Freq.,
x
Volume,
th. share
Value,
m. IDR
Market
Cap.,
b. IDR
Index
Total Market
1
1
1
2
2
1
1
2
2
2
1
2
1
2
1
2
1
1
2
2
2
1
2
2
2
1
2
2
1
2
2
1
1
94 2,457 192 166 2,457 192
9. ZINC Kapuas Prima Coal Tbk. [S] 140 1,730 10/30 238 10/16 1,730 10/16 1,235.714 8,737 62,027 77,496 8,857 10 62,953 77,991 8,885 11
24 LAND / STONE QUARRYING 166
1. CTTH Citatah Tbk. [S] 78 81 10/30 75 10/05 76 10/31 94 2,457 192 166
03/20/15 1,822 - - - - 188 274 4 1
21
15. HRUM Harum Energy Tbk. [S] 2,140 2,460 10/25 2,090 10/03 2,350 10/31 6,354 59,060 137,585 13,024 22 61,575 143,205 13,030 22
16. ITMG Indo Tambangraya Megah Tbk. [S] 20,250 23,175 10/24 19,425 10/03 22,200 10/31 25,084 28,417 604,019 38,425 22 35,106 747,961 38,529 22
17. KKGI Resource Alam Indonesia Tbk. [S] 370 380 10/09 342 10/25 356 10/31 1,780 12,203 4,357 1,787 22 12,203 4,357 1,787 22
18. MBAP Mitrabara Adiperdana Tbk. [S] 2,330 3,930 10/31 2,300 10/03 3,660 10/31 4,492 1,703 5,089 1,122 22 1,906 5,606 1,123 22
19. MYOH Samindo Resources Tbk. [S] 660 690 10/11 630 10/02 665 10/31 1,467 6,004 4,022 744 22 6,018 4,031 746 22
20. PTBA Tambang Batubara Bukit Asam (Persero) Tbk. [S] 10,450 11,625 10/31 10,000 10/03 11,475 10/31 26,440 105,935 1,155,989 54,175 22 109,637 1,195,861 54,219 22
21. PTRO Petrosea Tbk. [S] 1,130 1,420 10/18 1,090 10/03 1,325 10/31 1,336 58,051 73,870 12,253 22 59,911 76,179 12,259 22
25. TOBA Toba Bara Sejahtra Tbk. [S] 1,870 1,900 10/27 1,600 10/03 1,895 10/31 3,814 202 377 114 18 202 377 114 18
22 CRUDE PETROLEUM & NATURAL GAS PRODUCTION 23,836 7,209,265 1,773,746 198,428 10,375,292 2,950,960 198,665
22. SMMT Golden Eagle Energy Tbk. [S] 130 141 10/16 125 10/03 138 10/31 435 25,837 3,437 1,784 22 25,837 3,437 1,784 22
24. TKGA Permata Prima Sakti Tbk. 1,800 - - - - 1,800
1. APEX Apexindo Pratama Duta Tbk. 1,780 1,790 10/09 1,770 10/09 1,780 10/31 4,735 2,814 5,009 126 20 2,820 5,025 127 20
2. ARTI Ratu Prabu Energi Tbk. [S] 50 50 10/31 50 10/31 50 10/31 392 1,674 84 308 22 73,822 2,224 420 22
3. BIPI Benakat Integra Tbk. 85 94 10/24 80 10/03 84 10/31 3,067 1,091,289 94,885 26,396 22 1,292,763 112,671 26,427 22
4. ELSA Elnusa Tbk. [S] 304 342 10/17 294 10/09 308 10/31 2,248 2,060,472 656,249 57,934 22 2,074,776 660,750 57,946 22
5. ENRG Energi Mega Persada Tbk. 79 113 10/24 71 10/11 99 10/31 608 3,084,837 294,761 48,537 22 3,232,681 306,210 48,586 22
6. ESSA Surya Esa Perkasa Tbk. 1,800 2,300 10/20 176 10/31 179 10/31 1,969 2,890 1,429 492 20 2,890 1,429 492 20
7. MEDC Medco Energi Internasional Tbk. 780 825 10/03 740 10/24 790 10/31 10,531 909,968 717,147 48,010 22 3,639,640 1,858,428 48,035 22
9. PKPK Perdana Karya Perkasa Tbk. 76 82 10/31 72 10/12 79 10/31 47 49,768 3,889 16,296 22 50,247 3,928 16,298 22
8. MITI Mitra Investindo Tbk. [S] 50 53 10/02 50 10/31 50 10/31 71 5,469 275 276 16 5,567 277 281 16
10. RUIS Radiant Utama Interinsco Tbk. [S] 230 224 10/18 220 10/23 220 10/23 169 84 19 53 13 84 19 53 13
23 METAL AND MINERAL MINING 79,089 1,229,585 1,455,679 123,869 1,402,957 1,613,219 124,053
1. ANTM Aneka Tambang (Persero) Tbk. [S] 640 675 10/16 635 10/03 645 10/31 15,500 370,875 241,822 24,607 22 518,189 344,558 24,688 22
2. CITA Cita Mineral Investindo Tbk. 900 900 10/17 900 10/17 900 04/27 3,034 0.60 0.54 1 1 0.60 0.54 1 1
3. CKRA Cakra Mineral Tbk. [S] 88 98 10/10 70 10/25 86 10/31 439 4,067 367 1,291 22 4,067 367 1,291 22
10/02 197 10/31 197 10/31 5,213 122,255 25,301 10,885 22 123,005 25,463 10,888 22
4. DKFT Central Omega Resources Tbk. 442 460 10/19 426 10/03 436 10/31 2,458 13,921 6,092 973 22 18,466 8,101 975 22
5. INCO Vale Indonesia Tbk. [S] 2,590 3,080 10/13 2,600 10/02 2,940 10/31 29,213 270,735 781,339 42,780 22 287,855 830,742 42,827 22
23. SMRU SMR Utama Tbk. [S] 498 498 10/31 450 10/10 498 10/31 6,225 4,355 2,082 587 22 201,889 94,708 621 22
8. TINS Timah (Persero) Tbk. [S] 815 880 10/10 800 10/23 820 10/31 6,107 385,029 321,691 34,368 22 387,421 323,672 34,390 22419.015
4.221
6. MDKA Merdeka Copper Gold Tbk. 2,350 2,350 10/31 2,230 10/04 2,350 10/31 8,389 674 1,571 107 16 1,002 2,324 108 17
7. PSAB J Resources Asia Pasifik Tbk. [S] 218 220
21 2,457 192 1663.200
3.3.3.3. 514,809 7,112,915 8,437,258 601,061 9,924,172 9,967,460 601,579
31 CEMENT 197,865 5,000,693 3,874,918 247,444 5,383,805 4,791,596 247,685
1. INTP Indocement Tunggal Prakarsa Tbk. [S] 18,900 23,500 10/31 18,900 10/03 22,450 10/31 82,644 36,040 717,176 40,718 22 46,483 921,088 40,779 22
2. SMBR Semen Baturaja (Persero) Tbk. [S] 3,400 3,330 10/02 2,700 10/23 2,790 10/31 27,676 121,780 347,828 12,330 22 166,134 487,109 12,361 22
BASIC INDUSTRY AND CHEMICALSBASIC INDUSTRY AND CHEMICALSBASIC INDUSTRY AND CHEMICALSBASIC INDUSTRY AND CHEMICALS
45.192
158.571
1,249.123
281.538
79.207
1,995.652
1,060.000
322.852
72.000
99.737
113.956
12.251
60.000
77.000
8.254
293.443
1,252.259
19.750
88.000
425.265
3,265.839
38.282
1,119.959
1,200.000
117.500
639.133
121.785
898.000
498.214
INDONESIASTOCKEXCHANGEIDXMONTHLYSTATISTICS,OCTOBER201722
ResearchandDevelopmentDivision](https://image.slidesharecdn.com/10idxmonthlystatisticsoktober2017-201219125924/85/10-idx-monthly-statistics-oktober-2017-25-320.jpg)
![Table Trading by Industry
Regular Market
Board
Date
Price
Date
Freq.,
xPrev. High Low Close Date
Industry Classification / Stock Name Volume,
th. share
Value,
m. IDR
Days
Days
Freq.,
x
Volume,
th. share
Value,
m. IDR
Market
Cap.,
b. IDR
Index
Total Market
2
1
2
1
1
1
1
2
2
2
2
2
2
2
2
1
2
2
1
2
2
1
1
2
1
2
2
1
1
2
1
2
1
1
2 18,046 21 125,374 43,528 18,053 21
- 63 06/22 61 - - -
3. SMCB Holcim Indonesia Tbk. [S] 825 850 10/31 795 10/17 825 10/31 6,322 32,034 25,743 2,792 22 36,846 29,654 2,796 22
4. SMGR Semen Indonesia (Persero) Tbk. [S] 10,125 11,100 10/26 10,000 10/04 10,900 10/31 64,654 79,058 841,509 50,449 22 116,820 1,260,583 50,556 22
996.377
3,792.887
6. WTON Wijaya Karya Beton Tbk. [S] 535 680 10/30 535 10/06 655 10/31 5,709 526,185 326,668 27,479 22 687,740 423,173 27,494 22
5. WSBP Waskita Beton Precast Tbk. [S] 360 426 10/30 336 10/11 412 10/31 10,861 4,205,595 1,615,995 113,676 22 4,329,782 1,669,988 113,699 22
32 CERAMICS, GLASS, PORCELAIN 13,271 153,152 154,117 21,154 172,267 162,756 21,168
1. AMFG Asahimas Flat Glass Tbk. [S] 6,500 6,850 10/27 6,325 10/11 6,700 10/31 2,908 32 207 63 13 32 207 63 13
2. ARNA Arwana Citramulia Tbk. [S] 420 428 10/06 372 10/27 384 10/31 2,819 7,085 2,832 1,974 22 23,173 9,306 1,983 22
3. IKAI Intikeramik Alamasri Industri Tbk. 73 - - - - 73 03/22 58 - - - - 295 16 1 1
4. KIAS Keramika Indonesia Assosiasi Tbk. [S] 100 - - - - 100 07/28 1,493 - - - - - - - -3.636
6. MLIA Mulia Industrindo Tbk. 610 670 10/18 515 10/02 630 10/30 833 271 157 148 20 271 157 148 20
5. MARK Mark Dynamics Indonesia Tbk. [S] 775 1,240 10/25 775 10/02 1,195 10/31 478.000 908 145,264 150,713 18,710 22 147,396 152,751 18,713 22
105.219
7. TOTO Surya Toto Indonesia Tbk. [S] 412 424 10/11 410 10/31 412 10/31 4,252 501 207 259 21 1,100 319 260 21
33 METAL AND ALLIED PRODUCTS 24,900 243,460 98,618 50,611 264,569 156,466 50,631
1. ALKA Alakasa Industrindo Tbk. [S] 380 418 10/05 260 10/20 324 10/31 164 624 210 465 22 626 210 466 22
1,336.491
54.545
2. ALMI Alumindo Light Metal Industry Tbk. [S] 220 260 10/02 226 10/31 230 10/31 142 7,921 1,895 1,010 22 7,921 1,895 1,010 22
3. BAJA Saranacentral Bajatama Tbk. 188 204 10/04 183 10/02 188 10/31 338 7,417 1,426 1,403 22 7,417 1,426 1,403 22
35.385
75.200
4. BTON Betonjaya Manunggal Tbk. [S] 116 138 10/31 111 10/23 119 10/31 86 3,687 451 701 22 3,687 451 701 22
5. CTBN Citra Tubindo Tbk. [S] 4,850 - - - - 4,850 09/26 3,882 - - - - - - - -4,053.489
397.422
6. GDST Gunawan Dianjaya Steel Tbk. [S] 93 94 10/24 85 10/13 87 10/31 713 20,907 1,866 1,842 22 20,907 1,866 1,842 22
7. INAI Indal Aluminium Industry Tbk. [S] 700 800 10/13 370 10/31 394 10/31 250 2,262 1,466 516 22 2,262 1,466 516 22
54.375
143.848
8. ISSP Steel Pipe Industry of Indonesia Tbk. 185 190 10/10 165 10/31 166 10/31 1,193 5,544 973 1,018 22 5,544 973 1,018 22
9. JKSW Jakarta Kyoei Steel Works Tbk. [S] 97 - - - - 97 07/18 15 - - - - 3 0.15 1 1
56.271
14.923
10. JPRS Jaya Pari Steel Tbk. [S] 138 154 10/24 128 10/03 134 10/31 101 35,410 5,182 18,594 20 35,410 5,182 18,594 20
11. KRAS Krakatau Steel (Persero) Tbk. [S] 515 535 10/04 492 10/31 492 10/31 9,518 145,594 73,604 9,796 22 146,080 73,861 9,807 22
85.897
61.166
12. LION Lion Metal Works Tbk. [S] 805 1,050 10/17 780 10/31 780 10/31 406 116 94 221 20 116 94 221 20
13. LMSH Lionmesh Prima Tbk. [S] 640 825 10/12 585 10/24 630 10/31 60 6,522 4,950 6,791 22 6,523 4,951 6,792 22
488.511
87.500
10,774 6,160 2220.529
129.787
14. NIKL Pelat Timah Nusantara Tbk. [S] 3,570 3,560 10/02 2,990 10/24 3,000 10/31 7,570 1,584 5,002 2,852 22 22,198 62,591 2,857 22
15. PICO Pelangi Indah Canindo Tbk. [S] 212 232 10/26 210 10/10 222 10/31 126 5,604 1,241 5,025 20 5,604 1,241 5,025 20
923.077
34.154
4. DPNS Duta Pertiwi Nusantara Tbk. [S] 398 442 10/11 320 10/12 386 10/31 128 71 27 45 13 99 36 46 13
5. EKAD Ekadharma International Tbk. [S] 635 685 10/31 620 10/03 670 10/31 468 4,361 2,841 939 22 4,411 2,866 941 22
- - - - -
7. INCI Intanwijaya Internasional Tbk. [S] 400 412 10/19 390 10/25 408 10/30 74 453 182 109 16 453 182 110 16
6. ETWA Eterindo Wahanatama Tbk. 63 - - -
8. MDKI Emdeki Utama Tbk. [S] 428 472 10/31 240 10/25 390 10/31 65.000 705 120,055 42,095
2. AGII Aneka Gas Industri Tbk. [S] 655 660 10/02 550 10/23 585 10/31 1,794 16,892 9,879 3,590 22 16,892 9,879 3,590 22
158.194
125.414
1,700.853
5.188
40.569
3. BRPT Barito Pacific Tbk. [S] 1,995 2,080 10/02 1,820 10/11 2,020 10/31 28,199 788,545 1,545,852 70,879 22 813,387 1,595,127 70,907 22
16. TBMS Tembaga Mulia Semanan Tbk. [S] 1,195 1,195 10/02 890 10/30 915 10/31 336 271 258 377 21 273 259 378 21
34 CHEMICALS 135,375 1,024,806 2,651,521 119,209 3,198,657 2,993,482 119,271
1. ADMG Polychem Indonesia Tbk. [S] 169 248 10/31 169 10/02 230 10/31 895 51,716 10,774 6,160 22 51,716
84.082
111.017
273.469
2,609.937
9.733
53.182
ResearchandDevelopmentDivision
23INDONESIASTOCKEXCHANGEIDXMONTHLYSTATISTICS,OCTOBER2017](https://image.slidesharecdn.com/10idxmonthlystatisticsoktober2017-201219125924/85/10-idx-monthly-statistics-oktober-2017-26-320.jpg)
![Table Trading by Industry
Regular Market
Board
Date
Price
Date
Freq.,
xPrev. High Low Close Date
Industry Classification / Stock Name Volume,
th. share
Value,
m. IDR
Days
Days
Freq.,
x
Volume,
th. share
Value,
m. IDR
Market
Cap.,
b. IDR
Index
Total Market
2
2
1
2
1
2
2
1
2
1
2
1
2
1
1
1
2
2
1
1
2
1
1
1
2
2
2
1
1
2
2
4.4.4.4. 399,454 15,659,972 9,926,246
22
190 206 10/31 190 10/12 206 10/31 167.480 296 81 16 19 6 204 37 20 6
616,339 16,607,485 11,180,633 616,772
2. 2,024CPRO Central Proteina Prima Tbk. 10/31 10/31 6,313 316 4,529 21 36,807 1,639 4,58550 50 50 50 10/31
9. SRSN Indo Acidatama Tbk. [S] 50 50 10/31 50 10/31 50 10/31 301 640 32 12 9 2,118,292 74,150 18 9
10. TPIA Chandra Asri Petrochemical Tbk. [S] 23,825 28,400 10/31 23,200 10/12 28,400 10/31 101,294 42,056 1,039,770 19,331 22 68,014 1,256,870 19,347 22
11. UNIC Unggul Indah Cahaya Tbk. [S] 3,750 4,200 10/11 3,760 10/19 3,800 10/31 1,457 18 69 98 17 19 71 99 17
35 PLASTICS & PACKAGING 11,513 74,054 19,910 9,364 211,162 113,252 9,382
1. AKPI Argha Karya Prima Industry Tbk. [S] 915 870 10/30 700 10/06 850 10/31 578 12 9 28 11 73,188 61,458 33 12
2. APLI Asiaplast Industries Tbk. [S] 91 92 10/05 55 10/24 87 10/31 131 4,309 356 917 22 4,309 356 917 22
3. BRNA Berlina Tbk. [S] 1,200 1,200 10/12 1,090 10/09 1,175 10/31 1,150 63 74 28 14 93 107 30 15
4. FPNI Lotte Chemical Titan Tbk. [S] 248 266 10/02 224 10/31 224 10/31 1,247 54,571 13,299 6,421 22 54,621 13,311 6,422 22
5. IGAR Champion Pacific Indonesia Tbk. [S] 394 406 10/10 378 10/09 390 10/31 379 870 336 341 21 870 336 341 21
6. IMPC Impack Pratama Industri Tbk. [S] 1,000 1,000 10/02 970 10/12 995 10/31 4,809 4,089 4,036 844 22 19,179 17,483 847 22
7. IPOL Indopoly Swakarsa Industry Tbk. [S] 169 170 10/11 150 10/27 155 10/31 999 9,618 1,596 672 22 9,627 1,597 673 22
21 72 15 54 21 72 15
9. TRST Trias Sentosa Tbk. [S] 400 416 10/18 390 10/27 390 10/27 1,095 466 182 38 13 49,206 18,571 41 14232.641
10. YPAS Yanaprima Hastapersada Tbk. [S] 995 975 10/06 950 10/06 970 10/17 648 1 1 3 2 15 11 6 5
36 ANIMAL FEED 74,868 352,122 763,949 79,837 410,343 817,930 79,939
1. CPIN Charoen Pokphand Indonesia Tbk. [S] 2,740 3,550 10/26 2,740 10/03 3,300 10/31 54,113 172,207 531,037 45,175 22 182,545 562,300 45,210 22
8. TALF Tunas Alfin Tbk. 410 430 10/26 300 10/24 352 10/30 476 54
3. JPFA Japfa Comfeed Indonesia Tbk. [S] 1,270 1,450 10/30 1,225 10/06 1,375 10/31 15,689 168,845 228,407 28,367 22 186,234 249,802 28,377 22
4. MAIN Malindo Feedmill Tbk. [S] 905 915 10/27 850 10/17 880 10/31 1,970 4,509 3,991 1,602 22 4,509 3,991 1,602 22
5. SIPD Sierad Produce Tbk. [S] 810 860 10/16 750 10/25 800 10/31 1,071 247 198 164 17 247 198 165 17
37 WOOD INDUSTRIES 849 19,068 3,119 2,231 20,068 3,299 2,232
1. SULI SLJ Global Tbk. 190 200 10/05 170 10/31 186 10/31 742 14,136 2,605 1,547 22 15,136 2,785 1,548 22
2. TIRT Tirta Mahakam Resources Tbk. 106 107 10/20 102 10/30 106 10/31 107 4,933 514 684 22 4,933 514 684 22
38 PULP & PAPER 52,953 233,364 866,407 66,157 250,984 923,960 66,216
1. ALDO Alkindo Naratama Tbk [S] 600 - - - - 600 08/09 330 - - - - 3 1 1 1
2. DAJK Dwi Aneka Jaya Kemasindo Tbk. 50 50 10/31 50 10/31 50 10/31 125 402 20 69 21 706 32 76 21
3. FASW Fajar Surya Wisesa Tbk. 5,225 5,350 10/02 4,550 10/20 5,250 10/31 13,009 6,492 32,068 3,371 22 6,492 32,068 3,371 221,203.135
8 1,311 39 17 11
7. KDSI Kedawung Setia Industrial Tbk. [S] 456 580 10/31 456 10/02 530 10/31 215 1,259 635 197 18 1,259 635 197 18
9.615
132.500
4. INKP Indah Kiat Pulp & Paper Tbk. 4,190 5,275 10/31 4,110 10/10 5,275 10/31 28,859 115,067 525,225 39,871 22 124,446 563,713 39,899 22
5. INRU Toba Pulp Lestari Tbk. [S] 300 330 10/13 290 10/09 308 10/31 428 572 174 184 19 572 174 184 19
41 MACHINERY AND HEAVY EQUIPMENT 13,618 319,809 121,979 22,641 436,558 167,416 22,671
MISCELLANEOUS INDUSTRYMISCELLANEOUS INDUSTRYMISCELLANEOUS INDUSTRYMISCELLANEOUS INDUSTRY
8. SPMA Suparma Tbk. [S] 220 258 10/13 212 10/02 248 10/31 524 3,534 841 483 22 3,534 841 483 22
9. TKIM Pabrik Kertas Tjiwi Kimia Tbk. 2,440 3,310 10/19 2,360 10/10 2,900 10/31 9,028 106,028 307,445 21,972 22 112,663 326,459 21,988 22
2. KMTR
1. INCF Indo Komoditi Korpora Tbk.
5,035 22
39 3,216 12,195 4,699 5,054 12,317 4,720
9.107
1,314.685
140.737
112.124
72.500
881.603
67.945
254.902
261.842
73.810
5,055OTHERS
6. KBRI Kertas Basuki Rachmat Indonesia Tbk. 50 50 10/30 50 10/30 50 10/30 434 11 0.56 10
Kirana Megatara Tbk. 432 442 10/04 364 10/16 380 10/31 2,920 12,113 4,683 5,035 22 12,113 4,683
45.455
10.638
111.171
179.302
82.969
89.114
177.982
15,029.376
375.888
500.000
0.889
2.657
48.457
266.667
271.813
3.127
ResearchandDevelopmentDivision
INDONESIASTOCKEXCHANGEIDXMONTHLYSTATISTICS,OCTOBER201724](https://image.slidesharecdn.com/10idxmonthlystatisticsoktober2017-201219125924/85/10-idx-monthly-statistics-oktober-2017-27-320.jpg)
![Table Trading by Industry
Regular Market
Board
Date
Price
Date
Freq.,
xPrev. High Low Close Date
Industry Classification / Stock Name Volume,
th. share
Value,
m. IDR
Days
Days
Freq.,
x
Volume,
th. share
Value,
m. IDR
Market
Cap.,
b. IDR
Index
Total Market
2
2
2
1
1
2
1
1
1
1
2
2
1
2
1
1
2
2
2
2
2
1
1
1
1
2
2
1
1
2
1
2
2
2
1
2. GMFI Garuda Maintenance Facility Aero Asia Tbk. [S] 400 410 10/10 336 10/12 372 10/10 93.000 10,503 313,577 116,268 20,413 16 430,326 161,705 20,443 16
10/03 175 10/03 116.667 254 391,866 68,844 14,734 21 451,066 78,563 14,763 212. BELL Trisula Textile Industries Tbk. [S] 150 234 10/03 159
1. AMIN Ateliers Mecaniques D'Indonesie Tbk. [S] 308 438 10/31 306 10/05 438 10/31 473 4,774 1,725 443 22 4,774 1,725 443 22
3. KRAH Grand Kartech Tbk. 2,720 2,760 10/19 2,680 10/12 2,720 10/31 2,642 1,458 3,986 1,785 22 1,458 3,986 1,785 22
42 AUTOMOTIVE AND COMPONENTS 358,284 866,498 4,276,564 140,798 1,120,309 5,366,447 141,059
1. ASII Astra International Tbk. [S] 7,900 8,525 10/16 7,800 10/03 8,000 10/31 323,868 495,662 4,010,691 78,278 22 622,576 5,029,083 78,494 225,720.947
2. AUTO Astra Otoparts Tbk. [S] 2,400 2,500 10/05 2,330 10/31 2,340 10/31 11,278 2,097 5,046 413 22 6,097 14,766 416 22
3. BOLT Garuda Metalindo Tbk. [S] 1,055 1,120 10/31 1,035 10/11 1,115 10/31 2,613 23,489 25,396 8,381 22 28,800 30,710 8,383 22
2,116.306
202.727
4. BRAM Indo Kordsa Tbk. [S] 5,925 8,350 10/24 4,050 10/11 6,800 10/31 3,060 22 156 110 17 22 157 111 17
5. GDYR Goodyear Indonesia Tbk. [S] 2,000 2,100 10/12 2,040 10/03 2,100 10/12 861 0.20 0.41 2 2 0.20 0.41 2 2
264.648
1,680.000
6. GJTL Gajah Tunggal Tbk. [S] 685 735 10/26 680 10/03 695 10/31 2,422 255,488 180,574 39,095 22 255,488 180,575 39,096 22
7. IMAS Indomobil Sukses Internasional Tbk. 860 1,065 10/23 825 10/03 1,010 10/31 2,793 2,947 2,630 565 22 3,047 2,715 566 22
136.446
135.593
8. INDS Indospring Tbk. [S] 1,000 1,485 10/31 1,000 10/02 1,445 10/31 948 11,595 14,679 4,870 22 11,605 14,693 4,872 22
9. LPIN Multi Prima Sejahtera Tbk. 1,260 1,510 10/25 1,260 10/02 1,270 10/31 135 96 128 34 12 96 128 34 12
135.469
145.077
10. MASA Multistrada Arah Sarana Tbk. [S] 210 286 10/06 204 10/03 216 10/31 1,984 51,188 12,632 4,221 22 59,216 14,266 4,229 22
11. NIPS Nipress Tbk. 396 476 10/13 370 10/04 444 10/31 726 1,255 529 380 20 110,699 55,251 406 20
153.584
323.135
12. PRAS Prima Alloy Steel Universal Tbk. [S] 248 264 10/23 222 10/10 238 10/31 167 2,980 702 382 22 2,984 702 383 22
13. SMSM Selamat Sempurna Tbk. [S] 1,115 1,300 10/31 1,110 10/05 1,290 10/31 7,429 19,678 23,400 4,067 22 19,678 23,400 4,067 22
133.986
3,445.605
43 TEXTILE, GARMENT 19,885 13,970,935 5,316,418 406,673 14,546,152 5,434,436 406,807
1. ARGO Argo Pantes Tbk. 825 825 10/30 825 10/30 825 07/25 277 8 6 2 2 1,008 1,006 3 3
3. CNTB Century Textile Industry (Seri B) Tbk. 250 - - - - 250 12/22/00 33 - - - - - - - -
4. CNTX Century Textile Industry (PS) Tbk. 560 560 10/17 498 10/23 540 10/27 38 34 18 52 13 34 18 52 13
5. ERTX Eratex Djaja Tbk. 145 177 10/18 135 10/09 139 10/31 179 54,505 8,786 29,568 22 54,505 8,786 29,568 22
6. ESTI Ever Shine Textile Industry Tbk. 93 110 10/20 85 10/03 92 10/31 185 166 16 243 22 166 16 243 22
7. HDTX Panasia Indo Resources Tbk. 328 500 10/30 312 10/23 490 10/30 1,765 530 178 79 13 531 179 80 13
8. INDR Indo-Rama Synthetics Tbk. [S] 1,040 1,400 10/18 1,040 10/02 1,310 10/31 857 2,840 3,791 182 19 2,842 3,793 183 20
9. MYTX Asia Pacific Investama Tbk. 131 175 10/03 102 10/16 142 10/31 208 2,089 317 534 21 4,186 531 538 21
10. PBRX Pan Brothers Tbk. [S] 515 535 10/25 480 10/30 486 10/31 3,148 455,043 224,826 144,923 22 471,447 232,711 144,927 22
11. POLY Asia Pacific Fibers Tbk. 67 73 10/31 61 10/30 69 10/31 172 46,718 3,135 3,784 22 46,718 3,135 3,784 22
12. RICY Ricky Putra Globalindo Tbk. [S] 152 155 10/30 146 10/18 151 10/31 97 326 49 183 17 326 49 183 17
0.593
23.982
13. SRIL Sri Rejeki Isman Tbk. 348 414 10/18 344 10/04 364 10/31 6,768 12,859,013 4,974,267 204,869 22 13,047,622 5,043,211 204,944 22
14. SSTM Sunson Textile Manufacturer Tbk. [S] 400 390 10/03 356 10/31 356 10/31 417 31 12 9 6 31 12 9 6
151.667
83.765
15. STAR Star Petrochem Tbk. [S] 69 73 10/24 67 10/31 68 10/31 326 66,487 4,627 5,133 22 335,087 23,361 5,149 22
16. TFCO Tifico Fiber Indonesia Tbk. [S] 1,000 1,040 10/18 940 10/11 1,000 10/26 4,823 4 3 15 10 4 3 15 10
66.667
226.613
17. TRIS Trisula International Tbk. [S] 306 314 10/30 292 10/30 308 10/31 323 90,760 27,439 2,008 22 130,065 38,961 2,011 22
18. UNIT Nusantara Inti Corpora Tbk. [S] 208 252 10/02 165 10/16 208 10/31 16 516 102 355 20 516 102 355 20
102.667
5.163
44 FOOTWEAR 966 2,654 523 785 3,654 873 786
1. BATA Sepatu Bata Tbk. [S] 820 815 10/09 680 10/31 705 10/31 917 439 326 168 19 1,439 676 169 199,143.969
342.188
989.091
20.729
-
981.818
58.995
36.946
77.271
176.433
18.952
860.177
ResearchandDevelopmentDivision
INDONESIASTOCKEXCHANGEIDXMONTHLYSTATISTICS,OCTOBER201725](https://image.slidesharecdn.com/10idxmonthlystatisticsoktober2017-201219125924/85/10-idx-monthly-statistics-oktober-2017-28-320.jpg)
![Table Trading by Industry
Regular Market
Board
Date
Price
Date
Freq.,
xPrev. High Low Close Date
Industry Classification / Stock Name Volume,
th. share
Value,
m. IDR
Days
Days
Freq.,
x
Volume,
th. share
Value,
m. IDR
Market
Cap.,
b. IDR
Index
Total Market
2
2
2
1
2
1
1
1
1
1
2
1
1
2
1
1
1
2
1
2
1
2
1
2
2
2
1
1
1
1
1
1
8. HOKI Buyung Poetra Sembada Tbk. [S] 330 344 10/05 298
10.
11. INDF Indofood Sukses Makmur Tbk. [S] 8,425 8,675 10/04 8,150 10/30 8,200
22
6,922 22IIKP Inti Agri Resources Tbk. [S] 10/02 10/31 8,065,962 1,733,552 9,581 22 12,731,822 2,800,517 9,641234 202 206 10/31
160 177 158 170 10/31 7,867 1,197,079 200,558 63,465 22 1,895,150 302,502 63,588
238
BTEK Bumi Teknokultura Unggul Tbk. [S] 10/11 10/20
10/19
2. BIMA Primarindo Asia Infrastructure Tbk. 90 105 10/30 80 10/31 82 10/31 50 2,216 197 617 22 2,216 197 617 2220.148
45 CABLE 6,342 480,376 206,309 40,233 481,088 207,002 40,239
1. IKBI Sumi Indo Kabel Tbk. [S] 336 390 10/16 322 10/04 344 10/31 421 556 184 263 22 556 184 263 22
2. JECC Jembo Cable Company Tbk. [S] 4,940 5,100 10/03 4,900 10/04 4,990 10/23 754 2 9 11 4 2 9 11 4
31.197
378.188
3. KBLI KMI Wire and Cable Tbk. [S] 418 484 10/19 410 10/09 440 10/31 1,763 399,472 180,121 32,978 22 400,134 180,397 32,983 22
4. KBLM Kabelindo Murni Tbk. [S] 262 300 10/23 230 10/04 270 10/31 302 4,393 1,190 1,257 22 4,393 1,190 1,257 22
53.464
9.000
5. SCCO Supreme Cable Manufacturing & Commerce Tbk. [S] 8,100 9,000 10/25 7,900 10/03 8,900 10/31 1,830 169 1,433 222 22 219 1,851 223 22
6. VOKS Voksel Electric Tbk. [S] 324 346 10/13 290 10/11 306 10/31 1,272 75,785 23,372 5,502 22 75,785 23,372 5,502 22
5,741.935
135.360
46 ELECTRONICS 358 19,699 4,453 5,209 19,724 4,459 5,210
1. PTSN Sat Nusapersada Tbk. [S] 194 268 10/06 173 10/04 202 10/31 358 19,699 4,453 5,209 22 19,724 4,459 5,210 2234.828
5.5.5.5. 1,429,769 11,832,499 11,299,954 547,029 18,723,557 15,575,108 549,056
51 FOOD AND BEVERAGES 306,637 10,393,625 4,556,707 241,887 16,917,164 7,284,218 242,823
1. AISA Tiga Pilar Sejahtera Food Tbk. [S] 930 1,060 10/10 895 10/04 975 10/31 3,138 85,633 85,029 18,033 22 86,020 85,399 18,040 22118.673
2. ALTO Tri Banyan Tirta Tbk. 300 480 10/30 300 10/02 412 10/31 903 271,201 101,072 204 19 521,526 183,466 223 19
5. CEKA Wilmar Cahaya Indonesia Tbk. [S] 1,400 1,450 10/30 1,300 10/17 1,400 10/31 833 427 582 300 22 427 582 300 22
4. BUDI Budi Starch & Sweetener Tbk. [S] 95 104 10/13 93 10/05 96 10/31 432 128,467 12,675 33,195 22 128,467 12,675 33,195 22
205.839
52.030
289.256
3.
7. DLTA Delta Djakarta Tbk. 4,750 4,680 10/02 4,350 10/30 4,530 10/31 3,627 486 2,212 225 21 1,806 8,152 227 21
9. ICBP Indofood CBP Sukses Makmur Tbk. [S] 8,725 9,000 10/31 8,625 10/12 8,800 10/31 102,625 95,845 842,287 25,899 22 113,186 995,252 25,985 22
27,078.726
326.228
316 10/31 101.935 743 210,382 67,361 15,138 22 210,578 67,423 15,143 22
12. MLBI Multi Bintang Indonesia Tbk. 14,500 15,000 10/19 14,000 10/31 14,425 10/31 30,393 434 6,243 354 22 1,354 19,309 360 22
1,403.653
91,878.981
13. MYOR Mayora Indah Tbk. [S] 1,960 2,300 10/27 1,920 10/03 2,050 10/31 45,835 36,053 75,667 10,658 22 49,987 105,071 10,685 22
10/31 71,999 153,127 1,281,032 43,883 22 174,948 1,463,871 43,969 22
14. PSDN Prasidha Aneka Niaga Tbk. [S] 195 232 10/27 185 10/10 199 10/31 287 183 38 78 19 183 38 78 19
10,255.128
19.900
15. ROTI Nippon Indosari Corpindo Tbk. [S] 1,260 1,370 10/26 1,190 10/09 1,270 10/31 7,857 63,222 79,599 9,127 22 858,087 1,092,494 9,200 22
16. SKBM Sekar Bumi Tbk. [S] 490 540 10/13 490 10/26 500 10/31 863 580 285 74 17 580 285 74 17
498.039
434.783
17. SKLT Sekar Laut Tbk. [S] 1,100 - - - - 1,100 08/21 760 - - - - - - - -
18. STTP Siantar Top Tbk. 3,720 3,810 10/31 3,730 10/05 3,810 10/31 4,991 48 179 8 4 48 179 8 4
92.093
2,251.374
19. ULTJ Ultrajaya Milk Industry & Trading Co. Tbk. [S] 1,255 1,420 10/27 1,255 10/02 1,305 10/31 15,077 24,017 31,055 2,053 22 82,515 109,721 2,495 22
52 TOBACCO MANUFACTURERS 612,776 442,570 3,789,591 123,938 542,404 4,417,959 124,269
1. GGRM Gudang Garam Tbk. 65,800 71,025 10/31 61,925 10/24 70,000 10/31 134,686 34,364 2,252,366 75,794 22 38,516 2,523,652 75,945 22
2,530.247
2,731.707
2. HMSP HM Sampoerna Tbk. 3,860 4,060 10/25 3,760 10/16 3,980 10/31 462,946 392,555 1,532,589 47,019 22 483,631 1,888,289 47,188 22
3. RMBA Bentoel Internasional Investama Tbk. 398 428 10/10 368 10/30 400 10/31 14,560 178 68 73 20 178 68 73 20
19,868.211
3,129.890
4. WIIM Wismilak Inti Makmur Tbk. 318 320 10/05 276 10/31 278 10/31 584 15,475 4,569 1,052 22 20,080 5,951 1,063 22
53 PHARMACEUTICALS 120,968 615,046 878,985 71,613 803,394 1,222,211 71,815
1. DVLA Darya-Varia Laboratoria Tbk. [S] 1,880 2,040 10/24 1,890 10/27 1,950 10/31 2,184 162 313 71 11 162 313 71 11
42.769
71.778
CONSUMER GOODS INDUSTRYCONSUMER GOODS INDUSTRYCONSUMER GOODS INDUSTRYCONSUMER GOODS INDUSTRY
395.409
1,302.482
6. CLEO Sariguna Primatirta Tbk. [S] 590 715 10/27 535 10/11 675 10/31 586.957 1,485 60,481 37,281 9,612 22 60,481 37,281 9,612 22
INDONESIASTOCKEXCHANGEIDXMONTHLYSTATISTICS,OCTOBER201726
ResearchandDevelopmentDivision](https://image.slidesharecdn.com/10idxmonthlystatisticsoktober2017-201219125924/85/10-idx-monthly-statistics-oktober-2017-29-320.jpg)
![Table Trading by Industry
Regular Market
Board
Date
Price
Date
Freq.,
xPrev. High Low Close Date
Industry Classification / Stock Name Volume,
th. share
Value,
m. IDR
Days
Days
Freq.,
x
Volume,
th. share
Value,
m. IDR
Market
Cap.,
b. IDR
Index
Total Market
1
1
1
2
2
2
1
1
2
1
2
2
1
1
1
1
2
1
2
2
2
1
2
1
2
2
1
2
2
2
1
1
2
3. LMPI Langgeng Makmur Industri Tbk. [S] 169 232 10/31 168 10/10 175 10/31 25.536 176 66,330 13,767 42,726 22 77,102 15,135 42,727 22
2. ARMY Armidian Karyatama Tbk. 312 320 10/05 234 10/23
1. HRTA Hartadinata Abadi Tbk. [S] 300 302 10/27 274 10/16 294 10/31 98.000 1,354 73,105 21,046 6,358 22 93,822 27,016 6,361 22
48,150 22
344 10/13 318 10/10 334 10/31 334 95,953 31,729 1,774 22 131,593 43,335 2,119 22
22 417,648 121,154 24,444 22
10/31 2,857 5,330 10,333 1,636 22 5,540 10,687 1,637 22
19 199 39 119 19
5. TCID Mandom Indonesia Tbk. [S] 19,250 19,250 10/23 19,250 10/23 19,250 10/23 3,871 1 21 1 1 231 4,389 3 3
6. UNVR Unilever Indonesia Tbk. [S] 48,975
2. KINO Kino Indonesia Tbk. [S] 1,680 2,050 10/09 1,670 10/03 2,000
4. MRAT Mustika Ratu Tbk. [S] 198 206 10/05 189 10/06 200 10/31 86 199 39 119
51,175 10/03 48,550 10/16 49,600
2. INAF Indofarma (Persero) Tbk. [S] 2,360 3,200 10/17 2,200 10/12 2,640 10/31 8,182 9,483 26,050 5,309 22 9,593 26,358 5,313 22
3. KAEF Kimia Farma (Persero) Tbk. [S] 2,740 2,990 10/16 2,600 10/31 2,770 10/31 15,385 29,097 81,223 8,304 22 66,939 186,557 8,348 22
1,056.000
2,770.000
4. KLBF Kalbe Farma Tbk. [S] 1,665 1,730 10/12 1,585 10/31 1,600 10/31 75,000 410,461 683,800 46,109 22 529,894 884,130 46,241 22
5. MERK Merck Tbk. [S] 8,700 8,875 10/06 8,400 10/27 8,425 10/30 3,774 36 305 77 14 36 305 77 14
15,605.189
22,213.726
6. PYFA Pyridam Farma Tbk. [S] 188 216 10/27 170 10/16 202 10/31 108 2,976 567 232 21 2,976 567 232 21
7. SCPI Merck Sharp Dohme Pharma Tbk. 29,000 - - - - 29,000 11/27/12 104 - - - - - - - -
197.962
227.451
8. SIDO Industri Jamu dan Farmasi Sido Muncul Tbk. [S] 472 520 10/26 436 10/12 492 10/31 7,380 155,853 73,824 11,074 22 170,317 80,455 11,087 22
9. SQBB Taisho Pharmaceutical Indonesia Tbk. [S] 10,500 - - - - 10,500 04/02/01 97 - - - - - - - -
84.828
-
10. SQBI Taisho Pharmaceutical Indonesia (PS) Tbk. 440,000 - - - - 440,000 01/30 428 - - - - 0.20 88 1 1
11. TSPC Tempo Scan Pacific Tbk. [S] 1,890 1,935 10/23 1,805 10/12 1,850 10/31 8,325 6,977 12,903 437 22 23,477 43,439 445 22
41,904.762
330.027
54 COSMETICS AND HOUSEHOLD 386,026 46,249 1,986,294 49,962 58,454 2,543,399 50,170
1. ADES Akasha Wira International Tbk. [S] 980 1,030 10/13 980 10/13 1,010 10/31 596 235 234 121 21 235 234 121 21
3. MBTO Martina Berto Tbk. [S] 165 168 10/10 154 10/30 158 10/31 169 663 107 135 21 1,283 222 140 21
52.468
52.632
21.351
2. KICI Kedaung Indah Can Tbk. [S] 169 192 10/18 163 10/05 170 10/31 47 3,445 599 574 22 3,445 599 574 22
10/31 378,448 39,821 1,975,559 47,950 22 50,967
55 HOUSEWARE 2,007 261,904 67,330 53,271 308,320 80,306 53,618
1. CINT Chitose Internasional Tbk. [S] 334
2,527,829
4. WOOD Integra Indocabinet Tbk [S] 224 238 10/31 208 10/16 232 10/31 1,450 96,176 21,235 8,197 22 96,180 21,236 8,198 22
59 OTHERS 1,354 73,105 21,046 6,358 93,822 27,016 6,361
6.6.6.6. 422,635 29,204,000 12,850,897 931,363 49,176,176 19,469,179 933,575
61 PROPERTY AND REAL ESTATE 308,069 25,102,068 6,827,598 588,312 44,533,932 12,775,439 589,794
1. APLN Agung Podomoro Land Tbk. [S] 280 300 10/04 248 10/24 262 10/31 5,371 1,008,912 278,913 37,132 22 1,139,040 319,293 37,141 22
3. ASRI Alam Sutera Realty Tbk. [S] 378 414 10/31 372 10/18 406 10/31 7,978 843,484 330,719 33,063 22 866,360 339,528 33,094 22
24,428244 10/31 81.333 1,998 313,322 89,682
4. BAPA Bekasi Asri Pemula Tbk. [S] 100 112 10/04 90 10/30 99 10/31 66 706,231 70,991 2,447 22 1,398,531 141,194 2,464 22
5. BCIP Bumi Citra Permai Tbk. [S] 93 141 10/05 68 10/02 130 10/31 186 712,172 82,304 35,565 22 744,367 86,128 35,570 22
6. BEST Bekasi Fajar Industrial Estate Tbk. [S] 272 302 10/06 272 10/20 284 10/31 2,740 301,443 86,401 16,023 22 301,443 86,401 16,023 22
7. BIKA Binakarya Jaya Abadi Tbk. 330 364 10/27 300 10/09 320 10/31 190 298 95 151 18 298 95 151 18
8. BIPP Bhuwanatala Indah Permai Tbk. [S] 88 91 10/09 77 10/20 85 10/31 397 9,848 794 1,365 22 9,974 804 1,366 22
9. BKDP Bukit Darmo Property Tbk. [S] 90 91 10/12 78 10/11 84 10/30 614 231 20 102 13 231 20 102 13
10. BKSL Sentul City Tbk. [S] 149 157 10/04 125 10/26 143 10/31 7,902 3,420,404 480,784 58,856 22 4,162,656 584,080 58,873 22
11. BSDE Bumi Serpong Damai Tbk. [S] 1,770 1,830 10/06 1,705 10/31 1,720 10/31 33,104 307,459 543,494 38,022 22 395,445 676,804 38,083 22
12. COWL Cowell Development Tbk. 1,175 1,225 10/06 1,125 10/26 1,160 10/31 5,651 31,429 36,542 7,313 22 31,429 36,542 7,313 22
PROPERTY, REAL ESTATE AND BUILDING CONSTRUCTIONPROPERTY, REAL ESTATE AND BUILDING CONSTRUCTIONPROPERTY, REAL ESTATE AND BUILDING CONSTRUCTIONPROPERTY, REAL ESTATE AND BUILDING CONSTRUCTION
30.769
1,888.143
253,968.254
101.212
36.092
89.231
71.781
386.667
66.000
118.182
167.059
32.000
35.446
70.000
9.881
336.921
892.308
ResearchandDevelopmentDivision
INDONESIASTOCKEXCHANGEIDXMONTHLYSTATISTICS,OCTOBER201727](https://image.slidesharecdn.com/10idxmonthlystatisticsoktober2017-201219125924/85/10-idx-monthly-statistics-oktober-2017-30-320.jpg)
![Table Trading by Industry
Regular Market
Board
Date
Price
Date
Freq.,
xPrev. High Low Close Date
Industry Classification / Stock Name Volume,
th. share
Value,
m. IDR
Days
Days
Freq.,
x
Volume,
th. share
Value,
m. IDR
Market
Cap.,
b. IDR
Index
Total Market
1
1
1
2
2
1
2
2
1
2
2
1
2
1
2
2
2
1
1
1
2
2
1
2
2
2
2
2
1
2
1
1
1
2
2
2
1
1
9,887 2259.096
25. GWSA Greenwood Sejahtera Tbk. [S]
586 687,955 100,880 9,885 22 688,005 100,887
10/31 50 10/31 501 328 16 218 19 1,573,772 78,951 235 19
23.
125 131 10/11 116 10/24 123 10/31 959 2,769 336 353 20 2,769 336 353 20
24. GPRA Perdana Gapuraprima Tbk. [S] 140 160 10/24 132 10/16 137 10/31
13. CTRA Ciputra Development Tbk. [S] 1,195 1,245 10/27 1,150 10/09 1,210 10/31 22,458 351,353 419,394 26,588 22 647,879 773,286 26,736 22
14. DART Duta Anggada Realty Tbk. [S] 316 360 10/18 300 10/02 316 10/30 993 861 268 361 20 862 268 362 20
15. DILD Intiland Development Tbk. [S] 412 418 10/04 386 10/31 388 10/31 4,022 151,781 61,105 11,527 22 230,863 93,977 11,536 22
16. DMAS Puradelta Lestari Tbk. [S] 200 202 10/20 183 10/13 188 10/31 9,061 629,995 120,958 16,434 22 747,861 144,195 16,448 22
17. DUTI Duta Pertiwi Tbk. [S] 5,450 5,400 10/24 5,200 10/24 5,400 10/24 9,990 52 275 15 2 52 275 15 2
18. ELTY Bakrieland Development Tbk. 50 50 10/31 50 10/31 50 10/31 2,176 3,724 186 173 21 3,309,375 137,251 303 22
19. EMDE Megapolitan Developments Tbk. [S] 314 326 10/03 302 10/31 302 10/31 1,012 12,716 3,992 1,036 22 72,254 21,921 1,053 22
20. FMII Fortune Mate Indonesia Tbk. [S] 555 565 10/05 454 10/23 540 10/31 1,469 1,737 935 63 12 1,737 935 63 12
GMTD Gowa Makassar Tourism Development Tbk. [S] 9,700 10,000 10/20 9,875 10/03 9,975 10/30 1,013 11 113 24 12 11 113 24 12
21. FORZ Forza Land Indonesia Tbk. [S] 760 850 10/03 640 10/09 770 10/31 350.000 1,203 208,323 155,805 3,694 22 369,208 249,854 3,715 22
22. GAMA Gading Development Tbk. [S] 50 50 10/31 50
26. JRPT Jaya Real Property Tbk. [S] 895 920 10/24 825 10/11 905 10/31 12,444 65,359 58,018 5,109 22 222,649 199,664 5,123 22
49.200
870.192
27. KIJA Kawasan Industri Jababeka Tbk. [S] 306 312 10/19 298 10/30 304 10/31 6,331 87,120 26,714 3,801 22 600,673 181,098 3,853 22
28. LAMI Lamicitra Nusantara Tbk. [S] 368 - - - - 368 09/29/16 423 - - - - 80,214 65,294 1 1
10.547
294.400
29. LCGP Eureka Prima Jakarta Tbk. 105 118 10/20 93 10/18 99 08/31 557 128,727 13,568 6,200 10 216,213 24,465 6,213 10
30. LPCK Lippo Cikarang Tbk. [S] 4,180 4,300 10/02 3,760 10/23 3,800 10/31 2,645 21,063 82,491 11,785 22 21,709 85,053 11,792 22
79.200
410.811
31. LPKR Lippo Karawaci Tbk. [S] 725 745 10/10 675 10/31 690 10/31 15,924 1,357,148 978,265 49,436 22 1,866,071 1,354,164 49,502 22
32. MDLN Modernland Realty Tbk. [S] 292 344 10/12 294 10/02 330 10/31 4,136 247,690 80,810 11,239 22 2,270,031 870,796 11,262 22
176.668
97.936
33. MKPI Metropolitan Kentjana Tbk. [S] 33,650 35,575 10/31 32,000 10/11 35,525 10/31 33,685 2,296 76,919 1,124 22 9,695 134,056 1,129 22
34. MMLP Mega Manunggal Property Tbk. [S] 585 585 10/31 555 10/23 585 10/31 3,343 1,940 1,107 132 13 69,449 35,127 139 15
1,691.667
100.000
35. MTLA Metropolitan Land Tbk. [S] 344 356 10/31 330 10/03 356 10/31 2,725 48,929 17,387 435 22 109,139 41,471 539 22
36. MTSM Metro Realty Tbk. [S] 272 288 10/10 254 10/10 268 10/26 62 12 3 21 9 12 3 21 9
149.674
68.674
39. NIRO Nirvana Development Tbk. 66 73 10/06 57 10/31 59 10/31 1,310 52,651 3,156 2,268 22 69,651 4,173 2,270 22
40. OMRE Indonesia Prima Property Tbk. [S] 380 - - - - 380 05/22 663 - - - - - - - -
41. PLIN Plaza Indonesia Realty Tbk. [S] 4,850 4,900 10/25 3,790 10/02 3,950 10/31 14,023 122 525 159 15 187,782 593,053 165 15
42. PPRO PP Properti Tbk. [S] 206 224 10/25 197 10/12 210 10/31 12,952 1,109,249 233,787 45,090 22 2,641,428 561,949 45,254 22
43. PWON Pakuwon Jati Tbk. [S] 610 660 10/26 580 10/12 630 10/31 30,341 719,437 446,938 45,213 22 777,613 482,940 45,298 22
44. RBMS Ristia Bintang Mahkotasejati Tbk. [S] 97 104 10/13 90 10/11 94 10/31 31 229 21 106 17 229 21 106 17
45. RDTX Roda Vivatex Tbk. 6,900 6,950 10/31 6,400 10/31 6,950 10/31 1,868 141 910 52 13 141 910 52 13
46. RODA Pikko Land Development Tbk. [S] 134 164 10/04 118 10/12 134 10/31 1,821 855 115 521 22 761,108 98,965 532 22
47. SCBD Danayasa Arthatama Tbk. [S] 2,700 - - - - 2,700 07/05 8,970 - - - - - - - -
48. SMDM Suryamas Dutamakmur Tbk. [S] 104 114 10/02 91 10/24 105 10/31 501 11,598 1,221 281 21 11,598 1,221 281 21
49. SMRA Summarecon Agung Tbk. [S] 1,065 1,190 10/04 995 10/18 1,035 10/31 14,932 376,355 402,365 42,457 22 1,363,050 1,805,219 42,512 22
50. TARA Sitara Propertindo Tbk. [S] 735 735 10/31 710 10/23 735 10/31 7,401 297,868 215,264 19,199 22 585,842 399,361 19,237 22
37. MYRX Hanson International Tbk. [S] 125 129 10/16 113 10/31 118 10/31 9,289 10,866,433 1,323,011 18,824 22 15,557,548 1,842,144 19,136 22
38. MYRXP Hanson International (Seri B) Tbk. 50 50 10/30 50 10/30 50 10/30 56 9 0.47 22 10 19 0.73 23 11
270.912
58.417
67.612
89.524
543.096
10.308
120.800
540.000
47.619
1,734.783
80.474
40.000
56.190
18.197
1,639.072
454.054
2,428.775
18.800
366.138
213.955
540.000
13.303
1,700.624
693.396
ResearchandDevelopmentDivision
INDONESIASTOCKEXCHANGEIDXMONTHLYSTATISTICS,OCTOBER201728](https://image.slidesharecdn.com/10idxmonthlystatisticsoktober2017-201219125924/85/10-idx-monthly-statistics-oktober-2017-31-320.jpg)
![Table Trading by Industry
Regular Market
Board
Date
Price
Date
Freq.,
xPrev. High Low Close Date
Industry Classification / Stock Name Volume,
th. share
Value,
m. IDR
Days
Days
Freq.,
x
Volume,
th. share
Value,
m. IDR
Market
Cap.,
b. IDR
Index
Total Market
1
1
1
1
1
1
2
1
1
1
1
1
1
1
1
1
2
2
1
2
2
2
2
1
1
2
2
1
1
1
2
1
1
3,583 324
4,642,243 6,693,740 343,781
22
239
16,271 2,503 22 20,756 22,806 2,510 22
91
1,857,728 76,052 3,981,731 2,294,210 76,260
36,807 22
5. POWR Cikarang Listrindo Tbk. [S] 1,125 1,150 10/04 1,075 10/23 1,095 10/31 17,615 14,825
7. TGRA Terregra Asia Energy Tbk. [S] 550 550 10/02 486 10/31 486 10/31 1,337 12,491 6,274 1,838 22 12,491 6,274 1,838 22
6. RAJA Rukun Raharja Tbk. [S] 300 390 10/24 290 10/02 356 10/31 1,222.863 1,451 124,762 43,932 7,780 22 127,017 44,716 7,787 22
JSMR Jasa Marga (Persero) Tbk. 5,600 6,600 10/27 5,625 10/02 1,553,162
7. MTRA Mitra Pemuda Tbk. [S] 288 288 10/12 256 10/23 264 10/31 203 5,087 1,390 1,565 22
10/23 1,160 10/26 2,323 2005. IDPR Indonesia Pondasi Raya Tbk. [S] 1,195 1,350 10/10 1,100 89 14 4,058 4,907
1. ACST Acset Indonusa Tbk. [S] 2,960 3,100 10/30 2,860 10/06 2,950 10/31 2,065 2,558 7,553 629 21 6,178 18,134 640 21
2. ADHI Adhi Karya (Persero) Tbk. [S] 2,000 2,280 10/26 1,975 10/05 2,190 10/31 7,798 353,927 751,539 32,753 22 377,107 800,468 32,801 22
4. DGIK Nusa Konstruksi Enjiniring Tbk. [S] 71 86 10/06 69 10/03 77 10/31 427 1,183,723 93,388 33,271 22 1,186,872 93,656 33,276 22
6. JKON Jaya Konstruksi Manggala Pratama Tbk. [S] 585 590 10/31 480 10/12 590 10/31 9,622 192 112 31 12 233,019 48,170 34 12
34.222
90.625
488.342
8. NRCA Nusa Raya Cipta Tbk. [S] 414 446 10/30 416 10/09 434 10/31 1,083 24,588 10,671 1,935 22 24,588 10,671 1,935 22
5,087 1,390 1,565 22142.703
51.059
15
10. PTPP PP (Persero) Tbk. [S] 2,310 2,960 10/27 2,330 10/02 2,850 10/31 17,670 537,907 1,454,936 63,392 22 596,347 1,614,411 63,547 22
9. PBSA Paramita Bangun Sarana Tbk. [S] 1,700 1,700 10/19 1,700 10/19 1,700 10/19 2,550 0.90 2 3 3 18 31 4 4141.667
11. SSIA Surya Semesta Internusa Tbk. [S] 585 610 10/30 565 10/02 590 10/31 2,776 215,614 127,517 16,962 22 243,337 144,023 16,975 22
13. TOTL Total Bangun Persada Tbk. [S] 750 750 10/02 650 10/19 720 10/31 2,455 57,796 39,584 6,997 22 60,135 41,211 6,999 22
12. TOPS Totalindo Eka Persada Tbk. [S] 2,480 2,730 10/31 2,300 10/23 2,730 10/31 880.645 18,198 283,082 702,591 27,882 22 413,960 971,599 28,266 22
14. WIKA Wijaya Karya (Persero) Tbk. [S] 1,790 2,070 10/26 1,725 10/12 1,970 10/31 17,671 605,210 1,143,841 69,171 22 627,700 1,188,726 69,212 22
15. WSKT Waskita Karya (Persero) Tbk. [S] 1,775 2,250 10/27 1,780 10/02 2,120 10/31 28,777 831,936 1,689,858 88,229 22 863,725 1,756,266 88,294 22
7.7.7.7. 779,235 21,132,500 26,865,875 1,026,673 24,278,695 32,578,901 1,028,308
71 ENERGY 65,984 3,044,234 4,710,098 207,923 3,376,652 5,228,489 208,120
1. KOPI Mitra Energi Persada Tbk. [S] 750 755 10/26 725 10/18 750 10/31 523 1,071 796 594 22 1,071 796 594 22
2. LAPD Leyand International Tbk. [S] 50 50 10/26 50 10/26 50 10/26 198 3 0.15 13 12 648 13 18 13
4. PGAS Perusahaan Gas Negara (Persero) Tbk. [S] 1,575 1,900 10/31 1,365 10/09 1,840 10/31 44,604 2,889,729 4,642,405 194,648 22 3,213,317 5,153,464 194,826 22613.333
3. MPOW Megapower Makmur Tbk. 302 378 10/25 290 10/06 312 10/31 156.000 255 1,352 420 547 22 1,352 420 547 22
72 TOLL ROAD, AIRPORT, HARBOR AND ALLIED PRODUCTS 56,146 2,620,750
2. CMNP Citra Marga Nusaphala Persada Tbk. [S] 1,340 1,410 10/27 1,330 10/04 1,355 10/31 4,534 725 984 528 22 725
12,543 8,555 327 22
3.
5. META Nusantara Infrastructure Tbk. [S] 144 212 10/24 145 10/02 190 10/31 2,895 2,387,692 464,477 38,068 22 3,714,315 731,304 38,138 22
1. CASS Cardig Aero Services Tbk. [S] 700 730 10/31 690 10/25 700 10/31 1,461 5,122
6,500 10/31 47,176 225,727 1,388,479 36,673 22 252,664
73 TELECOMMUNICATION 481,977 3,911,517 16,864,771 282,002 5,025,248 21,247,636 282,966
1. BTEL Bakrie Telecom Tbk. 50 - - - - 50 06/22 1,839 - - - - 9,360 135 18 11
2. EXCL XL Axiata Tbk. [S] 3,740 3,750 10/02 3,230 10/24 3,380 10/31 36,125 134,857 471,264 41,392 22 195,950 683,307 41,507 22
3. FREN Smartfren Telecom Tbk. 50 50 10/30 50 10/30 50 10/30 5,185 3,827 191 101 21 3,835 192 104 21
4. INVS** Inovisi Infracom Tbk. 117 - - - - 117 02/12/15 - - - - - 81,681 304 246 15
2.778
-
5. ISAT Indosat Tbk. [S] 6,250 6,400 10/12 5,800 10/31 6,000 10/31 32,604 15,974 98,267 5,378 22 26,905 166,799 5,403 22428.571
6. TLKM Telekomunikasi Indonesia (Persero) Tbk. [S] 4,680 4,710 10/04 4,010 10/26 4,030 10/31 406,224 3,756,859 16,295,048 235,131 22 4,707,518 20,396,900 235,688 222,117.876
984 529 22
4. KARW ICTSI Jasa Prima Tbk. 139 155 10/02 128 10/06 137 10/31 80 1,483 205 459 22 1,483 205 459 2223.191
INFRASTRUCTURE, UTILITIES AND TRANSPORTATIONINFRASTRUCTURE, UTILITIES AND TRANSPORTATIONINFRASTRUCTURE, UTILITIES AND TRANSPORTATIONINFRASTRUCTURE, UTILITIES AND TRANSPORTATION
535.714
242.051
258.782
506.358
572.200
189.873
92.782
73.000
243.000
175.000
383.299
57.040
46.913
171.538
129.658
3. CSIS Cahayasakti Investindo Sukses Tbk. [S] 840 790 10/04 645 10/30 725 10/31 241.667 948 113 78 142 17 113 78 142 17
123.883
1,719.900
62 BUILDING CONSTRUCTION 114,566 4,101,933 6,023,299 343,051
INDONESIASTOCKEXCHANGEIDXMONTHLYSTATISTICS,OCTOBER201729
ResearchandDevelopmentDivision](https://image.slidesharecdn.com/10idxmonthlystatisticsoktober2017-201219125924/85/10-idx-monthly-statistics-oktober-2017-32-320.jpg)
![Table Trading by Industry
Regular Market
Board
Date
Price
Date
Freq.,
xPrev. High Low Close Date
Industry Classification / Stock Name Volume,
th. share
Value,
m. IDR
Days
Days
Freq.,
x
Volume,
th. share
Value,
m. IDR
Market
Cap.,
b. IDR
Index
Total Market
1
2
1
1
1
1
2
2
1
1
2
2
1
2
1
2
2
2
1
2
2
2
2
1
2
2
1
1
2
1
1
1
2
2
2
1
25. Soechi Lines Tbk. [S] 284 300 10/18 268
- - -
6 6
54.359
21.739
70.154
257.900
260 10/13 272 10/31
0.08 5 5
891 19,992 5,378 2,503 22 20,099 5,407 2,505 22
2
11.071
508.303
0.08
23. SHIP Sillo Maritime Perdana Tbk. 795 800 10/26 760 10/16 780 10/31 1,950 70,968 55,706 8,433 22 70,968 55,706 8,434 22
24. SMDR Samudera Indonesia Tbk. [S] 268 280 10/18
21,625 5,828 22 106,986 21,649 5,837 22
32. WINS Wintermar Offshore Marine Tbk. [S] 246 294 10/31 242 10/09 290 10/31 1,171 1,449 380 226 21 1,449 380 226 21
86.871
78.426
33.
105,084 46,904
30. TRAM Trada Alam Minera Tbk 150 191 10/23 126 10/02
28. TMAS Pelayaran Tempuran Emas Tbk. [S] 1,200 1,245 10/03 1,105 10/31 1,105 10/31 1,261 36,724 43,565 2,986 22 39,300 46,656 2,987 22
164 10/31 1,596 5,640,760 890,570 126,520 22 5,844,948 924,076 126,546 22
76.087
131.200
31. WEHA WEHA Transportasi Indonesia Tbk. [S] 206 210 10/11 196 10/30 199 10/31 176 106,831
74 TRANSPORTATION 61,056 10,691,219 1,789,744 336,712 10,961,703 1,862,711 336,836
1. APOL Arpeni Pratama Ocean Line Tbk. 58 - - - - 58 03/31/15 503 - - - - - - - -18.560
-
2. ASSA Adi Sarana Armada Tbk. 226 230 10/02 210 10/30 212 10/31 720 8,148 1,744 672 22 8,148 1,744 672 22
3. BBRM Pelayaran Nasional Bina Buana Raya Tbk. [S] 50 50 10/31 50 10/31 50 10/31 268 2
675 47,748 6,595 2,274 22 47,748 6,595 2,275 22
7. CANI Capitol Nusantara Indonesia Tbk. [S] 354 440 10/04 278 10/09 322 10/31 268 227 81 413 21 227 81 413 21
4. BIRD Blue Bird Tbk. [S] 4,880 4,930 10/02 3,990 10/24 4,560 10/31 11,410 4,153 18,094 3,883 22 10,512 47,056 3,892 22
5. BLTA Berlian Laju Tanker Tbk. 196 - - - - 196 01/24/12 4,603 - - - -
10/31139
50 10/31 50 10/31 50 10/31 499 3,168 158 319 22 5,558 259 327 22
8. CPGT** Citra Maharlika Nusantara Corpora Tbk. 50 - - - - 50 04/28 - - - - - - - - -
9. GIAA Garuda Indonesia (Persero) Tbk. [S] 334 380 10/30 320 10/23 366 10/31 9,474 264,257 90,926 11,136 22 269,305 92,515 11,154 22
6. BULL Buana Listya Tama Tbk. 131 146 10/31 131 10/02
12. INDX Tanah Laut Tbk. [S] 119 122 10/19 110 10/17 118 10/31 52 1,341 155 675 22 1,341 155 675 22
38.462
9.440
10. HITS Humpuss Intermoda Transportasi Tbk. [S] 700 750 10/09 675 10/17 720 10/31 5,113 46 32 31 20 46 32 31 20
11. IATA Indonesia Transport & Infrastructure Tbk. [S] 50
13. LEAD Logindo Samudramakmur Tbk. 90 118 10/05 85 10/02 99 10/31 401 2,164,556 226,144 54,044 22 2,173,951 227,133 54,060 22
14. LRNA Eka Sari Lorena Transport Tbk. [S] 105 112 10/11 95 10/31 96 10/31 34 2,042 209 776 22 4,046 429 780 22
15.456
10.667
15. MBSS Mitrabahtera Segara Sejati Tbk. [S] 386 730 10/31 378 10/04 650 10/31 1,138 296,239 172,040 37,367 22 296,304 172,074 37,369 22
16. MIRA Mitra International Resources Tbk. [S] 50 50 10/30 50 10/30 50 10/30 198 2 0.09 11 6 1,615 48 18 10
40.625
22.062
22 2,083 391 776 22
63.158
76.624
SAFE Steady Safe Tbk. 306 - - - - 306 07/28 188 - - - - - - - -
17. NELY Pelayaran Nelly Dwi Putri Tbk. [S] 122 150 10/23 110 10/03 128 10/31 301 1,701 215 500 21 2,401 298 502 21
19. PTIS Indo Straits Tbk. 600 600 10/17 600 10/17 600 03/08 330 0.30 0.18 2 2 0.30 0.18 2 2
76.190
29. TPMA Trans Power Marine Tbk. [S] 170 175 10/31 162 10/25 175 10/31 461 429 72 71 17 5,516 952 81 17
10/16 276 10/31 1,948 329,798 93,364 19,387 22 329,798 93,364 19,387 22
27. TAXI Express Transindo Utama Tbk. 77 82 10/02 51 10/11 62 10/31 133 1,638,609 22 1,662,332 106,460 46,908 22
26. TAMU Pelayaran Tamarin Samudra Tbk. 3,540 3,750 10/20 3,500 10/18 3,690 10/31 3,354.545 13,838 12,506 44,678 7,505
SOCI
Zebra Nusantara Tbk. 50 - - - - 50 06/21 43 - - - - 275 8 1 1
75 NON BUILDING CONSTRUCTION 114,072 864,781 1,643,535 123,984 933,361 1,945,855 124,126
1. BALI Bali Towerindo Sentra Tbk. [S] 1,315 1,310 10/02 1,240 10/09 1,290 10/31 4,688 1,024 1,309 227 22 1,024 1,309 227 22
28.960
1,612.500
ZBRA
3. IBST Inti Bangun Sejahtera Tbk. [S] 6,400 9,800 10/30 6,450 10/02 9,700 10/31 13,104 643 5,776 302 20 643 5,776 302 20
2. BUKK Bukaka Teknik Utama Tbk. [S] 1,155 1,340 10/30 1,050 10/02 1,320 10/31 3,485 528 666 337 22 528223.729
1,043.235
666 337 22
13.593
161.000
-
49.200
1,107.692
22 12,506 44,678 7,505 22
18. PORT Nusantara Pelabuhan Handal Tbk. [S] 370 388 10/06 340 10/31 342 10/31 63.925 962 623 223 239 22 623 223 239 22
557.143
1,091.580
50.182
21.
22. SDMU Sidomulyo Selaras Tbk. 330 374 10/23 296 10/31 298 10/31 338 36,919 12,333 3,227 22 43,618 14,342 3,228 22
30.807
164.116
20. RIGS Rig Tenders Indonesia Tbk. [S] 193 204 10/18 179 10/13 187 10/31 114 1,983 373 775
ResearchandDevelopmentDivision
INDONESIASTOCKEXCHANGEIDXMONTHLYSTATISTICS,OCTOBER201730](https://image.slidesharecdn.com/10idxmonthlystatisticsoktober2017-201219125924/85/10-idx-monthly-statistics-oktober-2017-33-320.jpg)
![Table Trading by Industry
Regular Market
Board
Date
Price
Date
Freq.,
xPrev. High Low Close Date
Industry Classification / Stock Name Volume,
th. share
Value,
m. IDR
Days
Days
Freq.,
x
Volume,
th. share
Value,
m. IDR
Market
Cap.,
b. IDR
Index
Total Market
1
2
2
1
2
1
2
2
2
2
2
1
2
1
1
1
1
1
1
1
2
1
2
2
2
1
1
2
2
1
1
1
1
1
1
2
2. AGRS Bank Agris Tbk. 252
4. INDY Indika Energy Tbk. [S] 1,940 2,460 10/18 1,830 10/03 2,250 10/31 11,723 579,688 1,255,165 75,181 22 585,957 1,269,341 75,217 22
5. OASA Protech Mitra Perkasa Tbk. [S] 490 755 10/17 492 10/02 675 10/31 242 245,605 163,136 22,337 22 245,723 163,218 22,341 22
76.271
355.263
6. SUPR Solusi Tunas Pratama Tbk. 6,500 - - - - 6,500 07/12 7,394 - - - - - - - -
7. TBIG Tower Bersama Infrastructure Tbk. 6,575 6,875 10/30 6,250 10/18 6,800 10/31 30,814 25,597 166,980 17,702 22 42,088 273,949 17,750 22
199.633
335.802
8. TOWR Sarana Menara Nusantara Tbk. [S] 4,470 4,490 10/04 4,000 10/27 4,100 10/31 41,832 11,696 50,502 7,898 22 53,470 231,558 7,943 22
9. TRUB Truba Alam Manunggal Engineering Tbk. [S] 50 - - - - 50 06/28/13 790 - - - - 3,929 37 9 6
3,918.832
45.455
8.8.8.8. 1,895,976 7,405,530 27,147,703 852,366 15,859,200 36,581,667 857,652
81 BANK 1,719,477 5,060,790 26,154,118 612,079 8,498,392 31,887,745 613,890
1. AGRO Bank Rakyat Indonesia Agroniaga Tbk. 615 625 10/02 530 10/31 535 10/31 9,487 395,700 221,961 36,938 22 404,159 228,031 36,968 22874.069
3. ARTO Bank Artos Indonesia Tbk. 164 204 10/02 119 10/16 154 10/31 184 221 35 266 22 151,736 22,460 269 22
310 10/02 248 10/18 252 10/31 1,311 3,660 982 1,207 22 3,660 982 1,207 22229.091
116.667
4. BABP Bank MNC Internasional Tbk. 51 54 10/30 50 10/24 52 10/31 1,060 148,312 7,595 1,702 22 456,181 23,160 1,705 22
5. BACA Bank Capital Indonesia Tbk. 197 224 10/20 192 10/18 220 10/30 1,533 9,202 1,958 1,171 18 141,136 31,138 1,177 18
59.684
162.200
6. BBCA Bank Central Asia Tbk. 20,300 21,375 10/23 20,050 10/17 20,900 10/31 510,137 333,822 6,845,206 108,213 22 388,988 7,981,308 108,732 22
8. BBKP Bank Bukopin Tbk. 560 575 10/16 540 10/24 555 10/31 4,993 71,156 39,729 4,661 22 83,866 46,845 4,667 22
7. BBHI Bank Harda Internasional Tbk. 153 158 10/18 140 10/31 142 10/31 564 34,877 5,149 5,253 22 55,343 9,219 5,261 22
11,942.857
113.600
164.644
9. BBMD Bank Mestika Dharma Tbk. 1,230 1,535 10/03 1,155 10/05 1,400 10/23 5,669 2 2 8 8 4,002 5,602 10 8
10. BBNI Bank Negara Indonesia (Persero) Tbk. 7,400 7,750 10/30 7,275 10/11 7,600 10/31 140,312 360,996 2,727,461 53,264 22 388,194 2,931,936 53,383 22
101.449
36.553
11. BBNP Bank Nusantara Parahyangan Tbk. 1,450 - - - - 1,450 05/30 972 - - - - - - - -
12. BBRI Bank Rakyat Indonesia (Persero) Tbk. 15,275 15,750 10/26 15,125 10/05 15,600 10/31 380,991 410,772 6,344,084 75,645 22 495,406 7,655,611 75,835 22
363.297
3,565.714
13. BBTN Bank Tabungan Negara (Persero) Tbk. 3,150 3,170 10/13 2,690 10/30 2,760 10/31 28,936 579,749 1,709,362 92,846 22 630,983 1,861,254 92,955 22
14. BBYB Bank Yudha Bhakti Tbk. 350 350 10/02 300 10/31 300 10/31 1,395 23,693 7,459 1,301 22 211,193 67,459 1,303 22
360.000
305.437
15. BCIC Bank JTrust Indonesia Tbk. 50 - - - - 50 11/20/08 1,403 - - - - - - - -
16. BDMN Bank Danamon Indonesia Tbk. 5,200 5,650 10/12 5,025 10/27 5,100 10/31 48,393 33,237 177,435 18,023 22 63,835 339,193 18,060 22
33.740
2.880
17. BEKS Bank Pembangunan Daerah Banten Tbk. 50 50 10/31 50 10/31 50 10/31 3,173 22,233 1,112 1,637 22 1,395,232 63,199 1,784 22
18. BGTG Bank Ganesha Tbk. 98 101 10/02 92 10/25 94 10/31 1,040 15,366 1,458 1,792 22 15,416 1,464 1,793 22
217.306
91.262
19. BINA Bank Ina Perdana Tbk. 1,055 1,090 10/11 950 10/19 985 10/31 5,514 111,120 115,403 529 22 207,870 222,017 634 22
20. BJBR BPD Jawa Barat dan Banten Tbk. 2,600 2,750 10/04 2,380 10/24 2,450 10/31 23,518 253,259 647,639 25,967 22 373,375 950,981 26,063 22
556.510
408.333
21. BJTM BPD Jawa Timur Tbk. 700 720 10/12 665 10/23 695 10/31 10,303 244,449 169,064 22,816 22 253,435 175,324 22,821 22
22. BKSW Bank QNB Indonesia Tbk. 216 240 10/24 183 10/20 234 10/31 3,937 506 112 214 22 95,402 15,148 222 22
161.628
536.944
23. BMAS Bank Maspion Indonesia Tbk. 364 396 10/02 330 10/04 358 10/30 1,575 420 150 168 18 420 150 168 18
24. BMRI Bank Mandiri (Persero) Tbk. 6,725 7,150 10/31 6,575 10/09 7,050 10/31 325,710 949,249 6,554,536 72,315 22 1,130,306 7,793,188 72,621 22
111.875
2,124.345
25. BNBA Bank Bumi Arta Tbk. 242 246 10/31 232 10/30 238 10/31 544 2,381 564 358 22 2,431 573 359 22
26. BNGA Bank CIMB Niaga Tbk. 1,295 1,315 10/02 1,160 10/17 1,240 10/31 30,852 121,923 151,159 16,063 22 135,464 167,940 16,111 22
148.750
9.156
27. BNII Bank Maybank Indonesia Tbk. 296 330 10/19 290 10/13 304 10/31 20,389 54,612 16,889 4,337 22 54,612 16,889 4,342 22
28. BNLI Bank Permata Tbk. 705 725 10/05 650 10/31 650 10/31 18,046 243,971 166,708 17,579 22 245,415 167,740 17,584 22
3.593
7.077
29. BSIM Bank Sinarmas Tbk. 890 900 10/31 700 10/12 900 10/31 13,665 814 690 170 20 44,755 34,761 178 21
30. BSWD Bank of India Indonesia Tbk. 1,600 1,995 10/12 1,510 10/26 1,795 10/27 1,851 34 59 44 11 34 59 44 11
613.836
1,340.252
FINANCEFINANCEFINANCEFINANCE
ResearchandDevelopmentDivision
INDONESIASTOCKEXCHANGEIDXMONTHLYSTATISTICS,OCTOBER201731](https://image.slidesharecdn.com/10idxmonthlystatisticsoktober2017-201219125924/85/10-idx-monthly-statistics-oktober-2017-34-320.jpg)
![Table Trading by Industry
Regular Market
Board
Date
Price
Date
Freq.,
xPrev. High Low Close Date
Industry Classification / Stock Name Volume,
th. share
Value,
m. IDR
Days
Days
Freq.,
x
Volume,
th. share
Value,
m. IDR
Market
Cap.,
b. IDR
Index
Total Market
1
1
1
2
1
1
1
1
1
1
1
2
2
1
2
2
2
1
2
2
1
2
2
2
2
2
2
2
1
2
2
1
1
2
1
1
31. BTPN Bank Tabungan Pensiunan Nasional Tbk. 2,550 2,630 10/02 2,480 10/13 2,550 10/31 14,744 1,632 4,111 382 21 324,198 811,289 390 21
32. BVIC Bank Victoria International Tbk. 204 240 10/26 192 10/03 202 10/31 1,736 22,345 4,855 2,797 22 22,645 4,917 2,800 22
493.648
191.011
33. DNAR Bank Dinar Indonesia Tbk. 280 280 10/27 234 10/13 280 10/27 624 39 10 31 10 39 10 31 10
34. INPC Bank Artha Graha Internasional Tbk. 89 92 10/12 85 10/11 87 10/31 1,361 60,285 5,351 6,607 22 60,285 5,351 6,607 22
254.545
0.497
35. MAYA Bank Mayapada Internasional Tbk. 3,210 3,800 10/31 2,800 10/04 3,800 10/31 20,580 3,477 11,625 399 20 3,670 11,963 403 20
36. MCOR Bank China Construction Bank Indonesia Tbk. 206 220 10/09 202 10/19 206 10/31 3,392 249,163 52,354 14,249 22 249,845 52,495 14,251 22
1,499.576
184.767
37. MEGA Bank Mega Tbk. 3,000 3,150 10/12 2,900 10/12 2,950 10/30 20,338 24 72 126 13 24 72 126 13
38. NAGA Bank Mitraniaga Tbk. 234 268 10/18 179 10/16 228 10/31 368 134 32 183 18 134 32 183 18
2,150.334
126.667
39. NISP Bank OCBC NISP Tbk. 1,865 2,320 10/26 1,800 10/23 1,915 10/31 21,750 8,085 15,013 147 15 10,153 18,911 149 15
40. NOBU Bank Nationalnobu Tbk. 890 905 10/31 875 10/06 905 10/31 3,976 45,304 40,357 6,417 22 45,304 40,357 6,417 22
1,160.276
241.333
41. PNBN Bank Pan Indonesia Tbk. 1,140 1,220 10/04 1,075 10/30 1,090 10/31 25,983 79,513 90,417 8,239 22 91,435 103,784 8,256 22
42. PNBS Bank Panin Dubai Syariah Tbk. [S] 100 100 10/25 92 10/31 94 10/31 948 164,848 15,792 7,887 22 257,605 24,767 7,893 22
1,814.852
94.000
43. SDRA Bank Woori Saudara Indonesia 1906 Tbk. 780 970 10/31 615 10/24 955 10/31 6,222 209 166 128 18 209 166 128 18
82 FINANCIAL INSTITUTION 27,208 672,188 193,562 96,336 1,616,796 863,098 96,363
1. ADMF Adira Dinamika Multi Finance Tbk. 7,250 7,200 10/19 6,875 10/03 7,075 10/31 7,075 2,038 14,281 592 22 6,158 42,927 595 22
1,068.173
304.301
2. BBLD Buana Finance Tbk. 615 600 10/06 486 10/06 560 10/13 922 1 0.72 5 3 1 0.72 5 3
3. BFIN BFI Finance Indonesia Tbk. 560 735 10/23 560 10/02 700 10/31 11,177 89,023 60,478 1,268 22 820,995 566,350 1,275 22
222.553
3,587.168
4. BPFI Batavia Prosperindo Finance Tbk. 450 496 10/16 450 10/16 490 08/30 775 1 0.57 10 3 1 0.57 10 3
5. CFIN Clipan Finance Indonesia Tbk. 306 314 10/11 292 10/10 310 10/31 1,235 19,284 5,800 383 22 19,654 5,911 385 22
499.974
24.258
6. DEFI Danasupra Erapacific Tbk. 675 700 10/31 660 10/04 695 10/31 470 395 267 108 22 147,957 90,699 113 22
8. HDFA Radana Bhaskara Finance Tbk. 240 252 10/25 171 10/05 210 10/31 489 201 43 204 21 201 43 204 21
1,394.966
113.710
7. FINN First Indo American Leasing Tbk. 192 208 10/09 143 10/31 144 10/31 137.143 268 220,786 37,753 19,815 22 220,786 37,753 19,815 22
9. IBFN Intan Baruprana Finance Tbk. 180 - - - - 180 08/18 571 - - - - 19,200 3,456 1 1
10. IMJS Indomobil Multi Jasa Tbk. 270 292 10/20 264 10/17 274 10/31 1,185 48,966 13,556 4,819 22 49,071 13,591 4,823 22
62.500
54.800
11. MFIN Mandala Multifinance Tbk. 1,300 1,330 10/09 1,265 10/17 1,295 10/31 1,716 7,617 9,910 932 22 48,546 50,839 933 22
12. MGNA Magna Finance Tbk. 67 - - - - 67 06/14 67 - - - - - - - -
664.103
63.810
13. TIFA Tifa Finance Tbk 180 244 10/19 174 10/24 195 10/31 211 100,710 21,962 54,922 22 100,710 21,962 54,922 22
14. TRUS Trust Finance Indonesia Tbk. 193 195 10/17 127 10/20 134 10/30 107 2 0.34 10 6 2 0.34 10 6
97.500
157.647
15. VRNA Verena Multi Finance Tbk. 98 111 10/18 98 10/10 101 10/31 261 73,921 7,595 9,848 22 74,071 7,610 9,850 22
16. WOMF Wahana Ottomitra Multiartha Tbk. 200 212 10/05 193 10/31 195 10/31 679 109,242 21,915 3,420 22 109,442 21,955 3,422 22
101.902
29.563
83 SECURITIES COMPANY 30,680 1,107,457 621,764 95,546 2,572,807 1,574,180 96,667
2. HADE HD Capital Tbk. 50 - - - - 50 03/15 106 - - - - - - - -131.579
3. KREN Kresna Graha Investama Tbk. 448 620 10/30 442 10/03 610 10/31 11,107 1,056,600 559,578 82,530 22 1,700,528 866,617 83,312 22
4. PADI Minna Padi Investama Sekuritas Tbk. 1,525 1,640 10/05 1,170 10/25 1,395 10/31 15,774 38,378 54,862 11,023 22 859,759 700,152 11,360 22
5. PANS Panin Sekuritas Tbk. 2,230 2,230 10/02 1,950 10/26 2,050 10/31 1,476 2,844 5,797 1,029 22 2,884 5,882 1,031 22
6. PEGE Panca Global Securities Tbk. 286 282 10/05 280 10/30 280 10/30 198 6 2 7 5 6 2 7 5
7. RELI Reliance Sekuritas Indonesia Tbk. 426 575 10/27 420 10/13 430 08/24 774 5 2 17 5 5 2 17 5
8. TRIM Trimegah Sekuritas Indonesia Tbk. 161 175 10/27 150 10/25 169 10/31 1,201 9,178 1,453 603 22 9,178 1,453 603 22
6,346.234
2,759.917
1,490.909
280.000
198.461
170.303
INDONESIASTOCKEXCHANGEIDXMONTHLYSTATISTICS,OCTOBER201732
ResearchandDevelopmentDivision](https://image.slidesharecdn.com/10idxmonthlystatisticsoktober2017-201219125924/85/10-idx-monthly-statistics-oktober-2017-35-320.jpg)
![Table Trading by Industry
Regular Market
Board
Date
Price
Date
Freq.,
xPrev. High Low Close Date
Industry Classification / Stock Name Volume,
th. share
Value,
m. IDR
Days
Days
Freq.,
x
Volume,
th. share
Value,
m. IDR
Market
Cap.,
b. IDR
Index
Total Market
2
2
2
2
2
1
2
2
2
1
2
2
1
2
2
1
2
2
2
2
2
1
1
1
2
1
2
1
2
2
2
2
1
1
20
11. MTWI Malacca Trust Wuwungan Insurance Tbk. 100 855 10/23 120 10/11 386 10/11 386.000 589 193,041 52,551 16,107 14 196,612 53,071 16,126 14
5. BOGA Bintang Oto Global Tbk. [S] 600 620 10/31 575 10/12 615 10/31 2,339 39,272 23,514 7,334 22 158,002 92,406 7,358 22
CASA Capital Financial Indonesia Tbk. 406 408
6. CARS Industri dan Perdagangan Bintraco Dharma Tbk. 1,500 1,450 10/04 1,100 10/18 1,150 10/31 1,725 1,065 1,319 544 20 36,565 35,479 55365.714
10. DPUM Dua Putra Utama Makmur Tbk. [S] 330 332 10/02 270 10/27 278 10/31 1,161 19,586 5,467 2,419 22 24,586 6,717 2,420 22
19
9. YULE Yulie Sekuritas Indonesia Tbk. 178 188 10/02 110 10/24 170 10/31 43 447 71 337 21 447 71 337 21
84 INSURANCE 22,001 252,426 99,237 30,791 1,686,358 1,284,046 32,991
1. ABDA Asuransi Bina Dana Arta Tbk. 6,900 6,650 10/23 6,650 10/23 6,650 08/24 4,128 0.10 0.67 1 1 0.10 0.68 2 21,518.199
2. AHAP Asuransi Harta Aman Pratama Tbk. 161 185 10/31 160 10/31 185 10/31 155 103 16 10 6 103 16 10 6
3. AMAG Asuransi Multi Artha Guna Tbk. 400 416 10/13 350 10/18 376 10/31 1,881 413 151 111 15 613 205 112 15
373.164
358.095
4. ASBI Asuransi Bintang Tbk. 312 336 10/27 282 10/26 284 10/31 99 7,070 2,226 5,476 22 7,077 2,227 5,477 22
5. ASDM Asuransi Dayin Mitra Tbk. 1,070 1,080 10/30 1,070 10/12 1,080 10/30 207 16 17 17 11 16 17 17 11
215.592
319.008
6. ASJT Asuransi Jasa Tania Tbk. 570 975 10/12 490 10/02 900 10/31 540 3,318 2,624 640 21 25,739 21,984 646 21
7. ASMI Asuransi Kresna Mitra Tbk. 875 935 10/05 845 10/20 875 10/31 7,839 41,965 36,980 4,767 22 1,303,985 1,090,265 6,933 22
600.000
1,620.370
8. ASRM Asuransi Ramayana Tbk. 2,420 2,450 10/23 2,250 10/04 2,440 10/27 524 11 25 28 8 11 25 28 8
9. LPGI Lippo General Insurance Tbk. 4,990 5,500 10/12 4,750 10/13 4,950 10/31 743 242 1,197 407 22 1,242 5,822 408 22
873.394
222.472
10. MREI Maskapai Reasuransi Indonesia Tbk. 4,000 4,650 10/19 3,820 10/06 4,200 10/31 1,631 26 105 54 17 23,040 84,006 56 17
12. PNIN Paninvest Tbk. 815 845 10/17 810 10/04 840 10/31 3,417 3,454 2,866 399 22 3,454 2,866 400 22
360.254
893.237
13. VINS Victoria Insurance Tbk. 138 194 10/18 120 10/12 171 10/31 248 2,769 477 2,774 21 124,469 23,540 2,776 21
89 OTHERS 96,610 312,670 79,021 17,614 1,484,846 972,597 17,741
162.857
1. APIC Pacific Strategic Financial Tbk. 450 458 10/31 442 10/19 458 10/31 5,388 21,866 9,765 909 14 785,223 349,596 940
2. BCAP MNC Kapital Indonesia Tbk. 1,570 1,570 10/24 1,565 10/19 1,570 10/24 8,592 0.30 0.47 3 3 0.30 0.47 3
487.151
3
3. BPII Batavia Prosperindo International Tbk. 4,700 - - - - 4,700 09/04 2,416 - - - - - - - -
5. GSMF Equity Development Investment Tbk. 124 148 10/25 118 10/30 120 10/31 895 9,773 1,316 7,669 22 9,773 1,316 7,670 22
10/09 382 10/31 382 10/31 4,419 2,134 846 404 20 153,212 60,041 422 20
635.589
940.000
293.846
9.654
4.
6. LPPS Lippo Securities Tbk. 103 104 10/02 95 10/30 99 10/31 256 677 66 270 20 677 66 270 20
7. MTFN Capitalinc Investment Tbk. 50 - - - - 50 06/22 1,592 - - - - 46,095 2,267 44 12
6.725
1.266
8. PNLF Panin Financial Tbk. 244 252 10/04 236 10/31 236 10/31 7,557 277,513 66,556 7,766 22 438,612 103,843 7,779 22
9. SMMA Sinar Mas Multiartha Tbk. 9,975 10,200 10/30 9,900 10/30 9,975 10/31 63,517 31 312 38 12 50,578 455,309 58 16
255.080
743.587
10. VICO Victoria Investama Tbk. 296 314 10/16 195 10/31 216 10/31 1,976 676 158 555 18 676 158 555 18
9.9.9.9. 748,444 17,523,807 14,058,298 1,360,652 28,955,904 21,601,932 1,363,600
91 WHOLESALE (DURABLE & NON-DURABLE GOODS) 200,414 884,541 3,814,757 270,031 2,452,357 5,540,242 270,560
172.800
1. AIMS Akbar Indo Makmur Stimec Tbk. [S] 137 178 10/04 87 10/13 127 10/31 28 350 46 350 19 2,317 213 351 20
2. AKRA AKR Corporindo Tbk. [S] 7,100 8,025 10/27 6,850 10/09 7,450 10/31 29,847 116,519 850,796 33,899 22 142,553 1,039,572 33,955 22
101.600
5,937.627
3. APII Arita Prima Indonesia Tbk. [S] 254 300 10/06 210 10/12 258 10/31 278 51 13 138 19 51 13 138 19
10/31 50 10/31 448 5,608 280 105 22 313,527 20,291 114 22
4. BMSR Bintang Mitra Semestaraya Tbk. [S] 100 107 10/02 60 10/06 89 10/31 103 182 16 195 19 182 16 195 19
7. CLPI Colorpak Indonesia Tbk. [S] 1,005 1,080 10/23 965 10/31 970 10/31 297 2,131 2,154 566 22 2,131 2,154 566 22
8. CMPP Rimau Multi Putra Pratama Tbk. [S] 830 1,445 10/11 635 10/03 835 10/31 180 17,515 18,003 11,730 22 18,421 18,719 11,753 22
9. CNKO Exploitasi Energi Indonesia Tbk. [S] 50 50 10/31 50
TRADE, SERVICES & INVESTMENTTRADE, SERVICES & INVESTMENTTRADE, SERVICES & INVESTMENTTRADE, SERVICES & INVESTMENT
79.070
117.273
17.800
597.087
485.000
136.163
3.288
50.545
INDONESIASTOCKEXCHANGE
ResearchandDevelopmentDivision
IDXMONTHLYSTATISTICS,OCTOBER201733](https://image.slidesharecdn.com/10idxmonthlystatisticsoktober2017-201219125924/85/10-idx-monthly-statistics-oktober-2017-36-320.jpg)
![Table Trading by Industry
Regular Market
Board
Date
Price
Date
Freq.,
xPrev. High Low Close Date
Industry Classification / Stock Name Volume,
th. share
Value,
m. IDR
Days
Days
Freq.,
x
Volume,
th. share
Value,
m. IDR
Market
Cap.,
b. IDR
Index
Total Market
2
2
1
1
2
2
1
2
1
1
2
2
2
2
2
2
2
2
1
2
1
1
2
2
1
1
2
1
2
2
1
2
2
1
1
2
2
83 - - - - 83 11/06/1525. SIAP Sekawan Intipratama Tbk. [S] 1,992 - - - - 75,010 1,654 42 19
26. SQMI Renuka Coalindo Tbk. [S] 440 650 10/26 320 10/19 418 10/31 126 1,133 597 549 18 1,133 597 549 18
27. TGKA Tigaraksa Satria Tbk. [S] 2,600 2,650 10/02 1,900 10/18 2,500 10/27 2,296 23 54 74 9 30 73 75 9
28. TIRA Tira Austenite Tbk. [S] 212 212 10/17 210
11. EPMT Enseval Putra Megatrading Tbk. [S] 2,900 3,000 10/09 3,000 10/09 3,000 10/09 8,126 0.50 2 1 1 0.50 2 1 1
12. FISH FKS Multi Agro Tbk. [S] 2,200 2,550 10/12 2,100 10/03 2,300 10/25 1,104 12 27 16 4 12 27 16 4
13. GREN Evergreen Invesco Tbk. 328 - - - - 328 06/16 1,540 - - - - - - - -
14. HEXA Hexindo Adiperkasa Tbk. [S] 3,900 3,920 10/02 3,450 10/31 3,470 10/31 2,915 590 2,139 477 22 598 2,160 478 22
15. INTA Intraco Penta Tbk. 284 396 10/31 278 10/03 388 10/31 1,289 194,366 64,981 16,600 22 218,740 73,266 16,606 22
16. INTD Inter Delta Tbk. [S] 410 420 10/16 276 10/24 396 10/31 234 245 89 118 9 245 89 118 9
17. KOBX Kobexindo Tractors Tbk. 117 125 10/31 112 10/04 120 10/31 273 13,556 1,610 2,836 22 13,556 1,610 2,836 22
18. KONI Perdana Bangun Pusaka Tbk. 730 720 10/26 700 10/13 720 10/26 109 0.20 0.14 2 2 0.20 0.14 2 2
19. LTLS Lautan Luas Tbk. [S] 494 530 10/27 486 10/10 505 10/31 788 6,511 3,288 828 22 6,711 3,386 829 22
20. MDRN Modern Internasional Tbk. 50 50 10/30 50 10/30 50 10/30 229 948 47 32 10 3,116 148 41 13
21. MICE Multi Indocitra Tbk. [S] 352 400 10/26 380 10/03 400 10/26 240 405 162 40 15 405 162 40 15
22. MPMX Mitra Pinasthika Mustika Tbk. 900 1,090 10/31 900 10/02 1,085 10/31 4,842 75,361 73,785 14,356 22 116,546 111,999 14,362 22
23. OKAS Ancora Indonesia Resources Tbk. 390 620 10/10 300 10/04 440 10/31 777 99,438 48,468 25,641 22 99,503 48,504 25,644 22
24. SDPC Millennium Pharmacon International Tbk. [S] 111 123 10/13 106 10/03 116 10/31 84 3,408 392 641 22 3,410 392 642 22
10/19 210 10/19 123 2 0.49 7 4 2 0.49 7 4
29. TMPI Sigmagold Inti Perkasa Tbk. 50 - - - - 50 06/22 275 - - - - 141,538 28,488 39 13
30. TRIL Triwira Insanlestari Tbk. [S] 50 51 10/24 50 10/31 50 10/31 60 3,181 159 57 11 3,181 159 57 11
31. TURI Tunas Ridean Tbk. [S] 1,150 1,200 10/05 1,150 10/31 1,150 10/31 6,417 36,502 42,914 1,154 22 36,502 42,914 1,154 22
32. UNTR United Tractors Tbk. [S] 32,000 35,800 10/26 31,800 10/02 34,675 10/31 129,342 78,277 2,641,785 95,817 22 103,008 3,474,253 96,112 22
33. WAPO Wahana Pronatural Tbk. [S] 111 147 10/10 110 10/11 112 10/31 58 138,142 17,755 49,221 22 138,142 17,755 49,221 22
34. WICO Wicaksana Overseas International Tbk. [S] 360 635 10/30 342 10/04 605 10/31 768 30,165 14,895 4,284 22 792,635 517,023 4,286 22
93 RETAIL TRADE 203,880 6,042,388 4,752,898 314,185 8,415,559 7,667,984 315,155
1. ACES Ace Hardware Indonesia Tbk. [S] 1,215 1,425 10/30 1,200 10/03 1,255 10/31 21,523 322,031 416,243 40,502 22 492,522 635,369 40,590 221,530.488
2. AMRT Sumber Alfaria Trijaya Tbk. 695 730 10/27 680 10/27 695 10/31 28,860 24,257 16,807 639 22 98,602 67,850 653 22
3. CENT Centratama Telekomunikasi Indonesia Tbk. [S] 96 98 10/04 90 10/27 92 10/31 2,869 32,527 3,027 1,885 22 45,265 4,211 1,886 22
1,773.457
588.800
4. CSAP Catur Sentosa Adiprana Tbk. [S] 480 480 10/02 430 10/27 470 10/31 1,905 15,827 7,358 2,085 22 15,827 7,358 2,085 22
5. DAYA Duta Intidaya Tbk. [S] 216 199 10/05 190 10/30 190 10/30 395 106 20 65 12 106 20 65 12
237.176
105.556
7. ERAA Erajaya Swasembada Tbk. [S] 830 910 10/18 730 10/24 790 10/31 2,291 239,590 200,148 20,760 22 263,440 219,620 20,768 22
6. ECII Electronic City Indonesia Tbk. [S] 840 855 10/25 725 10/11 840 10/31 1,121 580 477 78 19 2,960 2,476 79 19
8. GLOB Global Teleshop Tbk. 456 - - - - 456 06/27/16 507 - - - - - - - -
9. GOLD Visi Telekomunikasi Infrastruktur Tbk. [S] 470 570 10/31 364 10/16 535 10/31 168 197 98 53 16 197 98 53 16
10. HERO Hero Supermarket Tbk. [S] 1,190 1,200 10/02 1,075 10/26 1,100 10/27 4,602 735 809 106 17 3,352 3,792 108 18
12. KOIN Kokoh Inti Arebama Tbk. [S] 296 300 10/10 260 10/25 296 10/30 290 246 73 39 19 246 73 39 19
2,296.067
200.235
11. KIOS Kioson Komersial Indonesia Tbk. [S] 300 4,100 10/31 450 10/05 2,850 10/05 950.000 1,853 7,026 17,214 4,002 11 68,109 40,992 4,062 11
13. LPPF Matahari Department Store Tbk. [S] 9,275 9,950 10/03 8,475 10/30 8,600 10/31 25,094 98,316 924,983 80,052 22 262,620 2,491,378 80,217 22194.874
20.741
79.000
39.652
152.857
2,098.944
1,840.000
312.381
1,062.267
273.507
121.956
30.000
151.579
178.516
8.039
81.633
72.333
1,100.853
76.086
167.200
2,054.401
94.249
53.978
12.500
2,555.556
41,279.762
64.000
31.274
82.046
ResearchandDevelopmentDivision
INDONESIASTOCKEXCHANGEIDXMONTHLYSTATISTICS,OCTOBER201734](https://image.slidesharecdn.com/10idxmonthlystatisticsoktober2017-201219125924/85/10-idx-monthly-statistics-oktober-2017-37-320.jpg)
![Table Trading by Industry
Regular Market
Board
Date
Price
Date
Freq.,
xPrev. High Low Close Date
Industry Classification / Stock Name Volume,
th. share
Value,
m. IDR
Days
Days
Freq.,
x
Volume,
th. share
Value,
m. IDR
Market
Cap.,
b. IDR
Index
Total Market
1
2
2
1
1
1
2
2
1
1
1
2
2
2
2
2
2
2
1
2
2
2
2
2
2
2
2
2
2
2
2
1
2
2
1
2
2
20. NASA Ayana Land International Tbk. [S] 390 402 10/31 348 10/18 400 10/31 388.350 4,400 8,784 3,365 1,242 22 159,189 61,045 1,246 22
274 22 12,488 21,061 292 222,040 10/31 1,950 10/03 2,040 10/31 121.429 4,429 248 498
2. ARTA Arthavest Tbk. [S] 380 685 10/18 272 10/25 290 10/31 130 164,799 86,495 31,770 20 164,869 86,526 31,772 20
14. MAPI Mitra Adiperkasa Tbk. 7,000 7,000 10/16 6,150 10/19 6,550 10/31 10,873 43,819 285,305 21,175 22 87,880 577,059 21,235 221,048.000
15. MIDI Midi Utama Indonesia Tbk. 975 1,100 10/30 900 10/04 1,100 10/30 3,171 10,576 11,332 60 17 10,576 11,332 60 17
16. MKNT Mitra Komunikasi Nusantara Tbk. [S] 1,425 1,485 10/03 1,280 10/16 1,420 10/31 1,420 23,846 34,110 7,754 22 25,322 36,177 7,762 22
400.000
710.000
17. MPPA Matahari Putra Prima Tbk. [S] 655 680 10/02 570 10/27 580 10/31 3,119 50,897 32,051 7,423 22 51,597 32,366 7,424 22243.851
18. RALS Ramayana Lestari Sentosa Tbk. [S] 900 980 10/09 865 10/30 915 10/31 6,493 144,503 133,494 14,672 22 224,086 205,636 14,701 22
19. RANC Supra Boga Lestari Tbk. [S] 292 312 10/30 276 10/04 302 10/31 472 20,599 6,136 417 22 20,599 6,136 417 22
571.875
60.400
20. RIMO Rimo International Lestari Tbk. [S] 472 770 10/26 458 10/03 630 10/31 25,790 4,996,890 2,652,487 110,459 22 6,687,821 3,265,347 110,990 22
21. SKYB Skybee Tbk. [S] 420 - - - - 420 11/24/14 246 - - - - - - - -
345.882
112.000
22. SONA Sona Topas Tourism Industry Tbk. [S] 2,100 2,100 10/20 1,900 10/27 2,000 10/31 662 11 22 22 8 11 22 22 8
23. TELE Tiphone Mobile Indonesia Tbk. 1,120 1,120 10/27 1,065 10/18 1,115 10/31 8,142 9,807 10,704 1,937 22 54,422 60,672 1,939 22
193.939
359.677
24. TRIO Trikomsel Oke Tbk. 2,000 - - - - 2,000 01/04/16 52,015 - - - - - - - -
94 TOURISM, RESTAURANT AND HOTEL 65,795 4,841,663 729,676 292,133 6,703,400 1,315,669 292,731
1. AKKU Anugerah Kagum Karya Utama Tbk. 52 79 10/25 50 10/20 73 10/31 471 517,435 35,351 18,201 22 519,085 35,483 18,202 22
887.784
110.804
3. BAYU Bayu Buana Tbk. [S] 1,250 1,260 10/31 1,100 10/12 1,255 10/31 443 240 295 30 12 1,840 2,295 31 13
168.223
154.803
4. BUVA Bukit Uluwatu Villa Tbk. [S] 565 565 10/27 520 10/26 565 10/27 1,924 23 12 30 8 186,012 116,940 408 22
5. FAST Fast Food Indonesia Tbk. [S] 1,495 1,550 10/26 1,455 10/12 1,530 10/30 3,053 227 339 55 16 227 339 55 16
217.308
2,406.228
7. HOME Hotel Mandarine Regency Tbk. [S] 240 302 10/20 112 10/25 117 10/31 265 518,316 111,132 69,468 22 518,466 111,174 69,469 22
6. GMCW Grahamas Citrawisata Tbk. 860 - - - - 860 03/20/12 51 - - - - - - - -86.000
124.377
8. HOTL Saraswati Griya Lestari Tbk. 104 108 10/31 95 10/24 107 10/31 380 1,477,749 153,803 1,616 22 1,603,723 160,803 1,618 22
9. ICON Island Concepts Indonesia Tbk. [S] 99 157 10/31 95 10/12 141 10/31 154 109,566 12,421 38,629 22 210,408 44,136 38,645 22
57.838
270.654
10. INPP Indonesian Paradise Property Tbk. [S] 610 640 10/31 610 10/25 620 10/31 6,933 12,435 7,738 1,374 22 12,435 7,738 1,374 22
11. JGLE Graha Andrasenta Propertindo Tbk. [S] 164 165 10/02 120 10/23 135 10/31 3,049 32,687 4,392 3,754 22 860,898 120,612 3,762 22
590.476
96.429
12. JIHD Jakarta International Hotels & Dev. Tbk. [S] 540 605 10/17 450 10/30 490 10/31 1,141 394 200 70 13 394 200 70 13
13. JSPT Jakarta Setiabudi Internasional Tbk. [S] 2,600 2,600 10/11 2,500 10/20 2,500 10/20 5,797 1 3 2 2 1 3 3 3
277.951
538.422
14. KPIG MNC Land Tbk. [S] 1,305 1,290 10/27 1,150 10/12 1,290 10/27 8,889 55 66 84 13 176,809 207,400 192 21
16. MAMI Mas Murni Indonesia Tbk. [S] 89 123 10/17 87 10/03 102 10/31 427 1,898,924 204,222 52,318 22 2,174,887 229,916 52,343 2211.721
1,930 10/31 1,723.214 11,435 28,774 58,189 25,088 22 28,774 58,189 25,088 22
277.581
15. MABA Marga Abhinaya Abadi Tbk. [S] 2,030 2,140 10/24 1,900 10/19
17. MAMIP Mas Murni Tbk. (Preferred Stock) 600 - - - - 600 04/24/07 4 - - - - - - - -
21. PANR Panorama Sentrawisata Tbk. [S] 600 605 10/31 530 10/19 605 10/31 726 27,270 15,267 6,526 22 28,282 15,812 6,529 22
400.000
362.993
19. MINA Sanurhasta Mitra Tbk. [S] 2,190 2,600 10/24 2,030 10/24 2,510 10/31 2,390.476 3,294 7,459 17,749 2,250 22 7,459 17,749 2,250 22
18. MAPB MAP Boga Adiperkasa Tbk. [S] 2,030
22. PDES Destinasi Tirta Nusantara Tbk. [S] 1,165 1,295 10/25 1,165 10/04 1,295 10/25 926 30 36 33 7 97 99 59 8
23. PGLI Pembangunan Graha Lestari Indah Tbk. [S] 144 160 10/31 138 10/02 151 10/31 74 4,669 700 468 22 4,669 700 468 22
647.500
201.333
24. PJAA Pembangunan Jaya Ancol Tbk. [S] 1,650 1,700 10/30 1,550 10/18 1,610 10/31 2,576 13 21 34 12 13 21 34 12
25. PNSE Pudjiadi & Sons Tbk. [S] 1,295 1,550 10/26 1,250 10/26 1,250 08/18 997 0.40 0.53 4 3 0.41 0.54 5 3
314.146
624.575
26. PSKT Red Planet Indonesia Tbk. [S] 50 51 10/02 50 10/30 50 10/30 518 3,784 189 1,157 17 4,584 229 1,159 1759.494
ResearchandDevelopmentDivision
INDONESIASTOCKEXCHANGEIDXMONTHLYSTATISTICS,OCTOBER201735](https://image.slidesharecdn.com/10idxmonthlystatisticsoktober2017-201219125924/85/10-idx-monthly-statistics-oktober-2017-38-320.jpg)
![Table Trading by Industry
Regular Market
Board
Date
Price
Date
Freq.,
xPrev. High Low Close Date
Industry Classification / Stock Name Volume,
th. share
Value,
m. IDR
Days
Days
Freq.,
x
Volume,
th. share
Value,
m. IDR
Market
Cap.,
b. IDR
Index
Total Market
2
1
2
2
2
1
2
2
2
2
2
2
1
1
1
1
2
1
2
2
2
2
1
1
1
1
2
2
1
1
1
2
1
2
16,628 839 21
2. OCAP Onix Capital Tbk. 430 - - - - 430 01/27/16 117 - - - - - - - -
9. MARI Mahaka Radio Integra Tbk. 1,260 1,300 10/03 1,185 10/27 1,215 10/31 638 7,048 8,753 4,393 22 14,348 16,157 4,398 22
27. PTSP Pioneerindo Gourmet International Tbk. [S] 7,000 - - - - 7,000 05/23 1,546 - - - - - - - -549.020
28. PUDP Pudjiadi Prestige Tbk. [S] 525 660 10/16 480 10/31 480 10/31 158 27,138 16,288 37,172 22 27,148 16,294 37,173 22
29. SHID Hotel Sahid Jaya International Tbk. [S] 1,375 1,500 10/05 1,200 10/12 1,435 10/30 1,606 643 903 484 21 643 903 484 21
59.869
66.686
95 ADVERTISING, PRINTING AND MEDIA 136,884 795,125 1,207,684 140,418 1,330,868 1,793,087 140,592
1. ABBA Mahaka Media Tbk. 50 55 10/11 50 10/31 50 10/31 138 1,152 58 226 21 46,375 1,867 229 21
2. BLTZ Graha Layar Prima Tbk. [S] 10,500 10,800 10/31 10,500 10/20 10,800 10/31 4,719 15 158 32 22 15 158 32 22
87.719
360.000
3. EMTK Elang Mahkota Teknologi Tbk. 10,200 9,900 10/25 8,200 10/31 8,200 10/31 46,248 24 210 53 16 95 865 54 16
4. FORU Fortune Indonesia Tbk. 220 266 10/27 166 10/30 195 10/31 91 107 22 63 11 107 22 63 11
1,138.889
150.000
5. JTPE Jasuindo Tiga Perkasa Tbk. [S] 308 322 10/11 302 10/10 308 10/31 528 7,451 2,315 1,322 22 7,451 2,315 1,322 22
6. KBLV First Media Tbk. [S] 920 910 10/02 775 10/31 795 10/31 1,385 81 66 79 17 81 66 79 17
684.444
211.470
7. LINK Link Net Tbk. [S] 5,175 5,200 10/17 4,710 10/12 4,990 10/31 15,183 19,289 95,271 13,695 22 24,654 121,878 13,719 22
8. LPLI Star Pacific Tbk. 184 190 10/05 167 10/31 170 10/31 199 902 156 205 21 902 156 206 21
311.875
5.244
10. MDIA Intermedia Capital Tbk. [S] 190 195 10/23 180 10/03 190 10/31 7,451 524 100 69 22 524 100 69 22
11. MNCN Media Nusantara Citra Tbk. [S] 1,320 1,595 10/26 1,310 10/02 1,560 10/31 22,271 301,246 449,878 63,048 22 427,920 637,182 63,089 22
12. MSKY MNC Sky Vision Tbk. [S] 965 1,030 10/10 950 10/27 965 10/31 1,750 7,517 7,346 475 22 7,517 7,346 476 22
13. SCMA Surya Citra Media Tbk. 2,190 2,230 10/10 2,050 10/04 2,150 10/31 31,436 279,128 597,371 48,911 22 424,470 906,184 48,985 22
14. TMPO Tempo Inti Media Tbk. [S] 232 290 10/26 212 10/03 282 10/31 204 5,946 1,567 304 22 13,946 3,567 305 22
15. VIVA Visi Media Asia Tbk. 256 316 10/26 208 10/17 282 10/31 4,643 164,695 44,413 7,543 22 362,462 95,224 7,566 22
96 HEALTHCARE 51,975 305,432 502,325 57,295 381,908 653,996 57,413
1. MIKA Mitra Keluarga Karyasehat Tbk. [S] 2,030 2,200 10/04 1,840 10/24 1,860 10/31 27,064 210,046 407,552 28,571 22 270,115 521,099 28,656 22
4. SAME Sarana Meditama Metropolitan Tbk. [S] 438 620 10/31 426 10/10 600 10/31 3,540 88,542 42,810 24,188 22 99,583 47,744 24,190 22
3. PRDA Prodia Widyahusada Tbk. [S] 3,570 3,580 10/02 3,040 10/24 3,200 10/31 3,000 2,088 6,692 831 21 5,084
5. SILO Siloam International Hospitals Tbk. [S] 10,000 10,200 10/10 9,275 10/17 9,750 10/31 15,851 4,654 45,249 3,624 22 7,025 68,504 3,647 22
6. SRAJ Sejahteraraya Anugrahjaya Tbk. [S] 200 220 10/31 170 10/05 220 10/31 2,402 102 21 81 17 102 21 81 17
1. ASGR Astra Graphia Tbk. [S] 1,415 1,420 10/06 1,290 10/30 1,330 10/31 1,794 7,118 9,702 665 22 7,123 9,711 666 22
2. ATIC Anabatic Technologies Tbk. [S] 720 785 10/27 720 10/26 735 10/31 1,378 119 87 17 8 119 87 17 8
3. DNET Indoritel Makmur Internasional Tbk. [S] 2,240 2,250 10/30 2,170 10/06 2,240 10/31 31,772 228 510 133 21 1,663 3,869 136 21
4. LMAS Limas Indonesia Makmur Tbk. 67 76 10/05 59 10/12 63 10/31 50 176,454 12,232 60,196 22 222,181 14,519 60,199 22
5
2. BHIT MNC Investama Tbk. 100 106 10/03 97 10/17 98 10/31 4,710 215,522 21,510 9,225 22 247,508 24,498 9,228 22
5. MLPT Multipolar Technology Tbk. [S] 490 700 10/31 470 10/02 695 10/31 1,303 2,252 1,350 673 22 172,252 110,288 677 22
6. MTDL Metrodata Electronics Tbk. [S] 610 620 10/05 585 10/27 595 10/31 1,461 8,068 4,837 620 20 8,068 4,837 623 20
3. BMTR Global Mediacom Tbk. [S] 565 650 10/26 515 10/13 585 10/31 8,306 725,376 423,732 114,037 22 788,121 459,076 114,068 22
4. BNBR Bakrie & Brothers Tbk. 50 50 10/30 50 10/30 50 10/30 5,677 939 47 1,971 19 3,003,837 126,882 2,104 22
28,717 62,304 411,407 143,309 62,318
98 INVESTMENT COMPANY 48,156 4,275,523 2,934,642 176,902 8,448,060 4,296,328 177,226
1. ABMM ABM Investama Tbk. 2,350 2,380 10/24 2,350 10/10 2,380 10/24 6,553 81 190 9 4 7,274 17,165 10
97 COMPUTER AND SERVICES 37,758 194,240
162.000
137.681
173.333
63.487
972.617
94.000
94.000
109.509
215.000
49.231
750.000
110.734
234.789
275.751
105.000
1,967.691
19.800
144.792
1,071.146
63.467
286.592
476.152
1.719
INDONESIASTOCKEXCHANGEIDXMONTHLYSTATISTICS,OCTOBER201736
ResearchandDevelopmentDivision](https://image.slidesharecdn.com/10idxmonthlystatisticsoktober2017-201219125924/85/10-idx-monthly-statistics-oktober-2017-39-320.jpg)
![Table Trading by Industry
Regular Market
Board
Date
Price
Date
Freq.,
xPrev. High Low Close Date
Industry Classification / Stock Name Volume,
th. share
Value,
m. IDR
Days
Days
Freq.,
x
Volume,
th. share
Value,
m. IDR
Market
Cap.,
b. IDR
Index
Total Market
2
1
2
2
2
2
1
2
2
2
2
2
2
1 : Main Board 2 : Development Board [S] : Sharia Compliant Stock ** Delisted
7. SIMA Siwani Makmur Tbk. [S] 390 610 10/25 340 10/04 570 10/31 252 153,965 82,076 36,299 19 206,040 102,913.0403 36,308 19
2. DYAN Dyandra Media International Tbk. [S] 58 61 10/24 56 10/31 59 10/31 252 18,208 1,045 1,587 22 18,208 1,045 1,587 2216.857
5. ITTG Leo Investments Tbk. [S] 82 - - - - 82 04/30/13 113 - - - - - - - -
22
6. MLPL Multipolar Tbk. [S] 172 180 10/04 161 10/23 171 10/31 1,721 435,903 74,867 19,788 22 635,903 112,367 19,793 22
20
8. POOL Pool Advista Indonesia Tbk. 3,300 3,360 10/31 3,210 10/18 3,350 10/31 7,538 692,241 2,250,742 1,524 22 1,037,943 3,362,623 1,655 22
5. BRMS Bumi Resources Minerals Tbk. [S] 59 80 10/24
7. PLAS Polaris Investama Tbk. 50 50 10/31 50 10/31 50 10/31 59 205 10 52 20 205 10 52
56 10/19 64 10/31 3,989 2,198,737 141,339 26,777 22 2,720,745 171,487 26,795
824 21
3. GEMA Gema Grahasarana Tbk. [S] 795 825 10/17 730 10/10 805 10/31 258 3,574 2,851 191 22 6,699 5,351 192 22357.778
247.482
380.000
54.667
9. SRTG Saratoga Investama Sedaya Tbk. [S] 3,290 3,660 10/27 3,210 10/09 3,540 10/31 9,604 6,520 22,206 3,519 22 6,524 22,219 3,521 22
711 522
8,045 22
136,510,539 123,284,010 6,886,844 198,852,391 168,928,554 6,903,568
4. ITMA Sumber Energi Andalan Tbk. [S] 860 920 10/06 800 10/13 860 10/31 585 761 628 569 22 761 628 569 22
6. MFMI Multifiling Mitra Indonesia Tbk. [S] 800 950 10/02 750 10/10 760 10/31 576 119 99 77 15 70,119 56,099 80 18
99 OTHERS 3,583 184,896 87,599 47,384 812,346 191,318 47,605
1.
TOTALTOTALTOTALTOTAL 6,646,654
8. SUGI Sugih Energy Tbk. 50 50 10/31 50 10/31 50 10/31 1,241 7,558 378 7,837 22 509,809 24,760
AKSI Majapahit Inti Corpora Tbk. 406 980 10/06 352 10/20 426 10/30 307 711 522 824 21
64.769
10.079
19.614
11.791
2,126.296
64.364
213.000
72.599
INDONESIASTOCKEXCHANGEIDXMONTHLYSTATISTICS,OCTOBER201737
ResearchandDevelopmentDivision](https://image.slidesharecdn.com/10idxmonthlystatisticsoktober2017-201219125924/85/10-idx-monthly-statistics-oktober-2017-40-320.jpg)

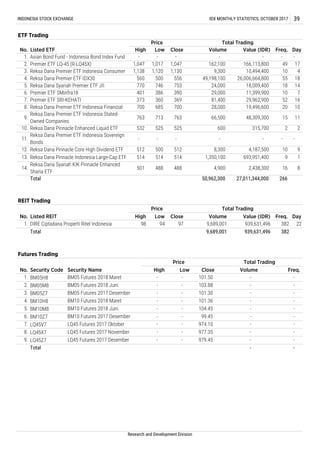
![AGRICULTUREAGRICULTUREAGRICULTUREAGRICULTURE
CROPS
PLANTATION
ANIMAL HUSBANDRY
FISHERY
FORESTRY
MININGMININGMININGMINING
COAL MINING
Bayan Resources Tbk. Sep-17 Dec 12,520 7,013 5,507 9,682 3,802 3,075 2,907 1,163 1,652 9.44 6.64 1.27 32.74 74.44 31.76
14.2211 DSSA Dian Swastatika Sentosa Tbk. [S] Jun-17 Dec 32,386 14,154 18,233 7,254 1,516 1,032 784 2,035 23,662 6.83 0.59 0.78
-245.71
5 BRAU Berau Coal Energy Tbk. **) Dec-14 Dec 22,055 22,576 -521 16,993 -65 -1,056 -1,165 (33) -15 (2.46) (5.49) (43.34) -4.79
0.09 0.16 0.14
10 DOID Delta Dunia Makmur Tbk. Sep-17 Dec 12,123 9,914 2,209 7,535 827 424 424 66 260 13.61 3.48 4.49 4.66 25.59 5.63
9 DEWA Darma Henwa Tbk. [S] Sep-17 Dec 5,235 2,194 3,041 2,562 3 4 3 0.212 139 235.41 0.36 0.72
38.95 54.50 21.97
8 BYAN
-6.21
4 BORN Borneo Lumbung Energi & Metal Tbk. **) Sep-14 Dec 14,499 20,334 -5,835 846 -2,078 -2,078 -2,078 (157) -330 (0.32) (0.15) (3.48)
7 BUMI Bumi Resources Tbk. **) Jun-17 Dec 41,664 73,722 -32,059 208 1,979 1,979 2,161 66 -490 3.93 (0.53) (2.30) 9.50 - 952.68
6 BSSR Baramulti Suksessarana Tbk. [S] Sep-17 Dec 2,945 840 2,104
-25.25
3 ATPK Bara Jaya Internasional Tbk. [S] Sep-17 Dec 1,530 909 622 - -115 -115 -115 (27) 108 (7.27) 1.80 1.46 -10.04 -24.72 -
2 ARII Atlas Resources Tbk [S] Sep-17 Dec 4,535 3,835 699 240 -12 -61 -77 (34) 233 (26.21) 3.86 5.48
16.96
212212212212 1,3781,3781,3781,378 4.854.854.854.85 2.742.742.742.74 1.211.211.211.21
8.05 13.588.71 1.07 0.69
1 DSFI Dharma Samudera Fishing Industries Tbk. [S] Sep-17 Dec 352 194 157 493 10 8 8 6 85 19.36 1.38 1.24 3.19 7.14
357 2,132 5.73 2.17 (0.54)
1 ADRO Adaro Energy Tbk. [S] Sep-17 Dec 92,449 37,643 54,805 32,906 9,542 5,582 5,025 209 1,713
16 UNSP Bakrie Sumatera Plantations Tbk. Jun-17 Dec 14,390 13,667 723 743 -79 -472 -472 (687) 527 (0.27) 0.35 18.91 -6.56 -130.58
-1.78 -11.56
-
3,915 1,161 860 860 438 804 6.00 3.27 0.40
-19.11 -
6.37 11.32
-63.50
1.71
7.69 19.66 22.87
15 TBLA Tunas Baru Lampung Tbk. Jun-17 Dec 13,430 9,505 3,925 4,244 655 505 502 188 735 7.43 1.90 2.42 7.52 25.73 11.90
14 SSMS Sawit Sumbermas Sarana Tbk. [S] Jun-17 Dec 9,271 5,643 3,627 1,559 492 357 355 75 381 20.06 3.93 1.56
2.30 4.23 4.65
13 SMAR SMART Tbk. Sep-17 Dec 25,720 15,024 10,696 25,780 901 615 615 285 3,724 14.02 1.07 1.40 3.19 7.66 2.38
12 SIMP Salim Ivomas Pratama Tbk. [S] Sep-17 Dec 32,982 15,062 17,920 12,233 964 568 406 34 1,133 15.19 0.46 0.84
2.93 5.17 11.73
11 SGRO Sampoerna Agro Tbk. [S] Sep-17 Dec 8,205 4,262 3,943 2,540 336 233 223 157 2,086 15.84 1.19 1.08 3.79 7.89 9.19
10 PALM Provident Agro Tbk. [S] Sep-17 Dec 3,156 1,366 1,790 591 77 69 69 13 251 25.85 1.34 0.76
8.72 10.60 17.89
9 MAGP Multi Agro Gemilang Plantation Tbk. Sep-17 Dec 1,124 370 754 72 -7 -7 -6 -0.958 84 (52.18) 0.60 0.49 -0.78 -1.16 -9.13
8 LSIP PP London Sumatra Indonesia Tbk. [S] Sep-17 Dec 9,787 1,741 8,046 3,575 828 640 640 125 1,179 12.08 1.28 0.22
7 JAWA Jaya Agra Wattie Tbk. Sep-17 Dec 3,358 2,421 937 418 -100 -105 -104 (37) 248 (6.72) 0.99 2.58 -4.15 -14.89 -25.02
6 GZCO Gozco Plantations Tbk. Sep-17 Dec 2,838 1,794 1,044 442 -178 -148 -146 174 (2.22) 0.41 1.72
EPS,
IDR
Annual
605 419 412 52 290 9.25 1.66 1.76 6.58 18.17 10.75
5 GOLL Golden Plantation Tbk. [S] Jun-17 Dec 2,443 1,469 974 102 0.668 0.501 -2 -0.903 266 (125.16) 0.43 1.51
-6.94 -18.88 -33.41
2 ANJT Austindo Nusantara Jaya Tbk. [S] Sep-17 Dec 7,929 2,722 5,207 1,471 840 538 538 214 1,552 5.98 0.82 0.52
1 AALI Astra Agro Lestari Tbk. [S] Sep-17 Dec 24,955 6,957 17,998 12,493 2,021 1,478 1,406 974 9,351 14.96 1.56 0.39
1.1.1.1.
13
14
21
2.2.2.2.
15
P/E
Ratio,
x
Price to
BV,
x
D/E
Ratio,
x
ROA,
%
ROE,
%
NPM,
%Listed Stocks
1 BISI Bisi International Tbk. [S] Sep-17 Dec 2,355 335 2,020 1,463 277 220 220 98 673 16.78 2.44 0.17 12.45 14.52 15.03
81818181 1,2741,2741,2741,274 -3.09-3.09-3.09-3.09 1.331.331.331.33
3 BWPT Eagle High Plantation Tbk. Sep-17 Dec 15,854 9,810 6,044 2,237 -254 -215 -209 (9) 192
FS
Date
Fis-
cal
Year
End Assets
Liabi-
lities Equity Sales EBT
Profit
for the
period
Profit
attr. to
owner's
entity
Book
Value,
IDR
6 85 19.36 1.38
11
2.36
7.89 10.95 11.83
9.05 13.79 36.61
(27.61) 1.27 1.62 -1.81 -4.75 -9.62
4 DSNG Dharma Satya Nusantara Tbk. Sep-17 Dec
2.882.882.882.88
98 673 16.78 2.44 0.17
12 84 1,386 (5.91) 1.25
0.04 0.10 0.49
1.24
8,482 5,411 3,071 3,892
(32)
Financial Data & Ratios
billion IDR
INDONESIASTOCKEXCHANGEIDXMONTHLYSTATISTICS,OCTOBER201740
ResearchandDevelopmentDivision](https://image.slidesharecdn.com/10idxmonthlystatisticsoktober2017-201219125924/85/10-idx-monthly-statistics-oktober-2017-43-320.jpg)
![EPS,
IDR
Annual
P/E
Ratio,
x
Price to
BV,
x
D/E
Ratio,
x
ROA,
%
ROE,
%
NPM,
%Listed Stocks
FS
Date
Fis-
cal
Year
End Assets
Liabi-
lities Equity Sales EBT
Profit
for the
period
Profit
attr. to
owner's
entity
Book
Value,
IDR
Financial Data & Ratios
billion IDR
CRUDE PETROLEUM & NATURAL GAS PRODUCTION
METAL AND MINERAL MINING
LAND / STONE QUARRYING
8 TINS Timah (Persero) Tbk. [S] Sep-17 Dec 11,640 5,751 5,888 6,621 468 301 301 54 791 15.24 1.04 0.98 3.44 6.81 4.54
-3.32 -8.29 -29.778 MITI Mitra Investindo Tbk. [S] Sep-17 Dec 247 148 99 21 -4 -6 -6 (6) 70 (8.33) 0.71 1.49
23 5 611 (17.40) 4.82 0.96
3 258 23.22 0.29 1.18
1.26 2.64 2.46
1 CTTH Citatah Tbk. [S] Sep-17 Dec 692 374 318 158 4 3 3 3 258 23.22 0.29 1.18 0.58 1.27 1.91
9 ZINC Kapuas Prima Coal Tbk. [S] Apr-17 Dec 625 326 299 107 7 3 3 2 59 1,106.54 29.22 1.09
1.79 4.47 7.237 PSAB J Resources Asia Pasifik Tbk. [S] Sep-17 Dec 11,895 7,126 4,768 2,213 215 160 142 7 180 27.55 1.09 1.49
-1.21 -1.44 -4.37
6 MDKA Merdeka Copper Gold Tbk. Sep-17 Dec 4,802 2,518 2,284 - 356 250 249 93 640 25.24 3.67 1.10 6.93 14.57 -
5 INCO Vale Indonesia Tbk. [S] Sep-17 Dec 29,178 4,693 24,485 6,054 -391 -265 -265 (36) 2,464 (82.74) 1.19 0.19
-4.34 -4.47 -64.76
4 DKFT Central Omega Resources Tbk. Sep-17 Dec 2,327 1,170 1,157 - -77 -58 -38 (9) 205 (47.93) 2.12 1.01 -3.32 -6.68 -
3 CKRA Cakra Mineral Tbk. [S] Sep-17 Dec 883 27 856 44 -29 -29 -17 (4) 168 (19.20) 0.51 0.03
-1.44 -2.45 -4.76
2 CITA Cita Mineral Investindo Tbk. Sep-17 Dec 2,503 1,676 827 350 -102 -102 -102 (40) 245 (22.28) 3.67 2.03 -5.45 -16.48 -29.23
1 ANTM Aneka Tambang (Persero) Tbk. [S] *) Sep-17 Dec 30,672 12,642 18,030 6,962 -221 -331 -331 (18) 750 (35.07) 0.86 0.70
-4.15 -9.14 -57.03
10 RUIS Radiant Utama Interinsco Tbk. [S] Sep-17 Dec 999 630 369 844 22 14 14 25 480 8.83 0.46 1.70 1.92 5.19 1.70
9 PKPK Perdana Karya Perkasa Tbk. Sep-17 Dec 144 78 65 8 -9 -4 -4 (10) 109 (7.94) 0.73 1.20
0.44 1.55 9.47
7 MEDC Medco Energi Internasional Tbk. Jun-17 Dec 48,944 36,106 12,838 5,375 1,965 1,110 1,074 161 963 4.90 0.82 2.81 4.53 17.29 20.65
6 ESSA Surya Esa Perkasa Tbk. Sep-17 Dec 10,056 7,220 2,837 348 47 33 37 4 258 39.91 0.69 2.55
2.58 3.93 2.57
5 ENRG Energi Mega Persada Tbk. Jun-17 Dec 12,677 11,416 1,261 2,233 2,738 2,195 1,426 465 205 0.21 0.48 9.05 34.62 348.11 98.30
4 ELSA Elnusa Tbk. [S] Sep-17 Dec 4,413 1,516 2,897 3,321 133 85 86 16 397 19.70 0.78 0.52
0.33 0.48 3.88
3 BIPI Benakat Integra Tbk. Sep-17 Dec 18,449 14,001 4,448 36 434 436 466 17 122 4.94 0.69 3.15 3.15 13.08 1,197.74
2 ARTI Ratu Prabu Energi Tbk. [S] Sep-17 Dec 2,536 799 1,737 163 5 6 2 0.38 222 131.64 0.23 0.46
13.00 23.90 13.71
1 APEX Apexindo Pratama Duta Tbk. Jun-17 Dec 8,725 8,484 241 304,834 -187 -118 -118 (89) 91 (19.99) 19.66 35.23 -2.72 -98.38 -0.04
58 321 21.54 2.52 5.38
25 TOBA Toba Bara Sejahtra Tbk. [S] Sep-17 Dec 4,009 1,829 2,180 2,850 567 391 214 142 1,083 13.37 1.75 0.84
2.09 3.65 27.47
24 TKGA Permata Prima Sakti Tbk. Sep-14 Dec 6,024 5,579 445 632 -346 -283 -272 (359) 440 (5.02) 4.09 12.53 -6.27 -84.75 -44.83
22 SMMT Golden Eagle Energy Tbk. [S] Sep-17 Dec 685 293 392 39 11 11 8 3 124 41.79 1.11 0.75
23 SMRU SMR Utama Tbk. [S] Sep-17 Dec 2,269 1,301 969 604 -43 -22 -22 (2) 77 (215.76) 6.43 1.34 -1.27 -2.97 -3.58
18.22 27.52 20.15
21 PTRO Petrosea Tbk. [S] Jun-17 Dec 5,365 3,049 2,316 1,446 20 35 35 69 2,296 19.32 0.58 1.32 1.32 3.05 2.44
20 PTBA Tambang Batubara Bukit Asam (Persero) Tbk. [S] Sep-17 Dec 19,500 6,590 12,909 13,222 3,726 2,664 2,626 1,519 5,603 7.55 2.05 0.51
48.84 61.55 26.94
19 MYOH Samindo Resources Tbk. [S] Sep-17 Dec 1,866 530 1,336 1,798 157 117 116 70 605 9.45 1.10 0.40 8.34 11.65 6.49
18 MBAP Mitrabara Adiperdana Tbk. [S] Sep-17 Dec 2,020 417 1,603 2,747 988 740 740 804 1,306 4.55 2.80 0.26
16.78 22.99 14.06
17 KKGI Resource Alam Indonesia Tbk. [S] Sep-17 Dec 1,295 163 1,131 727 162 110 112 30 226 11.87 1.57 0.14 11.36 13.00 15.18
16 ITMG Indo Tambangraya Megah Tbk. [S] Jun-17 Dec 16,715 4,515 12,200 9,973 2,119 1,402 1,402 2,482 10,797 8.94 2.06 0.37
-4.47 -5.58 -
15 HRUM Harum Energy Tbk. [S] Sep-17 Dec 5,819 641 5,178 3,218 702 540 440 217 1,915 10.82 1.23 0.12 12.37 13.90 16.78
14 GTBO Garda Tujuh Buana Tbk. Sep-17 Dec 765 151 614 - -26 -26 -26 (14) 246 (18.99) 1.06 0.25
13 GEMS Golden Energy Mines Tbk. [S] Jun-17 Dec 6,315 2,276 4,039 3,728 944 696 683 232 687 10.08 3.41 0.56 22.03 34.45 18.66
12 FIRE Alfa Energi Investama Tbk. *) Sep-17 Dec 430 210 219 87 -5 -4 -4 (4) 169 (388.49) 10.06 0.96 -1.32 -2.59 -4.87
24
22
INDONESIASTOCKEXCHANGEIDXMONTHLYSTATISTICS,OCTOBER201741
ResearchandDevelopmentDivision](https://image.slidesharecdn.com/10idxmonthlystatisticsoktober2017-201219125924/85/10-idx-monthly-statistics-oktober-2017-44-320.jpg)
![EPS,
IDR
Annual
P/E
Ratio,
x
Price to
BV,
x
D/E
Ratio,
x
ROA,
%
ROE,
%
NPM,
%Listed Stocks
FS
Date
Fis-
cal
Year
End Assets
Liabi-
lities Equity Sales EBT
Profit
for the
period
Profit
attr. to
owner's
entity
Book
Value,
IDR
Financial Data & Ratios
billion IDR
OTHERS
BASIC INDUSTRY AND CHEMICALSBASIC INDUSTRY AND CHEMICALSBASIC INDUSTRY AND CHEMICALSBASIC INDUSTRY AND CHEMICALS
CEMENT
CERAMICS, GLASS, PORCELAIN
METAL AND ALLIED PRODUCTS
CHEMICALS
0.72 3.78 4.63 22.11 1.30
Dec 722 442
5,011 1,073 1,073 1,073 54 285 7.59 1.45 1.10 9.06 19.04 21.42
1 ADMG Polychem Indonesia Tbk. [S] Sep-17 Dec 5,117 1,880 3,237 3,684 -107 -80 -75 (26) 832 (9.00) 0.28 0.58 -2.07 -3.28 -2.16
3.24 8.34 3.04
16 TBMS Tembaga Mulia Semanan Tbk. [S] Sep-17 Dec 2,237 1,769
15 PICO Pelangi Indah Canindo Tbk. [S] Sep-17
468 5,964 109 78 78 282 1,274 3.25
0.4517 18 18 41 493 5.39280 578 1.58
8,280 7,516
2 AGII Aneka Gas Industri Tbk. [S] Sep-17 Dec 6,011 3,093 2,841 1,332 104 77 67 29 926 20.12 0.63 1.09 1.72 3.63 5.81
20 1,410 10.50 1.85 0.23
24 425 18.01 1.66 1.61
188 1,475 10.83 1.47 5.20
Sep-17 Dec 1,656 1,108 549 1,484 11 5 5 3 217 1,076.80 13.80 2.02 0.42 1.28 0.36
13 LMSH Lionmesh Prima Tbk. [S] Sep-17 Dec 163 37 127 156 14 10 10 142 1,319 4.44 0.48 0.29 8.35 10.77 6.57
14 NIKL Pelat Timah Nusantara Tbk. [S] *)
-2.61 -5.71 -7.56
12 LION Lion Metal Works Tbk. [S] Sep-17 Dec 655 195 460 255 12 10 10 26 884 29.78 0.88 0.42 2.08 2.96 4.01
11 KRAS Krakatau Steel (Persero) Tbk. [S] Sep-17 Dec 54,247 29,460 24,787 14,031 -1,137 -1,061 -1,013 (70) 1,281 (7.05) 0.38 1.19
4.67 - 77.27
10 JPRS Jaya Pari Steel Tbk. [S] Sep-17 Dec 382 82 299 184 -11 -9 -9 (16) 399 (8.26) 0.34 0.27 -3.19 -4.06 -4.95
9 JKSW Jakarta Kyoei Steel Works Tbk. [S] **) Sep-17 Dec 258 691 -433 12 9 9 9 80 -2,885 1.21 (0.03) (1.60)
2.82 13.86 3.93
8 ISSP Steel Pipe Industry of Indonesia Tbk. Sep-17 Dec 6,045 3,390 2,655 2,711 35 21 21 4 370 43.00 0.45 1.28 0.46 1.04 0.77
7 INAI Indal Aluminium Industry Tbk. [S] Sep-17 Dec 1,318 1,049 268 709 41 28 28 59 424 6.71 0.93 3.91
-9.50 -13.37 -29.23
6 GDST Gunawan Dianjaya Steel Tbk. [S] Sep-17 Dec 1,287 455 832 928 12 3 3 0.513 101 169.52 0.86 0.55 0.33 0.51 0.34
5 CTBN Citra Tubindo Tbk. [S] Sep-17 Dec 2,045 592 1,453 498 -118 -146 -146 (243) 1,815 (19.98) 2.67 0.41
-2.31 -12.99 -1.93
4 BTON Betonjaya Manunggal Tbk. [S] Sep-17 Dec 180 29 150 67 9 7 7 13 209 8.95 0.57 0.20 5.33 6.37 10.77
3 BAJA Saranacentral Bajatama Tbk. Sep-17 Dec 998 821 178 894 -21 -17 -17 (13) 99 (14.67) 1.90 4.62
9.84 38.75 2.16
2 ALMI Alumindo Light Metal Industry Tbk. [S] Sep-17 Dec 2,364 1,983 382 2,548 4 2 2 5 620 43.35 0.37 5.19 0.14 0.86 0.10
1 ALKA Alakasa Industrindo Tbk. [S] Sep-17 Dec 366 273 93 1,251 27 27 27 71 183 4.57 1.77 2.94
-2.06 -10.57 -2.54
7 TOTO Surya Toto Indonesia Tbk. [S] Sep-17 Dec 2,674 993 1,681 1,602 251 188 188 24 163 16.92 2.53 0.59 9.40 14.95 11.77
6 MLIA Mulia Industrindo Tbk. Sep-17 Dec 7,636 6,150 1,486 4,645 -159 -118 -118 (119) 1,123 (5.30) 0.56 4.14
-7.06 - -50.41
5 MARK Mark Dynamics Indonesia Tbk. [S] Sep-17 Dec 205 55 150 178 45 32 32 57 197 21.12 6.06 0.37 21.00 28.68 18.14
3 IKAI Intikeramik Alamasri Industri Tbk. **) Mar-17 Dec 261 327 -66 9 -4 -5 -5 (23) -84 (3.17) (0.87) (4.92)
4 KIAS Keramika Indonesia Assosiasi Tbk. [S] Sep-17 Dec 1,793 347 1,446 594 -74 -74 -71 (6) 97 (15.74) 1.03 0.24 -5.50 -6.82 -12.44
1.44 2.36 2.22
2 ARNA Arwana Citramulia Tbk. [S] Sep-17 Dec 1,544 548 996 1,267 114 85 84 15 136 25.21 2.83 0.55 7.33 11.35 6.70
1 AMFG Asahimas Flat Glass Tbk. [S] Sep-17 Dec 5,878 2,301 3,577 2,856 84 63 63 194 8,241 34.45 0.81 0.64
2.94 4.31 10.76
Sep-17 Dec 27,454 3,326 24,127 10,513 1,788 1,406 1,406
4.15 6.51 7.16
6 WTON Wijaya Karya Beton Tbk. [S] Jun-17 Dec 5,959 3,415 2,544 1,996 180 138 137 31 292 20.84 2.24 1.34 4.63 10.86 6.92
4 SMGR Semen Indonesia (Persero) Tbk. [S] Sep-17 Dec 47,291 17,143 30,148 20,552 2,002 1,471 1,460 328 5,083 33.22 2.14 0.57
-4.46 -11.69 -9.42
6.83 7.77 13.38
5 WSBP Waskita Beton Precast Tbk. [S] Sep-17 Dec 15,796
3 SMCB Holcim Indonesia Tbk. [S] Sep-17 Dec 19,372 11,979 7,392 6,880 -829 -648 -648 (113) 965 (7.32) 0.86 1.62
2 SMBR Semen Baturaja (Persero) Tbk. [S] *) Sep-17 Dec 4,870 1,546 3,324 1,000 153 108 108 14 335 193.03 8.33 0.47
509 6,554 44.07 3.43 0.14
68686868 1,0661,0661,0661,066 18.8218.8218.8218.82 1.631.631.631.63 3.083.083.083.08
137 2,252 48.57 3.07 0.87
1 INTP Indocement Tunggal Prakarsa Tbk. [S]
33
34
32
31
29
3.3.3.3.
ResearchandDevelopmentDivision
INDONESIASTOCKEXCHANGEIDXMONTHLYSTATISTICS,OCTOBER201742](https://image.slidesharecdn.com/10idxmonthlystatisticsoktober2017-201219125924/85/10-idx-monthly-statistics-oktober-2017-45-320.jpg)
![EPS,
IDR
Annual
P/E
Ratio,
x
Price to
BV,
x
D/E
Ratio,
x
ROA,
%
ROE,
%
NPM,
%Listed Stocks
FS
Date
Fis-
cal
Year
End Assets
Liabi-
lities Equity Sales EBT
Profit
for the
period
Profit
attr. to
owner's
entity
Book
Value,
IDR
Financial Data & Ratios
billion IDR
PLASTICS & PACKAGING
ANIMAL FEED
WOOD INDUSTRIES
PULP & PAPER
(16) 540 26.60 1.49 0.80
(34) 634 7.98 1.32 1.24
7 67 19.98 0.82 44.15
7.13 14.61 4.76
2.98 - 3.77
1.11 6.37 13.44 4.45
0.67 1.13 0.92
1.16 -0.03 -0.07 -0.11
56.99 83.08
153 1,893 11.27 1.08 1.69
7 KDSI Kedawung Setia Industrial Tbk. [S] Sep-17 Dec 1,266 810 456 1,640 54 40 40 132 1,126 4.02 0.47 1.78
5 INRU Toba Pulp Lestari Tbk. [S] Sep-17 Dec 4,742 2,543 2,199 1,069 -1 -1 -1 (1) 1,583 (276.50) 0.19
6 KBRI Kertas Basuki Rachmat Indonesia Tbk. Sep-17 Dec 1,210 868 343 127 -62 -77 -77 (12) 39 (4.25) 1.27 2.53 -8.44 -29.84 -60.14
4.22 11.72 2.44
4.22 12.23 5.83
4 INKP Indah Kiat Pulp & Paper Tbk. Sep-17 Dec 98,253 56,467 41,786 30,512 4,089 3,880 3,878 945 7,638 5.58 0.69 1.35 5.26 12.38 12.72
3 FASW Fajar Surya Wisesa Tbk. Sep-17 Dec 9,051 5,928 3,123 4,913 408 286 286 154 1,260 34.07 4.17 1.90
2 DAJK Dwi Aneka Jaya Kemasindo Tbk. Sep-17 Dec 1,309 976 333 15 -60 -60 -60 (32) 133 (1.57) 0.38 2.93 -6.07 -23.84 -391.79
1 ALDO Alkindo Naratama Tbk [S] Sep-17 Dec 464 237 226 521 34 25 11 26 411 23.37 1.46 1.05
1,211 -82 -236 -236 (353) 677 (2.27) 1.18 1.52 -20.69 -52.11 -19.51
4 MAIN Malindo Feedmill Tbk. [S] Sep-17 Dec 4,026 2,270 1,755 4,058 11 3 3 2 784 531.96 1.12 1.29
2 TIRT Tirta Mahakam Resources Tbk. Sep-17 Dec 819 687 131 553 5 5 5 6 130 17.19 0.82 5.23 0.76 4.75 0.85
1 SULI SLJ Global Tbk. **) Sep-17 Dec 1,094 1,081 13 647 21 24 24 8 3 22.77
10 YPAS Yanaprima Hastapersada Tbk. [S] Sep-17 Dec 290 165 125 213 -20 -19 -19 (38) 187 (25.24) 5.20 1.33 -8.85 -20.60 -9.05
9 TRST Trias Sentosa Tbk. [S] Sep-17 Dec 3,282 1,338 1,944 1,782 5 16 16 8 692 50.07 0.56 0.69
8 TALF Tunas Alfin Tbk. Sep-17 Dec 891 133 758 467 16 10 10 10 560 35.27 0.63 0.18 1.52 1.78 2.17
7 IPOL Indopoly Swakarsa Industry Tbk. [S] Sep-17 Dec 3,861 1,726 2,135 1,974 37 23 20 4 331 37.50 0.47 0.81
16.29 19.08 10.48
6 IMPC Impack Pratama Industri Tbk. [S] Sep-17 Dec 2,329 1,076 1,252 807 58 46 45 12 259 79.91 3.84 0.86 2.64 4.91 5.72
5 IGAR Champion Pacific Indonesia Tbk. [S] Sep-17 Dec 506 74 432 590 83 62 44 60 444 6.46 0.88 0.17
0.79 1.42 1.15
-13.88 -32.77 -20.89
4 FPNI Lotte Chemical Titan Tbk. [S] Sep-17 Dec 2,591 1,249 1,342 4,638 27 21 21 5 241 45.54 0.93 0.93 1.06 2.04 0.44
3 BRNA Berlina Tbk. [S] Sep-17 Dec 1,957 1,128 829 975 -254 -204 -189 (258) 846 (4.55) 1.39 1.36
5.70 7.70 3.7710 UNIC Unggul Indah Cahaya Tbk. [S] Sep-17 Dec 2,789 724 2,065 3,167 167 119 128 446 5,388 8.53 0.71 0.35
0.75 1.78 0.99
2 APLI Asiaplast Industries Tbk. [S] Sep-17 Dec 346 90 256 259 12 8 8 7 171 12.43 0.51 0.35 3.04 4.10 3.04
1 AKPI Argha Karya Prima Industry Tbk. [S] Sep-17 Dec 2,682 1,547 1,136 1,535 21 15 15 30 1,670 28.63 0.51 1.36
35
2.02 3.26 2.53
9 TPIA Chandra Asri Petrochemical Tbk. [S] Jun-17 Dec 28,653 12,712 15,942 15,920 3,084 2,320 2,318 1,300 4,470 21.85 6.35 0.80 16.19 29.11 14.57
8 SRSN Indo Acidatama Tbk. [S] Sep-17 Dec 664 252 412 399 14 10 10 2 68 22.42 0.73 0.61
5.23 5.87 6.067 INCI Intanwijaya Internasional Tbk. [S] Sep-17 Dec 292 32 260 189 15 11 11 84 1,436 4.84 0.28 0.12
29.17 33.18 13.71
6 ETWA Eterindo Wahanatama Tbk. Sep-16 Dec 1,206 1,183 23 238 -53 -53 -53 (73) 23 (0.86) 2.69 52.12 -5.87 -311.76 -22.28
5 EKAD Ekadharma International Tbk. [S] Sep-17 Dec 773 122 652 482 86 66 65 124 380 5.41 1.76 0.46
10.86 19.81 12.60
4 DPNS Duta Pertiwi Nusantara Tbk. [S] Sep-17 Dec 302 37 265 82 5 4 5 19 802 19.97 0.48 0.14 1.77 2.02 4.92
3 BRPT Barito Pacific Tbk. [S] Jun-17 Dec 37,466 16,937 20,529 16,142 2,797 2,034 890 127 1,471 15.84 1.37 0.83
Sep-17 Dec 6,367 8,539 -2,172 4,786 -2,252 -2,338 -2,336 (77) -54 (0.65) (0.93) (3.93) -48.97 - -48.862 CPRO Central Proteina Prima Tbk.
2,283 1,376 907
36
37
38
10.57 16.99 5.16
3 JPFA Japfa Comfeed Indonesia Tbk. [S] Sep-17 Dec 20,216 10,639 9,576 21,694 1,343 965 850 99 839 13.85 1.64
1 CPIN Charoen Pokphand Indonesia Tbk. [S] Sep-17 Dec 24,395 9,218 15,177 37,479 2,429 1,934 1,935 157 926 20.98 3.57 0.61
0.10 0.22 0.07
5 SIPD Sierad Produce Tbk. [S] Jun-17 Dec
8 MDKI Emdeki Utama Tbk. [S] Sep-17 Dec 875 108 767 271 57 53 53 39 424 10.04 0.92 0.14 8.06 9.20 19.49
ResearchandDevelopmentDivision
43INDONESIASTOCKEXCHANGEIDXMONTHLYSTATISTICS,OCTOBER2017](https://image.slidesharecdn.com/10idxmonthlystatisticsoktober2017-201219125924/85/10-idx-monthly-statistics-oktober-2017-46-320.jpg)
![EPS,
IDR
Annual
P/E
Ratio,
x
Price to
BV,
x
D/E
Ratio,
x
ROA,
%
ROE,
%
NPM,
%Listed Stocks
FS
Date
Fis-
cal
Year
End Assets
Liabi-
lities Equity Sales EBT
Profit
for the
period
Profit
attr. to
owner's
entity
Book
Value,
IDR
Financial Data & Ratios
billion IDR
OTHERS
MISCELLANEOUS INDUSTRYMISCELLANEOUS INDUSTRYMISCELLANEOUS INDUSTRYMISCELLANEOUS INDUSTRY
MACHINERY AND HEAVY EQUIPMENT
AUTOMOTIVE AND COMPONENTS
TEXTILE, GARMENT
2 BELL Trisula Textile Industries Tbk. [S] Sep-17 Dec 436 226 210 270 23 19 18 16 145 10.76 1.21 1.08 5.94 12.35 7.19
2 GMFI Garuda Maintenance Facility Aero Asia Tbk. [S] Sep-17 Dec 6,139 3,263 2,876 4,190 695 515 3.65 1.13 11.18 23.86 12.29
36 150 12.27 2.92 0.85 12.89 23.80 18.03
515
1 INCF Indo Komoditi Korpora Tbk. Sep-17 Dec 478 332 146 450 9 6 6 5 102 38.72
Jan 299 137 162 107 25 19 19
24 102 15.30
1 AMIN Ateliers Mecaniques D'Indonesie Tbk. [S] Jul-17
12 RICY Ricky Putra Globalindo Tbk. [S] Sep-17 Dec 1,294 881 413 1,092 6 2 -2 (5) 643 (33.33) 0.23 2.14 0.17 0.53 0.15
11 POLY Asia Pacific Fibers Tbk. **) Sep-17 Dec 3,114 15,844 -12,730 3,905 -44 -81 -81 (43) -5,101 (1.60) (0.01) (1.24) -3.45 - -2.06
10 PBRX Pan Brothers Tbk. [S] Sep-17 Dec 7,929 4,756 3,173 5,455 148 112 125 26 490 18.95 0.99 1.50 1.89 4.71 2.06
9 MYTX Asia Pacific Investama Tbk. **) Sep-17 Dec 1,905 2,982 -1,077 1,138 -259 -218 -100 (91) -734 (1.57) (0.19) (2.77) -15.28 - -19.18
8 INDR Indo-Rama Synthetics Tbk. [S] Sep-17 Dec 11,155 7,106 4,049 7,751 44 10 8.13 16.57 6,187 79.07 0.21 1.76 0.13 0.35 0.14
7 HDTX Panasia Indo Resources Tbk. Sep-17 Dec 4,405 3,615 790 1,140 -503 -385 -282 (104) 219 (4.70) 2.23 4.58 -11.64 -64.91 -33.75
6 ESTI Ever Shine Textile Industry Tbk. Sep-17 Dec 825 627 199 354 -25 -19 -19 (13) 99 (7.26) 0.93 3.15 -3.09 -12.85 -5.42
5 ERTX Eratex Djaja Tbk. Sep-17 Dec 794 532 262 717 -7 -7 -7 (8) 204 (18.16) 0.68 2.03 -1.24 -3.75 -1.03
4 CNTX Century Textile Industry (PS) Tbk. Sep-17 Dec 586 577 8 214 -8 -8 -8 (150) 118 (3.61) 4.57 69.79 -1.79 -126.58 -3.68
3 CNTB Century Textile Industry (Seri B) Tbk. Sep-17 Dec 586 577 8 214 -8 -8 -8 (81) 64 (3.10) 3.93 69.79 -1.79 -126.58 -3.68
1 ARGO Argo Pantes Tbk. **) Sep-17 Dec 1,392 2,253 -861 340 -108 -92 -92 (366) -2,566 (2.25) (0.32) (2.62) -8.83 - -27.14
13 SMSM Selamat Sempurna Tbk. [S] Sep-17 Dec 2,378 614 1,764 889 197 149 134 31 306 41.59 4.21 0.35
-13.61 -439.59 -36.76
10 MASA Multistrada Arah Sarana Tbk. [S] Sep-17 -68 -68 (10) 491 (21.77) 0.44 0.80 -1.12 -2.02 -2.43
9
2.03 2.27 1.62 5.30 1.29
LPIN Multi Prima Sejahtera Tbk. Jun-17 Dec
(39) 265 9.67 0.94 8.56
4.18 8.68 7.16
12 PRAS Prima Alloy Steel Universal Tbk. [S] Sep-17 Dec 1,591 854 737 300 19 15 15 29 1,051 8.10 0.23 1.16 1.29 2.79 5.14
11 NIPS Nipress Tbk. Jun-17 Dec 1,828 947 881 534 51 38 38 47 538 9.50 0.82 1.08
8.33 11.23 16.70
Sep-17 Dec 2,407 283 2,124 1,430 117 89 89 182 3,237 7.95 0.45 0.13 4.94 5.60 6.24
7 IMAS Indomobil Sukses Internasional Tbk. Sep-17 Dec 27,178 21,172 6,006 11,362 -364 -485 -519 (250) 2,172 (4.04) 0.47 3.53
Dec 8,134 3,625 4,509 2,812 -64
-2.90 -7.00 -2.37
6 GJTL Gajah Tunggal Tbk. [S] Sep-17 Dec 18,989 13,472 5,517 10,806 -129 -141 -141 (54) 1,583 (12.91) 0.44 2.44 -0.99 -3.40 -1.30
5 GDYR Goodyear Indonesia Tbk. [S] *) Sep-17 Dec 1,731 1,015 716 1,586 -44 -38 -38 (122) 1,747 (17.16) 1.20 1.42
513 497 16 95 -46 -35 -27 (513) 150 (2.47) 8.49 31.29
-2.38 -10.77 -4.27
8 INDS Indospring Tbk. [S]
Dec 291,473 142,563 148,910 150,225 21,523 17,421 14,184 467 3,678 17.13 2.17 0.96 7.97 15.60 11.60
3 KRAH Grand Kartech Tbk. *) Sep-17 Dec
9.55 16.12 10.92
4 BRAM Indo Kordsa Tbk. [S] Sep-17 Dec 4,091 1,228 2,864 2,403 359 257 218 646 6,364 10.53 1.07 0.43 8.37 11.96 10.69
3 BOLT Garuda Metalindo Tbk. [S] Sep-17 Dec 1,174 478 696 770 119 84 83 47 297 23.75 3.76 0.69
9 TKIM Pabrik Kertas Tjiwi Kimia Tbk. Sep-17 Dec 34,528 21,117 13,411 10,558 400 303 303 130 4,308 22.34 0.67 1.57 1.17
3.26 4.54 3.67
37 165 22.16 1.84 1.69
51515151 1,1061,1061,1061,106 4.654.654.654.65 1.701.701.701.70 4.834.834.834.83
23 180 13.79 15.09 2.36
2 AUTO Astra Otoparts Tbk. [S] Sep-17 Dec 14,952 4,211 10,740 9,975 445 366 370 102 2,228 22.83 1.05 0.39
5.17 2.94
46 1,834 5.02 1.98 3.44
1 ASII Astra International Tbk. [S] Sep-17
3.01 2.87
588 413 175 231 7 7 7 9 180 291.76 15.09 2.36 1.54
8 SPMA Suparma Tbk. [S] Sep-17 Dec 2,199 1,060 1,139 1,525 78 60 60 38 539 6.60 0.46 0.93 3.62 6.98 3.91
39
42
43
41
4.4.4.4.
2 KMTR Kirana Megatara Tbk. Sep-17 Dec 3,715 1,955 1,761 9,466 647 391 391 68 229 5.60 1.66 1.11 14.04 29.62 4.13
44
ResearchandDevelopmentDivision
INDONESIASTOCKEXCHANGEIDXMONTHLYSTATISTICS,OCTOBER2017](https://image.slidesharecdn.com/10idxmonthlystatisticsoktober2017-201219125924/85/10-idx-monthly-statistics-oktober-2017-47-320.jpg)
![EPS,
IDR
Annual
P/E
Ratio,
x
Price to
BV,
x
D/E
Ratio,
x
ROA,
%
ROE,
%
NPM,
%Listed Stocks
FS
Date
Fis-
cal
Year
End Assets
Liabi-
lities Equity Sales EBT
Profit
for the
period
Profit
attr. to
owner's
entity
Book
Value,
IDR
Financial Data & Ratios
billion IDR
FOOTWEAR
CABLE
ELECTRONICS
CONSUMER GOODS INDUSTRYCONSUMER GOODS INDUSTRYCONSUMER GOODS INDUSTRYCONSUMER GOODS INDUSTRY
FOOD AND BEVERAGES
15 11 11 8 389 25.41 0.52 0.33
0.860.860.860.86
51 129
228 688 872
6.88
2,591 3,410
6 VOKS Voksel Electric Tbk. [S] Sep-17 Dec 2,027 1,251 776 1,620 170 124 124
5
0.70
1.54 2.05 1.21
6.08
8.15
821 28.50 5.89 0.87
1 AISA Tiga Pilar Sejahtera Food Tbk. [S] Jun-17 Dec 9,788 5,302 4,486 3,300 322 227 191 119 1,394 8.21
1 PTSN Sat Nusapersada Tbk. [S] Sep-17 Dec 916
1.01 0.59
(0.54) (1.99) 5.76 -
1 BATA Sepatu Bata Tbk. [S] Sep-17 Dec 827 244 583 751 54.00 36.96 36.96 38 448
0.92 0.64 2.81 4.62
0.49
3 KBLI
2.12
16
436 4.64
79 79 699 3,221
185 -93Sep-17 Dec
333 19.98
15 STAR Star Petrochem Tbk. [S] *) Sep-17 Dec 613 123
1.18 4.64 10.12
18 UNIT Nusantara Inti Corpora Tbk. [S] Sep-17 Dec 429 184 245 76 0.778 0.525 0.273 5 3,242
124 14 4.00 4.00 9 -153 9.36
366 2,973 (17.40) 0.96 0.98
8 389 25.41 0.52 0.33
1.57 0.42 5.96 8.45 4.92
2 BIMA
1 IKBI Sumi Indo Kabel Tbk. [S] Sep-17 Mar 1,111 246 864 878 -2 -1 -1 (2) 706 (143.00)
21.27 7.65
13.72 21.77 13.27
2.12 3.16 2.07
40 187 7.70 1.64 1.61
23 148 13.98 0.52 (0.79)
92
18.60
1,747 2,149 336 285 285 95
Primarindo Asia Infrastructure Tbk. **)
0.49 0.28 -0.27 -0.34 -0.17
SCCO Supreme Cable Manufacturing & Commerce Tbk. [S] Sep-17 Dec 3,963 1,372 265 207 207 1,342 12,605 6.63 0.71 0.53 6.98 10.67
4 KBLM Kabelindo Murni Tbk. [S] Sep-17 Dec 1,142 375 767 878 25 18 18 22 685 12.49 0.39
2 JECC Jembo Cable Company Tbk. [S] Sep-17 Dec 1,655 1,168 487 1,603 107
3.22
KMI Wire and Cable Tbk. [S] Sep-17 Dec 2,772 1,025
TFCO Tifico Fiber Indonesia Tbk. [S] Sep-17 Dec 4,469 442 4,028 2,145 93 93 93 26 835 38.82 1.20 0.11 2.78 3.08 4.34
17 TRIS Trisula International Tbk. [S] *)
7.14 1.55 2.40 6.38 21.70 4.94
43.15 0.06 0.75 0.16 0.29 0.69
224 349Sep-17 Dec 574 572 20 12 12 15
490 77 5 0.19 0.05 0.01 102 5,288.56 0.67 0.25 0.04 0.05 0.25
14 SSTM Sunson Textile Manufacturer Tbk. [S] *) Jun-17 Dec 624 362 262 157 0.320 -0.641 -0.641 (1) 224 (324.94) 1.59 1.38 -0.21 -0.49 -0.41
13 SRIL Sri Rejeki Isman Tbk. Sep-17 Dec 13,997 8,968 5,029 7,725 726 637 637 46 270 7.96 1.35 1.78 6.07 16.90 8.25
-0.133 BTEK Bumi Teknokultura Unggul Tbk. [S] *) Sep-17 Dec 5,042 3,000 2,042 446 -0.60 -0.60 0.01 0.00 44 696,632.46 3.85 1.47
8.1211 INDF Indofood Sukses Makmur Tbk. [S] Sep-17 Dec 88,244
-0.02 -0.04
3,278 498 5,235 16.48 1.57 0.92 6.52 12.52
33 10 264 9.71 0.36 1.41 1.76 4.23
13.11 20.45
42,280 45,964 53,120 6,125 4,315
4 BUDI Budi Starch & Sweetener Tbk. [S] Sep-17 Dec 2,862 1,673 1,190 1,861 51 38
46
45
44
5.5.5.5. 5,7745,7745,7745,774 11,38811,38811,38811,388 20.7120.7120.7120.71 4.214.214.214.21
7 DLTA Delta Djakarta Tbk. Sep-17 Dec 1,250 195 1,055 1 249 190 189 315 1,318 14.39 3.44 0.19 20.26 24.01 17,334.43
5 CEKA Wilmar Cahaya Indonesia Tbk. [S] Sep-17 Dec 1,312 438 874 3,133 100 75 75 168 1,469 8.31 0.95 0.50
6 CLEO Sariguna Primatirta Tbk. [S] Sep-17 Dec 628 342 286 441 49 38 38 23 130 29.20 5.20 1.20 8.10 17.80 8.65
11.16
10 IIKP Inti Agri Resources Tbk. [S] *) Sep-17 Dec 353 94 259 98 -14 -11 -9 -0.367 8 (561.86) 26.72 0.36 -4.09 -5.57 -11.10
9 ICBP Indofood CBP Sukses Makmur Tbk. [S] Sep-17 Dec 31,113 11,165 19,948 27,430 4,242 3,060 3,042 348 1,711 25.30 5.14 0.56
49.47 128.11 39.44
13 MYOR Mayora Indah Tbk. [S] Sep-17 Dec 13,866 7,134 6,732 14,299 1,267 951 928 55 301 37.05 6.81 1.06 9.14 18.83 6.65
12 MLBI Multi Bintang Indonesia Tbk. Sep-17 Dec 2,482 1,523 958 2,335 1,254 921 921 583 455 24.76 31.71 1.59
9.92 20.93 4.64
15 ROTI Nippon Indosari Corpindo Tbk. [S] Sep-17 Dec 2,969 1,505 1,465 1,825 125 91 97 21 237 60.53 5.36 1.03 4.11 8.32 5.01
14 PSDN Prasidha Aneka Niaga Tbk. [S] Sep-17 Dec 684 360 324 1,097 64,304 51 39 36 225 5.52 0.88 1.11
0.32 0.48 0.2816 SKBM Sekar Bumi Tbk. [S] *) Sep-17 Dec 1,518 516 1,002 1,296 2 4 4 3.00 580 166.43 0.86 0.52
17 SKLT Sekar Laut Tbk. [S] Sep-17 Dec 607 298 309 683 20 16 16 32 448 34.79 2.46 0.96 3.60 7.06 2.40
Sep-17 Dec 1,130 672 458 197 -25 -24 -24 (15) 209 (27.97) 1.97 1.47 -2.87 -7.09 -12.32
7.64 11.46 2.40
8 HOKI Buyung Poetra Sembada Tbk. [S] Sep-17 Dec 532 67 465 900 49 36 36 21 198 15.35 1.60 0.14 9.10 10.40 4.03
2.03
2 ALTO Tri Banyan Tirta Tbk.
INDONESIASTOCKEXCHANGEIDXMONTHLYSTATISTICS,OCTOBER201745
ResearchandDevelopmentDivision](https://image.slidesharecdn.com/10idxmonthlystatisticsoktober2017-201219125924/85/10-idx-monthly-statistics-oktober-2017-48-320.jpg)
![EPS,
IDR
Annual
P/E
Ratio,
x
Price to
BV,
x
D/E
Ratio,
x
ROA,
%
ROE,
%
NPM,
%Listed Stocks
FS
Date
Fis-
cal
Year
End Assets
Liabi-
lities Equity Sales EBT
Profit
for the
period
Profit
attr. to
owner's
entity
Book
Value,
IDR
Financial Data & Ratios
billion IDR
TOBACCO MANUFACTURERS
PHARMACEUTICALS
COSMETICS AND HOUSEHOLD
HOUSEWARE
OTHERS
PROPERTY, REAL ESTATE AND BUILDING CONSTRUCTIONPROPERTY, REAL ESTATE AND BUILDING CONSTRUCTIONPROPERTY, REAL ESTATE AND BUILDING CONSTRUCTIONPROPERTY, REAL ESTATE AND BUILDING CONSTRUCTION
PROPERTY AND REAL ESTATE
2 KINO Kino Indonesia Tbk. [S] Sep-17
18 STTP Siantar Top Tbk. Sep-17 Dec 2,321 982 1,340 2,098 208 167 167 170 1,023 22.46 3.72 0.73 9.57 16.57 7.94
17.70 20.89 18.25
1 GGRM Gudang Garam Tbk. Sep-17 Dec 62,798 22,894 39,903 61,523 7,274 5,419 5,418 3,754 20,739 18.64 3.38 0.57 11.51 18.11 8.81
52 962 5,428 14.71 5.15 0.49
19 ULTJ Ultrajaya Milk Industry & Trading Co. Tbk. [S] Sep-17 Dec 4,916 750 4,165 3,576 861 653 641 74 361 17.65 3.62 0.18
26.75 40.23 12.92
3 RMBA Bentoel Internasional Investama Tbk. Sep-17 Dec 13,827 5,194 8,633 14,208 -718 -811 -811 (30) 237 (13.47) 1.69 0.60 -7.82 -12.52 -5.71
2 HMSP HM Sampoerna Tbk. Sep-17 Dec 46,541 15,589 30,952 72,294 12,393 9,338 9,338 107 266 37.18 14.96 0.50
2.84 3.61 2.34
1 DVLA Darya-Varia Laboratoria Tbk. [S] Sep-17 Dec 1,612 489 1,124 1,215 233 172 172 205 1,003 9.50 1.94 0.43 14.25 20.45 14.19
53 22,325 40,818 6.59 3.96 1.02
4 WIIM Wismilak Inti Makmur Tbk. Sep-17 Dec 1,248 265 983 1,138 37 27 27 17 468 16.48 0.59 0.27
-5.81 -16.72 -8.26
3 KAEF Kimia Farma (Persero) Tbk. [S] Sep-17 Dec 5,683 3,258 2,425 4,302 273 196 192 46 437 60.11 6.34 1.34 4.60 10.79 4.56
2 INAF Indofarma (Persero) Tbk. [S] Sep-17 Dec 1,473 961 512 776 -85 -64 -64 (28) 165 (95.66) 15.99 1.88
14.89 18.22 12.01
5 MERK Merck Tbk. [S] Sep-17 Dec 876 265 610 898 205 151 151 449 1,363 18.75 6.18 0.43 22.98 32.97 16.81
4 KLBF Kalbe Farma Tbk. [S] Sep-17 Dec 16,224 2,961 13,263 15,090 2,385 1,812 1,779 51 283 31.61 5.65 0.22
4.17 6.27 3.04
7 SCPI Merck Sharp Dohme Pharma Tbk. Jun-17 Dec 1,842 1,543 299 1,183 87 65 65 35,983 83,066 0.81 0.35 5.16 7.03 43.32 5.47
6 PYFA Pyridam Farma Tbk. [S] Sep-17 Dec 164 55 109 168 7 5 5 13 204 15.81 0.99 0.50
17.07 18.53 20.48
9 SQBB Taisho Pharmaceutical Indonesia Tbk. [S] Sep-17 Dec 438 120 318 440 184 138 138 19,810 34,287 0.53 0.31 0.38 41.94 57.78 31.29
8 SIDO Industri Jamu dan Farmasi Sido Muncul Tbk. [S] Sep-17 Dec 2,970 233 2,737 1,857 515 380 380 34 182 14.55 2.70 0.09
41.94 57.78 31.29
11 TSPC Tempo Scan Pacific Tbk. [S] Sep-17 Dec 7,042 2,176 4,866 7,034 564 451 441 131 1,081 14.15 1.71 0.45 8.54 12.35 6.41
10 SQBI Taisho Pharmaceutical Indonesia (PS) Tbk. Sep-17 Dec 438 120 318 440 184 138 138 188,885 326,929 2.33 1.35 0.38
3.86 7.58 3.78
3 MBTO Martina Berto Tbk. [S] Sep-17 Dec 761 346 414 505 -26 -26 -26 (33) 387 (4.81) 0.41 0.84 -4.62 -8.47 -5.22
1 ADES Akasha Wira International Tbk. [S] Sep-17 Dec 800 392 408 613 31 23 23 52 691 19.29 1.46 0.96
Dec 3,271 1,288 1,984 2,345 92 69 70 66 1,388 30.42 1.44 0.65 2.82 4.66 2.95
54.28 58.91 1.93
0.40 0.54 0.63
5 TCID Mandom Indonesia Tbk. [S] Sep-17 Dec 2,349 509 1,841 2,077 219 162 162 1,072 9,154 17.96 2.10 0.28 9.17 11.71 7.78
4 MRAT Mustika Ratu Tbk. [S] Sep-17 Dec 505 133 372 236 2 1 1 5 869 42.90 0.23 0.36
136 136 29 301 8.00 0.77 0.93 5.00 9.65 10.70
2 KICI Kedaung Indah Can Tbk. [S] Sep-17 Dec 152 54 97 88 10.86 8.13 8.13 39 352 4.33 0.48 0.56
37.06 108.54 16.75
1 CINT Chitose Internasional Tbk. [S] Sep-17 Dec 456 113 342 264 29 22 21 27 342 12.16 0.98 0.33 6.33 8.43 8.19
6 UNVR Unilever Indonesia Tbk. [S] Sep-17 Dec 18,815 12,391 6,424 31,214 6,993 5,229 5,229 914 842
6.6.6.6. 200200200200 1,0491,0491,0491,049 10.2510.2510.2510.25 1.901.901.901.90 0.920.920.920.92
61 229 1,122 11.53 1.58 0.72
1 APLN Agung Podomoro Land Tbk. [S] Sep-17 Dec 27,474 16,837 10,636 5,459 979 979 541 35 519 7.45 0.50 1.58 4.75 12.27
2 ARMY Armidian Karyatama Tbk. *) Sep-17 Dec 1,707 587 1,121 146 5 5
1 HRTA Hartadinata Abadi Tbk. [S] Sep-17 Dec 1,307 327 980 1,860 128 95 95 27 213 10.72 1.38 0.33 9.67 12.90 5.09
54 346 2,222 26.67
5 0.833 137 292.97 1.78 0.52 0.40 0.61
17.93
1.13 0.83
55 24 350 27.40 0.67 0.71
59 0 0.00 0.00 0.00
7.15 11.16 9.25
4 WOOD Integra Indocabinet Tbk [S] Sep-17 Dec 3,628 1,748 1,879 1,271 189
3 LMPI Langgeng Makmur Industri Tbk. [S] Sep-17 Dec 821 412 410 314 2 2 2 2 406 85.12 0.43 1.00 0.25 0.51 0.50
ResearchandDevelopmentDivision
INDONESIASTOCKEXCHANGEIDXMONTHLYSTATISTICS,OCTOBER201746](https://image.slidesharecdn.com/10idxmonthlystatisticsoktober2017-201219125924/85/10-idx-monthly-statistics-oktober-2017-49-320.jpg)
![EPS,
IDR
Annual
P/E
Ratio,
x
Price to
BV,
x
D/E
Ratio,
x
ROA,
%
ROE,
%
NPM,
%Listed Stocks
FS
Date
Fis-
cal
Year
End Assets
Liabi-
lities Equity Sales EBT
Profit
for the
period
Profit
attr. to
owner's
entity
Book
Value,
IDR
Financial Data & Ratios
billion IDR
3 ASRI Alam Sutera Realty Tbk. [S] Sep-17 Dec 20,391 12,065 8,326 3,170 1,271 1,121 1,116 76 424 5.36 0.96 1.45 7.33 17.95 35.36
5.87 9.38 25.85
5 BCIP Bumi Citra Permai Tbk. [S] Sep-17 Dec 839 474 366 171 68 61 61 57 256 2.30 0.51 1.30 9.73 22.33 35.74
4 BAPA Bekasi Asri Pemula Tbk. [S] Sep-17 Dec 184 69 115 31 8 8 8 16 174 6.06 0.57 0.60
7.14 10.35 44.32
7 BIKA Binakarya Jaya Abadi Tbk. Sep-17 Dec 2,348 1,698 650 366 -54 -54 -23 (52) 1,098 (6.10) 0.29 2.61 -3.04 -10.99 -14.63
6 BEST Bekasi Fajar Industrial Estate Tbk. [S] Sep-17 Dec 5,289 1,640 3,648 639 251 283 283 39 378 7.26 0.75 0.45
0.20 0.29 3.39
9 BKDP Bukit Darmo Property Tbk. [S] Sep-17 Dec 786 269 517 38 -27 -29 -29 (5) 71 (15.90) 1.19 0.52 -4.92 -7.48 -75.70
8 BIPP Bhuwanatala Indah Permai Tbk. [S] Jun-17 Dec 1,728 508 1,220 52 5 2 2 0.897 261 94.76 0.33 0.42
0.75 1.13 11.35
11 BSDE Bumi Serpong Damai Tbk. [S] Sep-17 Dec 43,472 16,820 26,652 5,827 2,471 2,459 2,302 159 1,385 10.78 1.24 0.63 7.54 12.30 42.20
10 BKSL Sentul City Tbk. [S] Sep-17 Dec 14,358 4,805 9,552 715 81 81 83 2 173 71.28 0.83 0.50
-0.90 -2.70 -5.86
13 CTRA Ciputra Development Tbk. [S] Sep-17 Dec 32,072 17,117 14,955 4,348 824 625 566 41 806 29.75 1.50 1.14 2.60 5.57 14.37
12 COWL Cowell Development Tbk. *) Sep-17 Dec 3,550 2,374 1,176 407 0.921 -24 -24 (7) 241 (177.45) 4.80 2.02
0.15 0.26 2.08
15 DILD Intiland Development Tbk. [S] Sep-17 Dec 12,645 6,659 5,985 1,727 163 163 168 22 577 17.96 0.67 1.11 1.71 3.62 9.41
14 DART Duta Anggada Realty Tbk. [S] Sep-17 Dec 6,215 2,680 3,535 336 25 7 7 3 1,125 106.67 0.28 0.76
4.61 4.90 51.55
17 DUTI Duta Pertiwi Tbk. [S] Sep-17 Dec 10,215 2,043 8,171 1,203 381 375 302 218 4,417 24.79 1.22 0.25 4.90 6.12 31.21
16 DMAS Puradelta Lestari Tbk. [S] Sep-17 Dec 7,356 436 6,920 494 265 255 254 7 144 26.71 1.31 0.06
-0.18 -0.40 -2.08
19 EMDE Megapolitan Developments Tbk. [S] Sep-17 Dec 1,726 1,012 714 214 41 33 33 13 213 23.18 1.42 1.42 2.54 6.14 15.40
18 ELTY Bakrieland Development Tbk. Sep-17 Dec 14,189 7,826 6,363 916 -13 -19 -17 -0.532 146 (94.02) 0.34 1.23
0.13 0.16 3.42
22 GAMA Gading Development Tbk. [S] Sep-17 Dec 1,388 293 1,096 40 -0.142 -2 -2 -0.266 109 (187.82) 0.46 0.27 -0.18 -0.23 -4.75
20 FMII Fortune Mate Indonesia Tbk. [S] Sep-17 Dec 790 117 673 23 2 0.793 0.881 0.432 247 1,250.86 2.18 0.17
21 FORZ Forza Land Indonesia Tbk. [S] Sep-17 Dec 521 305 216 265 53 53 52 44 138 17.32 5.56 1.41 13.47 32.43 19.87
6.13 10.88 30.96
24 GPRA Perdana Gapuraprima Tbk. [S] Sep-17 Dec 1,541 518 1,023 263 24 24 19 6 239 23.33 0.57 0.51 2.09 3.15 9.20
23 GMTD Gowa Makassar Tourism Development Tbk. [S] Sep-17 Dec 1,229 537 693 183 57 57 565 7,425 6,823 1.34 1.46 0.77
1.36 1.47 109.79
26 JRPT Jaya Real Property Tbk. [S] Sep-17 Dec 9,123 3,577 5,546 1,613 751 724 722 70 403 12.92 2.24 0.65 10.58 17.40 44.85
25 GWSA Greenwood Sejahtera Tbk. [S] Sep-17 Dec 7,071 514 6,557 66 73 72 74 13 841 9.75 0.15 0.08
3.91 7.48 13.55
28 LAMI Lamicitra Nusantara Tbk. [S] Sep-17 Dec 658 78 580 77 10 10 10 11 505 32.51 0.73 0.13 1.98 2.24 12.60
27 KIJA Kawasan Industri Jababeka Tbk. [S] Jun-17 Dec 11,198 5,347 5,851 1,616 214 219 180 17 281 17.63 1.08 0.91
-0.49 -0.50
30 LPCK Lippo Cikarang Tbk. [S] Jun-17 Dec 6,225 1,669 4,556 842 280 262 262 752 6,545 5.06 0.58 0.37 8.40 11.48 31.07
29 LCGP Eureka Prima Jakarta Tbk. Sep-17 Dec 1,665 49 1,616 6 -6 -6 -6 (2) 287 (65.74) 0.34 0.03
2.57 5.09 12.17
32 MDLN Modernland Realty Tbk. [S] Sep-17 Dec 14,592 7,830 6,763 1,878 294 261 261 28 540 11.86 0.61 1.16 2.39 5.15 13.92
31 LPKR Lippo Karawaci Tbk. [S] Jun-17 Dec 46,802 23,207 23,594 4,937 743 601 487 42 1,022 16.34 0.67 0.98
18.70 28.70 47.87
34 MMLP Mega Manunggal Property Tbk. [S] Sep-17 Dec 4,736 937 3,799 153 82 82 83 19 665 30.07 0.88 0.25 2.31 2.88 53.72
33 MKPI Metropolitan Kentjana Tbk. [S] Sep-17 Dec 6,583 2,294 4,288 1,928 1,044 923 923 1,298 4,522 27.37 7.86 0.54
5.53 8.77 23.60
36 MTSM Metro Realty Tbk. [S] Jun-17 Dec 87 16 72 11 -2 -3 -3 (26) 308 (10.13) 0.87 0.22 -7.05 -8.60 -27.58
35 MTLA Metropolitan Land Tbk. [S] Sep-17 Dec 4,176 1,544 2,631 733 213 173 152 26 344 13.47 1.04 0.59
0.50 0.71 4.45
38 MYRXP Hanson International (Seri B) Tbk. Jun-17 Dec 9,554 3,054 6,500 272 3 2 23 42 5,798 1.20 0.00862 0.47 0.05 0.07 0.80
37 MYRX Hanson International Tbk. [S] Sep-17 Dec 9,815 2,931 6,884 820 37 36 78 1 87 89.41 1.35 0.43
-0.89 -1.40 -11.1439 NIRO Nirvana Development Tbk. Sep-17 Dec 4,624 1,681 2,943 278 -9 -31 -26 (2) 133 (37.66) 0.45 0.57
ResearchandDevelopmentDivision
INDONESIASTOCKEXCHANGEIDXMONTHLYSTATISTICS,OCTOBER201747](https://image.slidesharecdn.com/10idxmonthlystatisticsoktober2017-201219125924/85/10-idx-monthly-statistics-oktober-2017-50-320.jpg)
![EPS,
IDR
Annual
P/E
Ratio,
x
Price to
BV,
x
D/E
Ratio,
x
ROA,
%
ROE,
%
NPM,
%Listed Stocks
FS
Date
Fis-
cal
Year
End Assets
Liabi-
lities Equity Sales EBT
Profit
for the
period
Profit
attr. to
owner's
entity
Book
Value,
IDR
Financial Data & Ratios
billion IDR
BUILDING CONSTRUCTION
INFRASTRUCTURE, UTILITIES & TRANSPORTATIONINFRASTRUCTURE, UTILITIES & TRANSPORTATIONINFRASTRUCTURE, UTILITIES & TRANSPORTATIONINFRASTRUCTURE, UTILITIES & TRANSPORTATION
ENERGY
TOLL ROAD, AIRPORT, HARBOR AND ALLIED PRODUCTS
20 20 5 141 15.75 0.55 1.30 1.51 3.46 2.06
5.82 8.93 9.99
42 PPRO PP Properti Tbk. [S] Sep-17 Dec 11,351 6,562 4,789 1,792 283 283 275 1.37 3.32 7.88 15.79
3 MPOW Megapower Makmur Tbk. Sep-17 Dec 343 199 145 53 12 10 10 16 177 19.66 1.76 1.37 3.78 8.95 18.33
40 OMRE Indonesia Prima Property Tbk. [S] Sep-17 Dec 4,245 219 4,026 122 -57 -56 -56 (43) 2,307 (8.83) 0.16 0.05 -1.75 -1.85 -45.59
6.31 18.33 18.04
44 RBMS Ristia Bintang Mahkotasejati Tbk. [S] Sep-17 Dec 218 42 176 42 15 14 14 57 539 1.64 0.17 0.24 8.61 10.67 33.56
41 PLIN Plaza Indonesia Realty Tbk. [S] Sep-17 Dec 4,511 2,958 1,554 1,184 207 214 203 76 438 51.76 9.03 1.90
43 PWON Pakuwon Jati Tbk. [S] Sep-17 Dec 22,538 10,211 12,327 4,394 1,559 1,542 1,422 39 256 16.01 2.46 0.83 9.12 16.68 35.10
6 78 35.33 2.70
10.82 12.30 62.30
46 RODA Pikko Land Development Tbk. [S] Sep-17 Dec 3,613 849 2,764 246 10 22 0.664 0.065 203 2,058.54 0.66 0.31 0.82 1.07 9.01
45 RDTX Roda Vivatex Tbk. Sep-17 Dec 2,259 271 1,989 294 184 183 183 910 7,398 7.64 0.94 0.14
0.12 0.15 3.57
49 SMRA Summarecon Agung Tbk. [S] Sep-17 Dec 20,987 12,730 8,257 3,994 432 239 119 11 572 93.76 1.81
11 2.97 522 35.37 0.20 0.25 0.64 0.80 4.57
47 SCBD Danayasa Arthatama Tbk. [S] Sep-17 Dec 5,783 1,489 4,294 767 191 172 51 20 1,293 132.09 2.09 0.35
1 ACST Acset Indonusa Tbk. [S] Sep-17 Dec 4,740 3,342 1,398 1,945 114 112 111 212 1,996 13.92 1.48 2.39 3.15
4 DGIK Nusa Konstruksi Enjiniring Tbk. [S] Sep-17 Dec 1,799 1,018 782 985 30
7 MTRA Mitra Pemuda Tbk. [S] Sep-17 Dec 261 128 133 194 13 9 9 14.93 172 17.69 1.53 0.97 4.43 8.72 4.46
5 IDPR Indonesia Pondasi Raya Tbk. [S] Sep-17 Dec 1,797 626 1,171 785 81 78 78 52.18 584 22.23 1.98 0.53
6.28 12.75 7.50
10 PTPP PP (Persero) Tbk. [S] Sep-17 Dec 35,353 22,860 12,493 13,762 1,574 1,118 990 213 2,015 13.39 1.41 1.83 4.22 11.94 8.13
8 NRCA Nusa Raya Cipta Tbk. [S] Sep-17 Dec 2,399 1,217 1,181 1,505 187 113 113 60 473 7.19 0.92 1.03
9 PBSA Paramita Bangun Sarana Tbk. [S] Sep-17 Dec 883 297 586 467 74 64
13 TOTL Total Bangun Persada Tbk. [S] Sep-17 Dec 3,060 2,090 971 1,993 184 181 191 75 285 9.62 2.53 2.15 7.91 24.93 9.11
11 SSIA Surya Semesta Internusa Tbk. [S] Sep-17 Dec 8,902 4,357 4,544 2,356 1,686 1,277 1,229 348 966 1.69 0.61 0.96
2.66 7.57 5.13
15 WSKT Waskita Karya (Persero) Tbk. [S] Sep-17 Dec 87,690 65,735 21,955 28,534 3,249 2,905 2,591 254 1,617 8.33 1.31 2.99 4.42 17.64 10.18
14 WIKA Wijaya Karya (Persero) Tbk. [S] Jun-17 Dec 36,642 23,788 12,855 9,484 540 487 436 97 1,433 20.27 1.37 1.85
1.83
4 PGAS Perusahaan Gas Negara (Persero) Tbk. [S] Sep-17 Dec 85,103 42,653 42,450 29,203 2,557 1,372 1,321 73 1,751 25.32 1.05 1.00 2.15 4.31 4.70
7.7.7.7. 31313131 620620620620 17.2617.2617.2617.26 3.253.253.253.25 1.551.551.551.55
71 25 456 37.42 2.02 0.71
1 KOPI Mitra Energi Persada Tbk. [S] Sep-17 Dec 179 45 134 171 6 3 3 6 192 127.05 3.91 0.34 2.33 3.11
2 LAPD Leyand International Tbk. [S] Sep-17 Dec 695 262 433 95 -67 -67
8.14 16.87 18.83
7 TGRA Terregra Asia Energy Tbk. [S] *) Sep-17 Dec 382 23 359 31 -0.460 -0.308 -0.089 -0.043 131 (11,299.13) 3.72 0.06 -0.11 -0.11 -1.00
5 POWR Cikarang Listrindo Tbk. [S] Sep-17 Dec 17,502 9,050 8,452 5,677 1,412 1,069 1,069 89 525 12.36 2.08 1.07
72 118 752 11.75 1.24 0.82
-40 (13) 109 (3.71) 0.46 0.61 -12.80 -20.56 -70.54
6 JKON Jaya Konstruksi Manggala Pratama Tbk. [S] Sep-17 Dec 4,188 1,988 2,200 2,861 171 104 101 8 135 71.24 4.37 0.90 3.30 6.28 3.63
10.67 5.75
2 ADHI Adhi Karya (Persero) Tbk. [S] Sep-17 Dec 24,432 18,882 5,550 8,715 461 205 205 77 1,559 28.52 1.41 3.40 1.12 4.94 2.36
62 100
1.54
3.96 5.34 22.41
48 SMDM Suryamas Dutamakmur Tbk. [S] Sep-17 Dec 3,116 625 2,491 326 25 15
806 14.60 2.93 1.57
1.52 3.86 5.98
50 TARA Sitara Propertindo Tbk. [S] *) Sep-17 Dec 1,233 179 1,054 32 2 1 0.532 0.070 105 10,426.63 7.02 0.17
6 RAJA Rukun Raharja Tbk. [S] Sep-17 Dec 1,925 661 1,264 1,438 67 36 25 8 310 43.82 1.15 0.52 2.51 3.82 2.52
3 CSIS Cahayasakti Investindo Sukses Tbk. [S] Sep-17 Dec 331 160 172 34 -5 -6
Dec 3,574 2,327 1,246 1,284 151 112 112 34 187 81.10 14.60 1.87 6.28 18.00 8.74
5.51 0.93 -2.34 -4.52 -16.95
64 57 391 29.97 4.35 0.51 9.64 14.52 13.65
19.13 37.48 54.22
12 TOPS Totalindo Eka Persada Tbk. [S] Jun-17
-6 (6) 131 (121.99)
ResearchandDevelopmentDivision
INDONESIASTOCKEXCHANGEIDXMONTHLYSTATISTICS,OCTOBER201748](https://image.slidesharecdn.com/10idxmonthlystatisticsoktober2017-201219125924/85/10-idx-monthly-statistics-oktober-2017-51-320.jpg)
![EPS,
IDR
Annual
P/E
Ratio,
x
Price to
BV,
x
D/E
Ratio,
x
ROA,
%
ROE,
%
NPM,
%Listed Stocks
FS
Date
Fis-
cal
Year
End Assets
Liabi-
lities Equity Sales EBT
Profit
for the
period
Profit
attr. to
owner's
entity
Book
Value,
IDR
Financial Data & Ratios
billion IDR
TELECOMMUNICATION
TRANSPORTATION
1.01 1.04 2.34 4.78 3.42
143 101 54 372 14.45 2.10 1.63
23 SMDR Samudera Indonesia Tbk. [S] Sep-17 Dec
17 PORT Nusantara Pelabuhan Handal Tbk. [S] Sep-17 Dec 1,945 993 952 997 62 34 38 18 338 19.16
17.04 41.29 15.93
3 JSMR Jasa Marga (Persero) Tbk. Jun-17 Dec 65,812 47,954 17,858 4,529 1,436 960 1,016 280 2,460 23.21 2.64 2.69 2.92 10.75 21.20
1 CASS Cardig Aero Services Tbk. [S] Sep-17 Dec 1,894 1,112 782 1,520 338 242 97 62 375 11.27 1.87 1.42
6.80 11.60 24.712 CMNP Citra Marga Nusaphala Persada Tbk. [S] Sep-17 Dec 8,773 3,635 5,138 1,809 575 447 449 179 1,536 7.58 0.88 0.71
5.06 10.10 39.76
1 BTEL Bakrie Telecom Tbk. **) Sep-17 Dec 927 14,555 -13,628 6 -1,019 -969 -969 (35) -371 (1.42) (0.13) (1.07) -139.39 - -16,918.81
5 META Nusantara Infrastructure Tbk. [S] Sep-17 Dec 5,785 2,886 2,899 552 272 220 154 13 190 14.12 1.00 1.00
0.60 1.48 1.41
3 FREN Smartfren Telecom Tbk. Sep-17 Dec 22,368 17,921 4,447 3,319 -2,334 -2,823 -2,823 (36) 43 (1.38) 1.17 4.03 -16.83 -84.65 -85.06
2 EXCL XL Axiata Tbk. [S] Sep-17 Dec 53,193 31,696 21,497 16,903 193 238 238 30 2,011 113.81 1.68 1.47
4 ISAT Indosat Tbk. [S] Jun-17 Dec 49,396 34,919 14,478 15,112 1,215 869 784 289 2,664 20.79 2.25 2.41 3.52 12.01 5.75
18.21 31.37 26.82
1 APOL Arpeni Pratama Ocean Line Tbk. **) Sep-17 Dec 1,205 6,650 -5,445 372 -138 -143 -143 (22) -628 (2.64) (0.09) (1.22) -15.78 - -51.16
5 TLKM Telekomunikasi Indonesia (Persero) Tbk. [S] Sep-17 Dec 190,508 79,937 110,571 97,003 34,641 26,013 17,922 237 1,097 17.00 3.67 0.72
397 304 302 161 1,924 28.32 2.37 0.40
3.00 10.25 5.93
3 BBRM Pelayaran Nasional Bina Buana Raya Tbk. [S] Sep-17 Dec 1,769 880 889 256 -39 -46 -46 (11) 166 (4.41) 0.30 0.99 -3.44 -6.85 -17.83
2 ASSA Adi Sarana Armada Tbk. Sep-17 Dec 3,251 2,300 952 1,234 95 73 73 29 280 7.39 0.76 2.42
2,224 1,697 526 689 112 102 66 12 74 58.50 9.72 3.23 6.10 25.79 14.77
8
BULL Buana Listya Tama Tbk. Dec-16 Dec 3,208 1,883 1,325 689 6 7 7 1 273 103.44 0.51 1.42
6.01 8.42 9.71
5 BLTA Berlian Laju Tanker Tbk. Sep-17 Dec 1,340 651 689 246 44 42 42 2 29 81.50 6.68 0.94 4.21 8.19 17.22
4 BIRD Blue Bird Tbk. [S] Sep-17 Dec 6,746 1,933 4,813 3,131
LEAD Logindo Samudramakmur Tbk. Sep-17 Dec 2,896 1,458 1,438 274 -105 -108 -108 (36) 355 (2.78) 0.28 1.01
9.32 - 29.71
0.20 0.49 0.95
7 CANI Capitol Nusantara Indonesia Tbk. [S] **) Mar-17 Dec 836 876 -40 40 -72 -75 -75 (362) -48 (0.89) (6.76) (22.05) -36.06 - -187.71
6
Dec 1,108 478 630 155 -72 -59 -59 (8) 63 (6.36) 0.79 0.76
-7.95 -36.84 -7.13
9 HITS Humpuss Intermoda Transportasi Tbk. [S] Sep-17 Dec
-4.97 -10.02 -39.43
4 KARW ICTSI Jasa Prima Tbk. **) Sep-17 Dec 337 808 -471 79 24 24 24 53 -803 2.56 (0.17) (1.71)
-7.08 -12.45 -38.02
11 INDX Tanah Laut Tbk. [S] Sep-17 Dec 151 2 149 - -12 -12 -12 (36) 341 (3.28) 0.35 0.01 -10.44 -10.56 -
10 IATA Indonesia Transport & Infrastructure Tbk. [S] Sep-17
GIAA Garuda Indonesia (Persero) Tbk. [S] Sep-17 Dec 50,243 39,408 10,834 41,982 -2,279 -2,994 -2,996 (154) 419 (2.37) 0.87 3.64
12
-13.85 -19.58 -39.68
14 MBSS Mitrabahtera Segara Sejati Tbk. [S] Jun-17 Dec 3,322 749 2,573 442 -53 -53 -51 (58) 1,470 (11.12) 0.44 0.29 -3.18 -4.10 -11.94
13 LRNA Eka Sari Lorena Transport Tbk. [S] Sep-17 Dec 309 90 218 81 -31 -32 -32 -122 624 (0.79) 0.15 0.41
-2.72 -4.37 -9.05
16 NELY Pelayaran Nelly Dwi Putri Tbk. [S] Sep-17 Dec 409 35 373 128 14 13 12 7 159 18.06 0.81 0.09 4.08 4.47 9.74
15 MIRA Mitra International Resources Tbk. [S] Sep-17 Dec 378 143 235 85 -8 -8 -7 (2) 59 (21.16) 0.84 0.61
Rig Tenders Indonesia Tbk. [S] Sep-17 Dec 1,242 410 832 127 -54 -54 -54 (118) 1,366 (1.58) 0.14 0.49 -5.79 -8.65 -42.40
18 PTIS Indo Straits Tbk. Sep-17 Dec 548 348 201 106 -25 -25 -25 (60) 365 (9.95) 1.65 1.73 -6.05 -16.54 -23.54
19 RIGS
25 TAMU Pelayaran Tamarin Samudra Tbk. *) Sep-17 Dec 1,512 749 763 147 -26 -26 -26
1.59 3.08 2.19
-64.71 -
21 SDMU Sidomulyo Selaras Tbk. Sep-17 Dec 411 161 250 79 -11 -11 -11 (13) 220 (23.73) 1.35 0.64 -3.63 -5.96 -14.24
20 SAFE Steady Safe Tbk. **) Sep-17 Dec 10 48 -37 -5 -5 -5 (11) -61 (28.41) (5.03) (1.27)
SHIP Sillo Maritime Perdana Tbk. Sep-17 Dec 2,442 1,512 930 441 162
73 97 1,089 29.76 1.73 1.51
74 (21) 392 3.91 3.54 1.48
(9) 203 (394.24) 18.14 0.98 -2.32 -4.60 -17.89
7.82 20.54 32.51
24 SOCI Soechi Lines Tbk. [S] Jun-17 Dec 7,727 3,676 4,051 865 156 147 147 42 574 6.64 0.48 0.91 3.80 7.25 16.97
22
7,840 3,788 4,052 4,273 159 94 87 36 1,237 7.64 0.22 0.93
ResearchandDevelopmentDivision
INDONESIASTOCKEXCHANGEIDXMONTHLYSTATISTICS,OCTOBER201749](https://image.slidesharecdn.com/10idxmonthlystatisticsoktober2017-201219125924/85/10-idx-monthly-statistics-oktober-2017-52-320.jpg)
![EPS,
IDR
Annual
P/E
Ratio,
x
Price to
BV,
x
D/E
Ratio,
x
ROA,
%
ROE,
%
NPM,
%Listed Stocks
FS
Date
Fis-
cal
Year
End Assets
Liabi-
lities Equity Sales EBT
Profit
for the
period
Profit
attr. to
owner's
entity
Book
Value,
IDR
Financial Data & Ratios
billion IDR
NON BUILDING CONSTRUCTION
FINANCEFINANCEFINANCEFINANCE
BANK
197 18.79 1.12 10.13 0.53 5.88 6.31
4 BABP Bank MNC Internasional Tbk. Sep-17 Dec
-11.75 -53.48 -91.05
27 TMAS Pelayaran Tempuran Emas Tbk. [S] Sep-17 Dec 2,792 1,838 954 1,508 23 -11 -11 (13) 836 (86.82) 1.32 1.93 -0.51 -1.49 -0.70
26 TAXI Express Transindo Utama Tbk. Sep-17 Dec 2,392 1,866 526 232 -295 -211 -211 (131) 245 (0.47) 0.25 3.55
3.21 5.43 -
29 TRAM Trada Maritime Tbk. Sep-17 Dec 1,299 1,252 47 218 -80 -80 -105 (14) 5 (11.35) 33.80 26.52 -8.26 -227.23 -36.97
28 TPMA Trans Power Marine Tbk. [S] Sep-17 Dec 1,557 637 920 366 42 37 38 19 350 9.17 0.50 0.69
47.39 85.18 117.10
31 WINS Wintermar Offshore Marine Tbk. [S] Sep-17 Dec 4,975 2,029 2,946 593 -177 -177 -131 (43) 730 (6.70) 0.40 0.69 -4.74 -8.01 -29.85
30 WEHA WEHA Transportasi Indonesia Tbk. [S] Jun-17 Dec 322 143 179 65 100 76 75 168 202 1.18 0.98 0.80
-25.93 -370.35 -41.37
1 BALI Bali Towerindo Sentra Tbk. [S] Sep-17 Dec 2,413 1,551 862 232 215 161 161 59 237 21.86 5.44 1.80 8.88 24.87 69.37
32 ZBRA Zebra Nusantara Tbk. Sep-16 Dec 18 16 1 8 -4 -3 -3 (5) 1 (9.35) 34.77 13.28
6.76 14.60 10.39
4 INDY Indika Energy Tbk. [S] Jun-17 Dec 25,504 14,943 10,561 6,034 610 628 682 262 2,027 8.59 1.11 1.41 4.92 11.89 10.40
2 BUKK Bukaka Teknik Utama Tbk. [S] Sep-17 Dec 2,982 1,602 1,380 1,454 191 151 151 76 523 17.29 2.53 1.16
3 IBST Inti Bangun Sejahtera Tbk. [S] Sep-17 Dec 5,741 2,131 3,610 558 226 170 170 167 2,672 57.93 3.63 0.59 3.94
1.96 2.40 5.53
6 SUPR Solusi Tunas Pratama Tbk. Sep-17 Dec 13,151 8,680 4,471 1,442 215 139 139 163 3,930 39.83 1.65 1.94 1.41 4.15 9.65
5 OASA Protech Mitra Perkasa Tbk. [S] Sep-17 Dec 63 12 51 17 0.921 0.921 0.921 3 143 197.12 4.74 0.23
22 (13.22) 2.27 0.76
4.17 73.15 26.50
8 TOWR Sarana Menara Nusantara Tbk. [S] Sep-17 Dec 26,809 14,869 11,940 3,978 2,541 1,910 1,910 250 1,170 16.43 3.50 1.25 9.50 21.33 48.01
7 TBIG Tower Bersama Infrastructure Tbk. Jun-17 Dec 24,659 23,253 1,406 1,941 536 514 509 225 310 30.26 21.91 16.53
8.8.8.8. 110110110110 1,0491,0491,0491,049 18.5418.5418.5418.54 2.422.422.422.42 3.743.743.743.74
81 125 1,147 23.66 1.90 5.62
-9.75 -17.14 -
75 134 1,226 41.79 5.20 2.85
9 TRUB Truba Alam Manunggal Engineering Tbk. [S] Sep-17 Dec 613 264 349 - -24 -45 -45 (4)
0.97 4.43 10.89
3 ARTO Bank Artos Indonesia Tbk. Sep-17 Dec 881 742 138 70 -8.85 -8.85 -8.85 -9.88 115 (15.59) 1.34 5.36 -1.34 -8.52 -12.65
1 AGRO Bank Rakyat Indonesia Agroniaga Tbk. Sep-17 Dec 14,027 10,963 3,064 935 139 102 102 8 171 69.87 3.13 3.58
2 AGRS Bank Agris Tbk. Sep-17 Dec 4,149 3,568 581 276 8 8 8 2 110 119.69 2.28 6.14 0.26 1.89 2.98
11,338 9,541 1,797 892 -94 -71 -71 (5) 87 (11.21) 0.60 5.31
-1.01 -7.01 -9.74
12 BBRI Bank Rakyat Indonesia (Persero) Tbk. Sep-17 Dec 1,038,673 880,061 158,612 92,874 24,796 20,540 20,508 1,120 6,430 13.93 2.43 5.55 2.64 17.27 22.12
11 BBNP Bank Nusantara Parahyangan Tbk. Sep-17 Dec 7,914 6,776 1,138 614 -60 -60 -60 (119) 1,681 (12.18) 0.86 5.96
BACA Bank Capital Indonesia Tbk. Sep-17 Dec 15,437 14,050 1,387 969 82 61 61 12
1.15 12.99 13.32
14 BBYB Bank Yudha Bhakti Tbk. Sep-17 Dec 4,681 3,962 718 468 81 59 59 17 153 17.74 1.96 5.52 1.68 10.95 12.61
13 BBTN Bank Tabungan Negara (Persero) Tbk. Sep-17 Dec 231,935 211,345 20,590 15,052 2,579 2,005 2,005 255 1,944 10.82 1.42 10.26
0.77 8.43 8.33
16 BDMN Bank Danamon Indonesia Tbk. Sep-17 Dec 173,679 135,157 38,523 17,826 4,362 3,145 3,034 426 4,019 11.96 1.27 3.51 2.41 10.89 17.64
15 BCIC Bank JTrust Indonesia Tbk. Sep-17 Dec 16,267 14,777 1,490 1,131 94 94 94 4 53 11.18 0.95 9.92
-1.20 -10.48 -15.80
18 BGTG Bank Ganesha Tbk. Sep-17 Dec 4,615 3,504 1,110 287 56 42 42 5 99 18.57 0.95 3.16 1.21 5.04 14.63
17 BEKS Bank Pembangunan Daerah Banten Tbk. Sep-17 Dec 7,042 6,239 803 399 -83 -63 -63 (1) 13 (37.71) 3.99 7.77
1.46 5.63 2.04 14.04 23.42
215 71 736 19.82 1.90 2.77 2.52 9.50 24.89
8 BBKP Bank Bukopin Tbk. Sep-17 Dec 113,224 103,293 9,931 8,252 808 660 659 98 1,093 5.68 0.51
10 BBNI Bank Negara Indonesia (Persero) Tbk. Sep-17 Dec 668,208 547,407 97,307 43,753 12,764 10,248 10,157 734 5,218 10.36
6.27 30.38
0.78 8.86 8.00
9 BBMD Bank Mestika Dharma Tbk. Sep-17 Dec 11,350 8,338 3,012 862 286 215
10.40
3.04 17.62 33.15
7 BBHI Bank Harda Internasional Tbk. Sep-17 Dec 2,303 1,864 439 168 11 8 8 3 109 55.82 1.30 4.24 0.44 2.30 4.52
6 BBCA Bank Central Asia Tbk. Sep-17 Dec 739,883 608,565 127,548 50,833 21,107 16,851 16,842 920 5,173 22.72 4.04 4.77
-0.83 -5.26 -7.94
5
INDONESIASTOCKEXCHANGEIDXMONTHLYSTATISTICS,OCTOBER201750
ResearchandDevelopmentDivision](https://image.slidesharecdn.com/10idxmonthlystatisticsoktober2017-201219125924/85/10-idx-monthly-statistics-oktober-2017-53-320.jpg)
![EPS,
IDR
Annual
P/E
Ratio,
x
Price to
BV,
x
D/E
Ratio,
x
ROA,
%
ROE,
%
NPM,
%Listed Stocks
FS
Date
Fis-
cal
Year
End Assets
Liabi-
lities Equity Sales EBT
Profit
for the
period
Profit
attr. to
owner's
entity
Book
Value,
IDR
Financial Data & Ratios
billion IDR
FINANCIAL INSTITUTION
0.35 0.90 4.09
20 BJBR BPD Jawa Barat dan Banten Tbk. Sep-17 Dec 114,213 98,573 9,973 8,511 1,366 1,071 1,071 149 1,029 16.47 2.38 9.88 1.25 14.32 12.59
19 BINA Bank Ina Perdana Tbk. *) Sep-17 Dec 3,085 1,894 1,191 198 11 8 8 2 211 512.06 4.68 1.59
2.51 17.87 25.83
22 BKSW Bank QNB Indonesia Tbk. Sep-17 Dec 26,500 22,995 3,506 1,292 -603 -453 -453 (36) 206 (6.52) 1.13 6.56 -2.28 -17.22 -35.04
21 BJTM BPD Jawa Timur Tbk. Sep-17 Dec 53,838 46,274 7,563 3,924 1,388 1,014 1,014 91 505 7.62 1.38 6.12
1.06 5.61 13.17
24 BMRI Bank Mandiri (Persero) Tbk. Sep-17 Dec 1,078,703 851,266 163,891 83,005 19,839 15,628 15,069 435 3,512 16.21 2.01 5.19 1.93 12.71 18.83
23 BMAS Bank Maspion Indonesia Tbk. Sep-17 Dec 6,165 5,005 1,160 370 65 49 49 15 261 24.21 1.37 4.31
0.89 4.69 9.05
26 BNGA Bank CIMB Niaga Tbk. Sep-17 Dec 252,131 215,544 36,587 5,783 1,088 817 817 44 1,456 28.33 0.85 5.89 0.43 2.98 14.13
25 BNBA Bank Bumi Arta Tbk. Sep-17 Dec 6,978 5,655 1,323 514 62 47 47 27 573 8.77 0.42 4.27
3.56 17.58 24.32
28 BNLI Bank Permata Tbk. Sep-17 Dec 150,659 129,096 21,564 10,827 908 708 708 34 769 19.13 0.85 5.99 0.63 4.37 6.53
27 BNII Bank Maybank Indonesia Tbk. Sep-17 Dec 7,428 5,925 1,503 815 266 198 198 4 22 77.13 13.70 3.94
0.80 5.41 9.44
30 BSWD Bank of India Indonesia Tbk. Sep-17 Dec 4,472 3,393 1,079 242 -64 -64 -64 (82) 1,036 (21.79) 1.73 3.14 -1.90 -7.87 -26.32
29 BSIM Bank Sinarmas Tbk. Sep-17 Dec 32,128 25,384 4,726 2,032 240 192 192 17 308 53.43 2.92 5.37
2.14 11.62 13.81
32 BVIC Bank Victoria International Tbk. Sep-17 Dec 28,477 24,039 2,883 2,005 212 174 174 27 332 7.50 0.61 8.34 0.81 8.03 8.66
31 BTPN Bank Tabungan Pensiunan Nasional Tbk. Sep-17 Dec 93,788 71,532 17,297 10,918 2,037 1,507 1,367 315 2,962 8.09 0.86 4.14
0.34 1.72 3.93
34 INPC Bank Artha Graha Internasional Tbk. Sep-17 Dec 28,199 23,696 4,503 1,856 101 78 78 7 285 13.14 0.31 5.26 0.37 2.30 4.18
33 DNAR Bank Dinar Indonesia Tbk. Sep-17 Dec 2,324 1,871 454 149 9 6 6 3 202 80.07 1.39 4.12
1.55 14.17 15.75
36 MCOR Bank China Construction Bank Indonesia Tbk. Sep-17 Dec 14,934 12,460 2,474 821 99 74 74 6 149 34.42 1.38 5.04 0.66 3.98 9.00
35 MAYA Bank Mayapada Internasional Tbk. Sep-17 Dec 70,319 62,630 7,689 5,191 957 817 817 201 1,406 18.88 2.70 8.15
1.74 10.36 20.94
38 NAGA Bank Mitraniaga Tbk. Sep-17 Dec 2,430 2,200 230 166 8 6 6 5 141 47.75 1.62 9.57 0.32 3.35 3.47
37 MEGA Bank Mega Tbk. Sep-17 Dec 76,817 63,925 12,892 4,784 1,207 1,002 1,002 194 1,851 15.23 1.59 4.96
1.49 10.43 17.91
40 NOBU Bank Nationalnobu Tbk. Sep-17 Dec 8,099 6,717 1,382 456 29 22 22 7 311 134.74 2.91 4.86 0.36 2.14 4.85
39 NISP Bank OCBC NISP Tbk. Sep-17 Dec 149,763 128,430 21,333 9,320 2,209 1,669 1,669 196 1,859 9.77 1.03 6.02
1.37 7.99 15.29
42 PNBS Bank Panin Dubai Syariah Tbk. [S] Sep-17 Dec 9,333 896 1,236 990 20 15 15 2 121 47.19 0.78 0.73 0.22 1.63 1.52
41 PNBN Bank Pan Indonesia Tbk. Sep-17 Dec 213,111 176,630 36,481 14,301 2,887 2,187 2,098 117 1,515 9.29 0.72 4.84
1.62 7.13 19.47
1 ADMF Adira Dinamika Multi Finance Tbk. Sep-17 Dec 28,256 22,768 5,488 5,466 1,628 1,092 1,092 1,456 5,488 4.86 1.29 4.15 5.15 26.53 19.97
82 122 710 18.51 1.35 3.32
43 SDRA Bank Woori Saudara Indonesia 1906 Tbk. Sep-17 Dec 26,375 20,373 6,002 1,648 407 321 321 66 912 14.54 1.05 3.39
1.80 7.14 11.39
3 BFIN BFI Finance Indonesia Tbk. Sep-17 Dec 15,326 10,436 4,890 2,920 1,055 842 842 70 306 9.95 2.29 2.13 7.33 22.96 28.84
2 BBLD Buana Finance Tbk. Sep-17 Dec 4,479 3,347 1,132 532 81 61 61 49 688 11.40 0.81 2.96
3.15 8.32 20.93
5 CFIN Clipan Finance Indonesia Tbk. Sep-17 Dec 8,894 4,930 3,964 1,013 225 164 164 55 995 5.64 0.31 1.24 2.46 5.53 16.22
4 BPFI Batavia Prosperindo Finance Tbk. Sep-17 Dec 1,510 939 571 170 44 36 36 30 361 16.32 1.36 1.64
14.36 14.50 76.36
8 HDFA Radana Bhaskara Finance Tbk. *) Sep-17 Dec 3,913 3,397 516 625 4 3 3 2 222 122.92 0.95 6.58 0.10 0.77 0.48
6 DEFI Danasupra Erapacific Tbk. Sep-17 Dec 82 0.804 82 12 9 9 9 18 121 39.69 5.75 0.00985
7 FINN First Indo American Leasing Tbk. Sep-17 Dec 1,216 963 253 175 18 13 13 9 136 15.41 1.06 3.81 1.43 6.88 7.45
-8.81 -98.12 295.46
10 IMJS Indomobil Multi Jasa Tbk. Sep-17 Dec 13,140 11,081 2,059 1,988 141 105 106 33 476 8.36 0.58 5.38 1.06 6.78 5.26
9 IBFN Intan Baruprana Finance Tbk. Sep-17 Dec 2,181 1,985 196 -49 -192 -144 -144 (61) 62 (2.97) 2.92 10.14
9.22 15.94 21.1511 MFIN Mandala Multifinance Tbk. Sep-17 Dec 3,172 1,338 1,834 1,036 291 219 219 221 1,384 5.87 0.94 0.73
ResearchandDevelopmentDivision
51INDONESIASTOCKEXCHANGEIDXMONTHLYSTATISTICS,OCTOBER2017](https://image.slidesharecdn.com/10idxmonthlystatisticsoktober2017-201219125924/85/10-idx-monthly-statistics-oktober-2017-54-320.jpg)
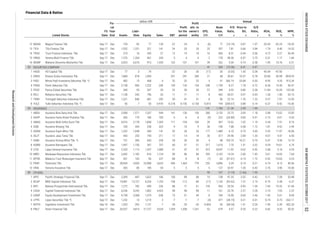
![EPS,
IDR
Annual
P/E
Ratio,
x
Price to
BV,
x
D/E
Ratio,
x
ROA,
%
ROE,
%
NPM,
%Listed Stocks
FS
Date
Fis-
cal
Year
End Assets
Liabi-
lities Equity Sales EBT
Profit
for the
period
Profit
attr. to
owner's
entity
Book
Value,
IDR
Financial Data & Ratios
billion IDR
TRADE, SERVICES & INVESTMENTTRADE, SERVICES & INVESTMENTTRADE, SERVICES & INVESTMENTTRADE, SERVICES & INVESTMENT
WHOLESALE (DURABLE & NON-DURABLE GOODS)
-89.37 -33.10
7 CLPI Colorpak Indonesia Tbk. [S] Sep-17 Dec 542 0.68 0.25
-18.07 -21.16
11 EPMT Enseval Putra Megatrading Tbk. [S] Sep-17 Dec 7,180 2,227 4,954 14,565 444 338 338 166 1,829
(32) 192 (1.54) 0.26
5 BOGA Bintang Oto Global Tbk. [S] Sep-17 Dec 461 58 403 253 7 5 5 2 106 323.38 5.80 0.14 1.57 1.80 2.15
10.47 7.88
8 CMPP Rimau Multi Putra Pratama Tbk. [S] Sep-17 Dec 158
6 CARS Industri dan Perdagangan Bintraco Dharma Tbk. Sep-17 Dec 8,423 6,620 161 143 1,202 8.03 0.96 3.67 3.10 14.50
Sep-17 Dec 2,083 706 1,377
26 SQMI Renuka Coalindo Tbk. [S] **) Sep-17 Dec 6 26
1,250 977 205 3,455 48.76 2.89 2.95 1.92
9.9.9.9. 186186186186 2,5262,5262,5262,526 8.398.398.398.39 2.692.692.692.69 1.431.431.431.43
91 94 890 (2.60) 2.84 2.98
1 AIMS Akbar Indo Makmur Stimec Tbk. [S] Sep-17 Dec 16 0.451 16 1.54 -1.03 -1.05 -1.05 (6) 71 (20.02) 1.79 0.03 -8.71 -8.96
7.57 255.16
10 VICO Victoria Investama Tbk. Sep-17 Dec 29,088 24,148 3,401 518 253 0.215 114 17 372 12.98 0.58 7.10 0.00 0.01 0.04
9 SMMA Sinar Mas Multiartha Tbk. Sep-17 Dec 86,967 64,963 22,003 490 1,338
8 8 10 226 26.79 1.14 0.72
1,803 5,261 263 196
143 16 31 -11
3.73
72 (14.50) 11.61-10 -9 (58) 9.19 -8.77
-
2 AKRA AKR Corporindo Tbk. [S] Sep-17 Dec 16,904 8,255 8,649 13,429 937 1,110 1,018 339 2,159 22.00 3.45 0.95 8.75 17.11 8.26
99 2,101.12 3.30 0.05 0.15 0.16 0.52
12 FISH FKS Multi Agro Tbk. [S] Sep-17 Dec 1,124 370 754 72 -7 -7 -6 (18) 1,570 (128.05) 1.46 0.49
1,009 114 85 85 27 330 8.27 8.47
4.25 6.71
4 BMSR Bintang Mitra Semestaraya Tbk. [S] Sep-17 Dec 534 387 147 1,925 -0.220 -0.398 -0.398 -0.457 127 (194.58) 0.70 2.64 -0.10 -0.36 -0.02
3 APII Arita Prima Indonesia Tbk. [S] Sep-17 Dec 419 176 243 116 11
9.09 2.32
9 CNKO Exploitasi Energi Indonesia Tbk. [S] Sep-17 Dec 5,053 3,336 1,716 1,100 -280 -233 -218 1.94
10 DPUM Dua Putra Utama Makmur Tbk. [S]
14.23 6.22
15 INTA Intraco Penta Tbk. Sep-17 Dec 5,311 4,788 523 1,530 -154 -202 -156 (63) 157 (6.21) 2.47 9.16 -5.08 -51.65 -13.24
14 HEXA Hexindo Adiperkasa Tbk. [S] Sep-17 Mar 3,440 1,583 1,857 2,124 176 132 132 315 2,211 11.03 1.57 0.85
-1.16 -9.13
13 GREN Evergreen Invesco Tbk. *) Sep-16 Dec
6.00 4.3816 INTD Inter Delta Tbk. [S] *) Sep-17 Dec 47 10 37 38 2 2 2 4 62 105.92 6.35 0.27
5.25 2.55
18 KONI Perdana Bangun Pusaka Tbk. Sep-17 Dec 115 101 14 81 -3 -3.37 -3.37 (30) 94 (24.36) 7.68 7.09 -3.90 -31.52 -4.15
17 KOBX Kobexindo Tractors Tbk.
9.83 2.73
20 MDRN Modern Internasional Tbk. Mar-17 Dec 1,569 1,381 188 139 -456 -456 -448 (392) 41 (0.13) 1.22 7.35 -116.27 -970.57 -329.06
19 LTLS Lautan Luas Tbk. [S] Sep-17 Dec 5,706 3,873 1,833 4,942 180 135 106 91 1,175 5.55 0.43 2.11 3.16
12.78 13.96
22 MPMX Mitra Pinasthika Mustika Tbk. Sep-17 Dec 10,176 5,140 5,036 11,919 541 398 363 108 1,128 10.00 0.96 1.02 5.22 10.54 3.34
21 MICE Multi Indocitra Tbk. [S] Sep-17 Dec 880 283 597 410 87 57 57 127 995 3.15 0.40 0.47 8.67
-309.84 -9.43
24 SDPC Millennium Pharmacon International Tbk. [S] Sep-17 Dec 863 711 153 1,561 17 12 12 22 210 5.32 0.55 4.66 1.84 10.40 0.76
23 OKAS Ancora Indonesia Resources Tbk. Sep-17 Dec 2,251 2,210 41 1,006 -110 -95 -57 (43) 23 (10.19) 19.04 54.16 -5.62
- -436.14
27 TGKA Tigaraksa Satria Tbk. [S] Sep-17 Dec 3,098 2,098 1,000 7,360 217 164 154 224 1,089 11.15 2.30 2.10 7.07 21.89 2.23
25 SIAP Sekawan Intipratama Tbk. [S] **) Jun-17 Dec 225 233 -7 1 -6 -6 -6 -0.50 -0.31 (164.68) (269.28) (31.45)
-21 -1.79 -1.79 -1.79 (8) (69) (52.88) (6.06) (1.27) -42.98 -
-5.66
0.14 0.10
29 TMPI Sigmagold Inti Perkasa Tbk. Sep-17 Dec 1,150 183 967 47 0.865 0.865 1 0.329 176 152.16 0.28 0.19 0.10 0.12 1.84
28 TIRA Tira Austenite Tbk. [S] *) Jun-17 Dec 318 154 164 114 0.51 0.12 0.09 0.30 280 707.46 0.75 0.94
-2.26 -21.75
31 TURI Tunas Ridean Tbk. [S] Sep-17 Dec 5,332 2,285 3,047 9,838 413 333 332 79 546 14.50 2.11 0.75 8.32 14.56 3.38
30 TRIL Triwira Insanlestari Tbk. [S] Sep-17 Dec 145 11 135 11 -2 -2.29 -2.28 (3) 112 (19.71) 0.45 0.08
17.05 12.75
33 WAPO Wahana Pronatural Tbk. [S] Mar-17 Dec 110 104 6 33 0.16 0.12 0.12 0.95 11 118.08 10.26 18.37 0.45 8.69 0.37
32 UNTR United Tractors Tbk. [S] Sep-17 Dec 79,697 33,584 46,113 46,258 7,871 5,898 5,638 2,015 12,362 17.20 2.80 0.73 9.87
-2.10
0.07
4.74
7.68
-0.78
-6.14
8.37
2.47
10.19 0.84 0.51 5.47
108 434 432 45 34 34 148 1,416 6.54
Sep-17 Dec 1,120 730 390 603 23 15 15 9 172 13.28 0.70 1.87 1.83
18.05 1.64 0.45 6.27
488 22 467 106 10 0.550 0.550 0.156
INDONESIASTOCKEXCHANGE
ResearchandDevelopmentDivision
IDXMONTHLYSTATISTICS,OCTOBER201753](https://image.slidesharecdn.com/10idxmonthlystatisticsoktober2017-201219125924/85/10-idx-monthly-statistics-oktober-2017-56-320.jpg)
![EPS,
IDR
Annual
P/E
Ratio,
x
Price to
BV,
x
D/E
Ratio,
x
ROA,
%
ROE,
%
NPM,
%Listed Stocks
FS
Date
Fis-
cal
Year
End Assets
Liabi-
lities Equity Sales EBT
Profit
for the
period
Profit
attr. to
owner's
entity
Book
Value,
IDR
Financial Data & Ratios
billion IDR
RETAIL TRADE
TOURISM, RESTAURANT AND HOTEL
1.62 0.21
21.32 12.60
2 AMRT Sumber Alfaria Trijaya Tbk. Sep-17 Dec 21,561 16,377 5,184 45,605 99 48 97 3 125 222.44 5.57 3.16 0.30 1.23 0.10
1 ACES Ace Hardware Indonesia Tbk. [S] Sep-17 Dec 4,110 814 3,296 4,181 651 527 526 41 192 30.66 6.53 0.25
1.82 5.99 0.94
5 DAYA Duta Intidaya Tbk. [S] Sep-17 Dec 235 141 94 253 -4 -5 -5 (3) 45 (60.35) 4.21 1.50 -2.79 -6.97 -1.94
4 CSAP Catur Sentosa Adiprana Tbk. [S] Sep-17 Dec 4,797 3,339 1,458 6,956 84 65 57 19 360 24.93 1.31 2.29
-1.00 -1.09 -1.08
7 ERAA Erajaya Swasembada Tbk. [S] Sep-17 Dec 7,248 3,669 3,579 16,654 317 231 223 102 1,234 7.72 0.64 1.02 4.25 8.60 1.39
6 ECII Electronic City Indonesia Tbk. [S] Sep-17 Dec 1,867 153 1,714 1,297 -14 -14 -14 (14) 1,284 (59.96) 0.65 0.09
-81.12 - -8.96
9 GOLD Visi Telekomunikasi Infrastruktur Tbk. [S] Sep-17 Dec 164 80 84 19 1 0.282 0.281 1 268 448.44 1.99 0.95 0.23 0.44 1.46
8 GLOB Global Teleshop Tbk. **) Sep-17 Dec 67 789 -721 458 -41 -41 -41 (49) -649 (9.25) (0.70) (1.09)
1.21 1.71 0.71
12 KOIN Kokoh Inti Arebama Tbk. [S] Sep-17 Dec 736 626 110 1,167 -5 -11 -11 (15) 112 (19.32) 2.64 5.69 -2.04 -13.67 -0.97
10 HERO Hero Supermarket Tbk. [S] Sep-17 Dec 7,786 2,284 5,503 9,961 77 70 70 22 1,315 49.03 0.84 0.41
11 KIOS Kioson Komersial Indonesia Tbk. [S] Sep-17 Dec 39 11 28 74 -11 -8 -8 (17) 43 (168.62) 66.03 0.38 -28.44 -39.16 -11.20
47.08 103.10 19.94
14 MAPI Mitra Adiperkasa Tbk. Sep-17 Dec 11,094 6,904 4,190 11,684 458 256 248 200 2,524 32.82 2.60 1.65 3.07 8.14 2.19
13 LPPF Matahari Department Store Tbk. [S] Sep-17 Dec 4,262 2,315 1,946 7,547 1,892 1,505 1,505 688 667 12.51 12.89 1.19
1.27 6.82 0.63
16 MKNT Mitra Komunikasi Nusantara Tbk. [S] Sep-17 Dec 842 616 226 4,678 51 37 31 41 226 34.28 6.28 2.73 5.89 21.95 0.80
15 MIDI Midi Utama Indonesia Tbk. Sep-17 Dec 4,740 3,859 881 7,178 54 45 45 21 306 52.80 3.60 4.38
-5.01 -15.03 -2.53
18 RALS Ramayana Lestari Sentosa Tbk. [S] Sep-17 Dec 4,513 1,046 3,467 4,418 429 368 368 69 489 13.24 1.87 0.30 10.87 14.15 8.32
17 MPPA Matahari Putra Prima Tbk. [S] Jun-17 Dec 6,785 4,526 2,260 6,716 -232 -170 -170 (63) 420 (9.18) 1.38 2.00
4.85 7.96 1.66
20 RIMO Rimo International Lestari Tbk. [S] Sep-17 Dec 5,876 667 5,209 247 124 43 118 4 127 163.32 4.95 0.13 0.97 1.09 17.28
19 RANC Supra Boga Lestari Tbk. [S] Sep-17 Dec 743 291 452 1,625 34 27 28 24 289 12.56 1.04 0.64
-4.15 -4.21
22 SONA Sona Topas Tourism Industry Tbk. [S] Sep-17 Dec 1,168 519 649 1,266 87 65 65 261 1,961 7.67 1.02 0.80 7.40 13.31 5.12
21 SKYB Skybee Tbk. [S] Sep-17 Dec 33 0.458 33 - -1.41 -1.04 -1.04 (2) 56 (177.52) 7.45 0.01
4.17 10.80 1.35
24 TRIO Trikomsel Oke Tbk. **) Sep-17 Dec 464 3,996 -3,533 1,540 -133 -133 -129 (7) -136 (302.98) (14.72) (1.13) -38.22 - -8.63
23 TELE Tiphone Mobile Indonesia Tbk. Sep-17 Dec 8,807 5,407 3,400 20,420 385 275 275 50 466 22.21 2.39 1.59
(76.48) 1.13 0.85 -0.89 -1.65 -10.55
3 BAYU Bayu Buana Tbk. [S] Sep-17 Dec 701 312 390 1,337 27 21 21 80 1,103 15.74 1.14 0.80
0.22 0.33 12.89
2 ARTA Arthavest Tbk. [S] Sep-17 Dec 398 64 334 60 4.69 3.61 2.21 7 748 43.91 0.39 0.19 1.21 1.44 5.96
1 AKKU Anugerah Kagum Karya Utama Tbk. Sep-17 Dec 1,165 383 782 15 2 2 2 0.402 121.251 181.54 0.60 0.49
2.56 12.12 3.55
7 HOME Hotel Mandarine Regency Tbk. [S] Sep-17 Dec 269 60 209 47 -0.23 0.02 0.02 0.011 92 10,703.90 1.27 0.29 0.01 0.01 0.04
6 GMCW Grahamas Citrawisata Tbk. Sep-17 Dec 36,471 28,760 7,712 19,768 701 701 701 15,886 131,064 0.05 0.00656 3.73
0.21 0.61 2.01
9 ICON Island Concepts Indonesia Tbk. [S] Sep-17 Dec 448 293 155 71 -2.72 -4 -2 -2 142 (59.22) 0.99 1.89 -1.15 -3.32 -5.46
8 HOTL Saraswati Griya Lestari Tbk. *) Sep-17 Dec 1,079 709 371 85 2.25 1.70 1.73 0.65 104 164.32 1.02 1.91
1.14 1.68 12.1810 INPP Indonesian Paradise Property Tbk. [S] *) Sep-17 Dec 6,127 1,984 4,143 429 52 52 28 3 371 185.22 1.67 0.48
93 57 493 (4.01) 2.41 1.22
94 596 8,604 27.07 3.66 0.78
-3.46 -15.72
5 FAST Fast Food Indonesia Tbk. [S] Sep-17 Dec 2,583 1,348 1,235 3,897 100 105 105 70 619 21.89 2.47 1.09 5.40 11.30 2.68
3.99 7.18 1.57
4 BUVA Bukit Uluwatu Villa Tbk. [S] Sep-17 Dec 3,164 1,458 1,706 200 -21 -21 -19 (7) 501
3 CENT Centratama Telekomunikasi Indonesia Tbk. [S] Sep-17 Dec 4,112 1,075 3,038 501 -89 -79 -79 (3) 97 (27.32) 0.94 0.35 -2.55
17.09
34 WICO Wicaksana Overseas International Tbk. [S] *) Sep-17 Dec 243 113 131 740 3 2 2 2 103 363.84 5.88 0.86 0.87
INDONESIASTOCKEXCHANGEIDXMONTHLYSTATISTICS,OCTOBER201754
ResearchandDevelopmentDivision](https://image.slidesharecdn.com/10idxmonthlystatisticsoktober2017-201219125924/85/10-idx-monthly-statistics-oktober-2017-57-320.jpg)
![EPS,
IDR
Annual
P/E
Ratio,
x
Price to
BV,
x
D/E
Ratio,
x
ROA,
%
ROE,
%
NPM,
%Listed Stocks
FS
Date
Fis-
cal
Year
End Assets
Liabi-
lities Equity Sales EBT
Profit
for the
period
Profit
attr. to
owner's
entity
Book
Value,
IDR
Financial Data & Ratios
billion IDR
ADVERTISING, PRINTING AND MEDIA
HEALTHCARE
11 JGLE Graha Andrasenta Propertindo Tbk. [S] *) Sep-17 Dec 3,949 1,695 2,254 234 -23 -30 -30 (2) 100 (77.23) 1.35 0.75 -1.00 -1.75 -12.67
2.37 3.22 11.82
13 JSPT Jakarta Setiabudi Internasional Tbk. [S] Sep-17 Dec 4,044 1,297 2,748 837 174 138 100 58 1,185 43.35 2.11 0.47 4.56 6.71 16.53
12 JIHD Jakarta International Hotels & Dev. Tbk. [S] *) Sep-17 Dec 6,653 1,755 4,898 1,002 138 118 -12 (7) 2,103 (71.82) 0.23 0.36
0.22 0.29 2.90
16 MAMI Mas Murni Indonesia Tbk. [S] Jun-17 Dec 817 196 621 46 4 3 3 1 148 74.37 0.69 0.32 0.74 0.97 6.59
14 KPIG MNC Land Tbk. [S] *) Sep-17 Dec 13,661 3,033 10,628 787 21 23 1 0.220 1,542 5,860.08 0.84 0.29
15 MABA Marga Abhinaya Abadi Tbk. [S] *) Sep-17 Dec 716 278 439 24 -54 -54 -53 (12) 74 (160.81) 26.08 0.63 -10.07 -16.45 -228.35
0.74 0.97 6.59
21 PANR Panorama Sentrawisata Tbk. [S] Sep-17 Dec 2,466 1,429 1,037 1,467 46 44 27 30 864 19.88 0.70 1.38 2.35 5.60 2.97
17 MAMIP Mas Murni Tbk. (Preferred Stock) Jun-17 Dec 817 196 621 46 4 3 3 957 103,529 0.63 0.01 0.32
20 NASA Ayana Land International Tbk. [S] *) Sep-17 Dec 1,312 224 1,087 11 -12 -12 -8 -0.984 99 (406.67) 4.05 0.21 -1.18 -1.42 -103.03
18 MAPB MAP Boga Adiperkasa Tbk. [S] Sep-17
2.04 4.98 2.14
23 PGLI Pembangunan Graha Lestari Indah Tbk. [S] Sep-17 Dec 69 11 58 19 0.81 0.69 0.65 2 119 85.35 1.27 0.19 1.34 1.59 3.67
22 PDES Destinasi Tirta Nusantara Tbk. [S] Jun-17 Dec 449 265 184 214 6 5 4 12 257 107.08 5.05 1.45
5.92 11.21 18.88
25 PNSE Pudjiadi & Sons Tbk. [S] *) Sep-17 Dec 503 214 290 161 9.86 11.17 3 6 363 214.31 3.44 0.74 2.96 5.14 6.93
24 PJAA Pembangunan Jaya Ancol Tbk. [S] Sep-17 Dec 3,707 1,750 1,957 872 231 165 159 133 1,223 12.13 1.32 0.89
-7.51 -8.42 -56.78
28 PUDP Pudjiadi Prestige Tbk. [S] Sep-17 Dec 542 209 333 85 7 4 4 18 1,010 26.77 0.48 0.63 1.09 1.77 5.19
26 PSKT Red Planet Indonesia Tbk. [S] Sep-17 Dec 492 53 438 49 -28 -28 -28 -4 42 (14.02) 1.18 0.12
27 PTSP Pioneerindo Gourmet International Tbk. [S] Sep-17 Dec 285 142 143 391 10 8 6 37 646 188.45 10.83 1.00 3.76 7.51 2.06
-1.53 -2.54 -17.42
1 ABBA Mahaka Media Tbk. Sep-17 Dec 448 296 151 195 -4 -2 -2 (1) 55 (43.78) 0.91 1.96 -0.70 -2.08 -1.21
29 SHID Hotel Sahid Jaya International Tbk. [S] Sep-17 Dec 1,539 610 929 101 -18 -18 -18 -21 830 (67.87) 1.73 0.66
0.42 0.51 0.72
3 EMTK Elang Mahkota Teknologi Tbk. *) Sep-17 Dec 22,058 4,268 17,790 6,107 812 464 101 24 3,154 343.64 2.60 0.24 2.80 3.48 7.60
2 BLTZ Graha Layar Prima Tbk. [S] Sep-17 Dec 1,343 228 1,115 593 -2 4 4 13 2,552 830.74 4.23 0.20
-2.82 -5.46 -2.31
6 KBLV First Media Tbk. [S] Sep-17 Dec 12,427 6,204 6,223 744 -1,201 -1,159 -845 (647) 3,572 (1.23) 0.22 1.00 -12.44 -24.83 -155.75
4 FORU Fortune Indonesia Tbk. Sep-17 Dec 236 114 122 216 -4 -5 -5 (14) 263 (13.49) 0.74 0.93
5 JTPE Jasuindo Tiga Perkasa Tbk. [S] Sep-17 Dec 1,390 843 547 568 57 41 36 28 320 10.97 0.96 1.54 3.98 10.10 7.30
17.81 22.37 29.55
8 LPLI Star Pacific Tbk. Sep-17 Dec 1,925 320 1,605 67 -164 -163 -163 (186) 1,371 (0.91) 0.12 0.20 -11.30 -13.56 -243.45
7 LINK Link Net Tbk. [S] Sep-17 Dec 5,541 1,128 4,413 2,505 984 740 740 324 1,450 15.38 3.44 0.26
14.14 21.54 33.58
10 MDIA Intermedia Capital Tbk. [S] Jun-17 Dec 3,263 884 2,379 1,031 375 276 277 14 61 13.47 3.13 0.37 16.89 23.17 26.72
9 MARI Mahaka Radio Integra Tbk. Sep-17 Dec 281 96 184 89 40 30 30 77 351 15.75 3.46 0.52
11.03 16.59 22.31
12 MSKY MNC Sky Vision Tbk. [S] Sep-17 Dec 5,192 2,916 2,275 1,880 -385 -287 -287 (211) 1,255 (4.57) 0.77 1.28 -7.37 -16.83 -15.28
11 MNCN Media Nusantara Citra Tbk. [S] Sep-17 Dec 14,510 4,856 9,654 5,382 1,834 1,201 1,122 105 676 14.89 2.31 0.50
25.97 31.39 32.11
14 TMPO Tempo Inti Media Tbk. [S] Sep-17 Dec 385 246 140 216 5 4 4 7 193 42.44 1.46 1.76 1.25 3.44 1.67
13 SCMA Surya Citra Media Tbk. Sep-17 Dec 5,648 976 4,672 3,425 1,487 1,100 1,094 100 320 21.56 6.73 0.21
6.74 17.21 18.33
1 MIKA Mitra Keluarga Karyasehat Tbk. [S] Sep-17 Dec 4,204 513 3,691 1,847 684 543 522 48 254 38.91 7.33 0.14 17.21 19.60 29.38
15 VIVA Visi Media Asia Tbk. Jun-17 Dec 7,231 4,398 2,833 1,330 356 244 217 26 172 10.68 1.64 1.55
95 (23) 1,051 4.97 1.86 0.83
96 17 574 41.22 3.16 0.07
Dec 1,402 458 944 1,364 83 55 55 34 435 60.06 4.69 0.49 5.26 7.81 4.06
19 MINA Sanurhasta Mitra Tbk. [S] *) Sep-17 Dec 125 3 122 8 -0.758 0.172 0.172 0.175 93 14,368.97 27.04 0.03 0.18 0.19 2.16
INDONESIASTOCKEXCHANGEIDXMONTHLYSTATISTICS,OCTOBER201755
ResearchandDevelopmentDivision](https://image.slidesharecdn.com/10idxmonthlystatisticsoktober2017-201219125924/85/10-idx-monthly-statistics-oktober-2017-58-320.jpg)
![EPS,
IDR
Annual
P/E
Ratio,
x
Price to
BV,
x
D/E
Ratio,
x
ROA,
%
ROE,
%
NPM,
%Listed Stocks
FS
Date
Fis-
cal
Year
End Assets
Liabi-
lities Equity Sales EBT
Profit
for the
period
Profit
attr. to
owner's
entity
Book
Value,
IDR
Financial Data & Ratios
billion IDR
COMPUTER AND SERVICES
INVESTMENT COMPANY
OTHERS
Note:Note:Note:Note: *) These companies are excluded from the average PER computation
**) These companies with negative equities are not computed for ROE
Dec 1,856 553 1,304 1,042 119 99 99 141 1,391 22.75 2.30 0.42 7.10 10.12 9.49
7 SIMA Siwani Makmur Tbk. [S] Sep-17 Dec 39 12 27 2.82 -0.83 -0.87 -0.87 -3 62 (217.87) 9.21 0.43
-3.84 -7.82 -7.262 DYAN Dyandra Media International Tbk. [S] Sep-17 Dec 1,512 769 742 599 -46 -44 -37 (11) 174 (5.14) 0.34 1.04
5 ITTG Leo Investments Tbk. [S] Sep-17 Dec 96 4 92 - -2 -2 -2 (2) 67 (38.05) 1.23 0.04 -3.09 -3.22 -
-61.76 - -249.80
5 SILO Siloam International Hospitals Tbk. [S] Sep-17 Dec 4,520 1,323 3,197 4,292 133 70 63 52 1,966 189.06 4.96 0.41 2.07 2.92 1.63
2 OCAP Onix Capital Tbk. **) Sep-17 Dec 67 196 -129 12 -31 -31 -31 (151) -473 (2.84) (0.91) (1.52)
4 SAME Sarana Meditama Metropolitan Tbk. [S] Sep-17 Dec 1,524 606 919 570 76 71 71 16 156 37.33 3.85 0.66 6.22 10.32 12.48
3 PRDA Prodia Widyahusada Tbk. [S] Sep-17
-2.94 -3.80 -10.32
1 ASGR Astra Graphia Tbk. [S] Sep-17 Dec 2,091 853 1,237 2,026 189 136 136 135 917 9.87 1.45 0.69 8.69 14.68 6.72
47 555 24.73 1.64 1.41
6 SRAJ Sejahteraraya Anugrahjaya Tbk. [S] Sep-17 Dec 2,166 489 1,677 463 -53 -48 -48 (6) 154 (37.88) 1.43 0.29
1.64 6.48 1.17
3 DNET Indoritel Makmur Internasional Tbk. [S] *) Sep-17 Dec 8,590 325 8,264 40 32 32 47 4 583 511.36 3.84 0.04 0.49 0.51 80.31
2 ATIC Anabatic Technologies Tbk. [S] Sep-17 Dec 2,991 2,232 759 3,149 54 37 13 9 405 77.42 1.82 2.94
1.82 6.88 4.26
5 MLPT Multipolar Technology Tbk. [S] Jun-17 Dec 1,715 901 814 849 44 33 39 42 434 16.68 1.60 1.11 3.84 8.09 3.87
4 LMAS Limas Indonesia Makmur Tbk. Sep-17 Dec 420 309 111 134 8 6 3 5 141 12.64 0.45 2.78
8.19 15.65 3.37
1 ABMM ABM Investama Tbk. Jun-17 Dec 14,091 11,648 2,443 4,400 320 335 353 257 887 9.28 2.68 4.77 4.76 27.43 7.62
98 179 1,346 15.94 1.71 0.90
6 MTDL Metrodata Electronics Tbk. [S] Sep-17 Dec 3,978 1,897 2,080 7,239 293 244 155 84 847 7.05 0.70 0.91
1.69 3.89 7.04
3 BMTR Global Mediacom Tbk. [S] Sep-17 Dec 27,466 13,562 13,904 8,190 1,451 915 480 45 979 12.97 0.60 0.98 4.44 8.78 11.17
2 BHIT MNC Investama Tbk. Sep-17 Dec 56,420 31,822 24,597 10,178 1,188 717 84 2 512 42.07 0.19 1.29
-16.24 - -48.97
5 BRMS Bumi Resources Minerals Tbk. [S] Sep-17 Dec 13,517 3,261 10,255 67 -540 -1,482 -1,304 (28) 165 (2.29) 0.39 0.32 -14.62 -19.27 -2,197
4 BNBR Bakrie & Brothers Tbk. **) Sep-17 Dec 6,907 12,513 -5,606 1,718 (857.45) (841.02) (842.99) (10) -49 (5.05) (1.01) (2.23)
2.00
-2.90 -8.69 -4.56
7 PLAS Polaris Investama Tbk. Sep-17 Dec 326 132 193 32 -12 -12 -12 (14) 163 (3.64) 0.31 0.68 -4.89 -8.23 -37.46
6 MLPL Multipolar Tbk. [S] Jun-17 Dec 27,032 18,007 9,025 8,604 -378 -392 -323 (64) 897 (2.66) 0.19 2.00
0.25 12.90 16.09 85.25
8 POOL Pool Advista Indonesia Tbk. Sep-17 Dec 741 23 719 26 65 65 65 38 319 87.29 10.49 0.03
99 (64) 897 (2.66) 0.19
-0.24 -0.67 -
97
8 SUGI Sugih Energy Tbk. Sep-17
3 GEMA Gema Grahasarana Tbk. [S] Sep-17 Dec 751 355 396 590 15 13 13 56 1,238 14.40 0.65 0.89 2.37 4.49 2.26
1 AKSI
Average PER
Weighted Average PER
Average PBV
Weighted Average PBV
12.9212.9212.9212.92
13.7813.7813.7813.78
2.512.512.512.51
2.782.782.782.78
17 17 30 258 25.15 2.95 0.19 9.85 11.71 21.02
4 ITMA Sumber Energi Andalan Tbk. [S] Mar-17 Mar 1,767 4 1,763 2 546 546 546 803 2,592 1.07 0.33 0.002
Dec 6,539 4,207 2,333 3.49 -12 -12 -0.63 94 (79.85) 0.53 1.80
30.91 30.99 30,338
6 MFMI Multifiling Mitra Indonesia Tbk. [S] Sep-17 Dec 232 37 195 82 23
-2.94 -4.23 (30.84)
Majapahit Inti Corpora Tbk. Sep-17 Dec 115 38 78 59 9.43 9 9 17 108 24.40 3.95 0.48
11.65 12.02 250.78
9 SRTG Saratoga Investama Sedaya Tbk. [S] Sep-17 Dec 27,887 5,539 22,348
10.90 16.19 16.08
3,164 2,715 2,697 2,812 1,382 8,237 2.56 0.43
INDONESIASTOCKEXCHANGEIDXMONTHLYSTATISTICS,OCTOBER201756
ResearchandDevelopmentDivision](https://image.slidesharecdn.com/10idxmonthlystatisticsoktober2017-201219125924/85/10-idx-monthly-statistics-oktober-2017-59-320.jpg)

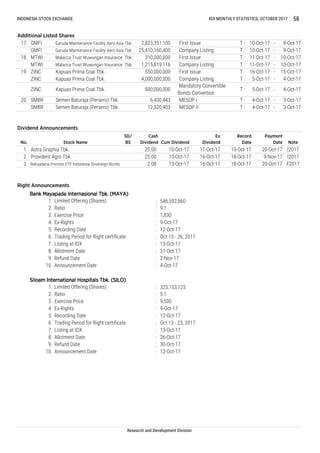
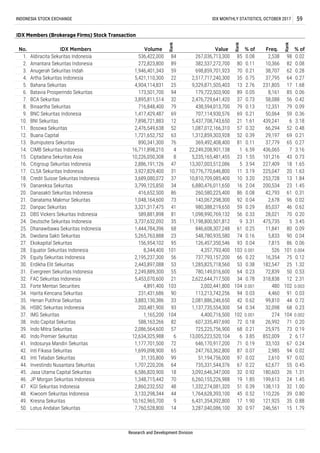
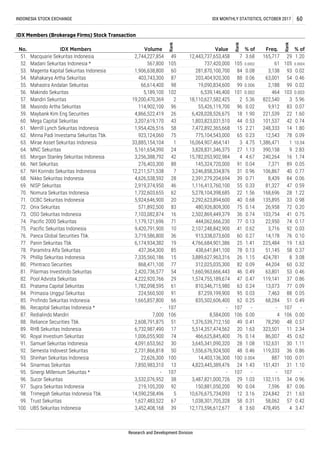

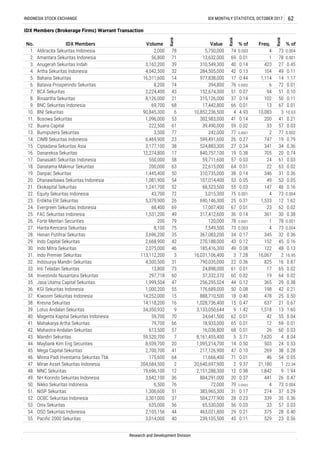

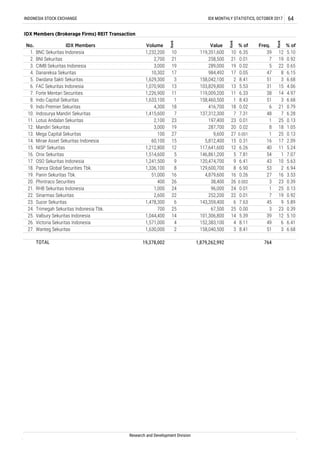
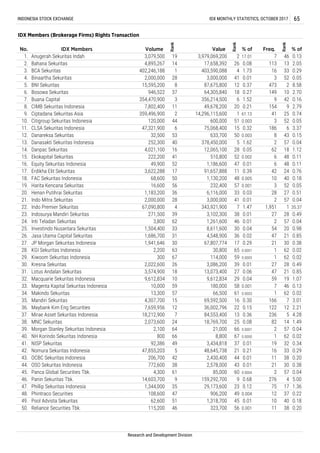
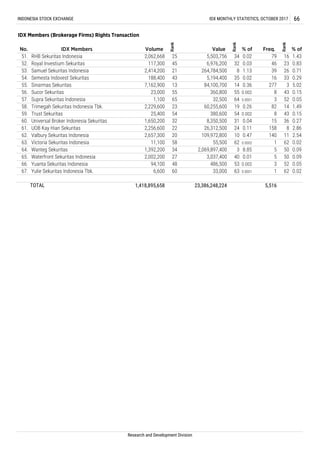
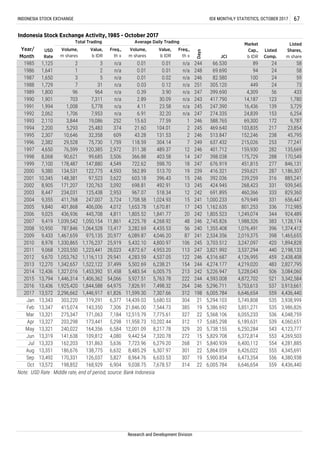
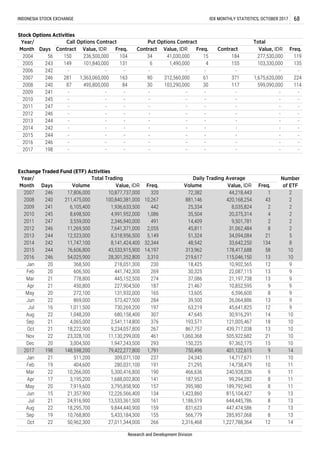

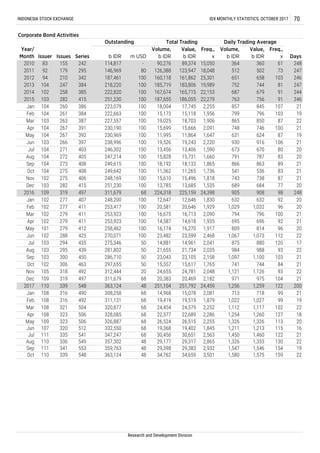
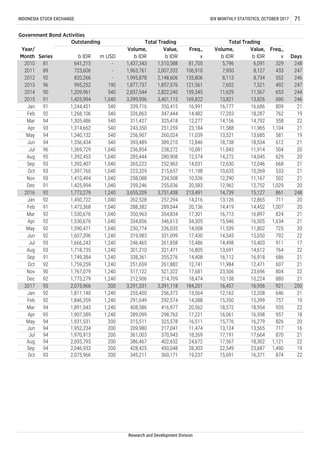
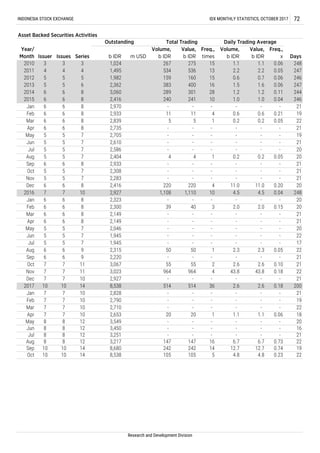
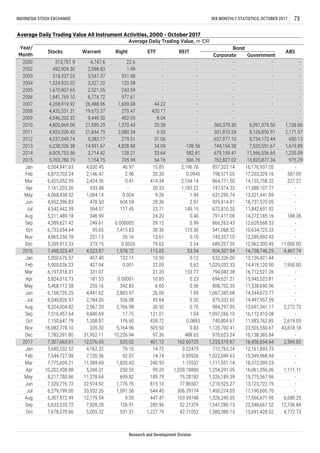
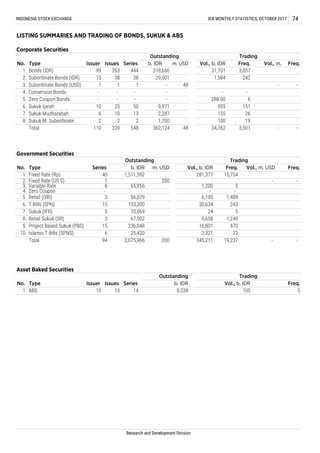
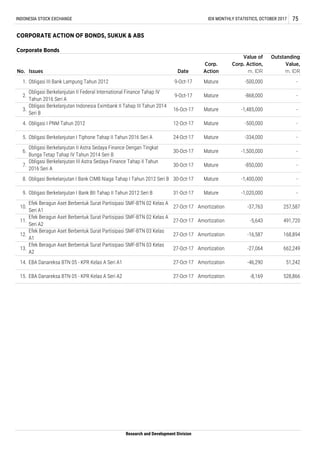


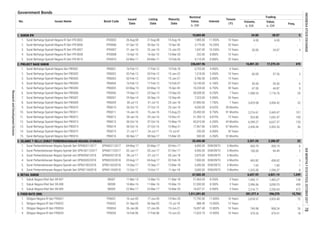
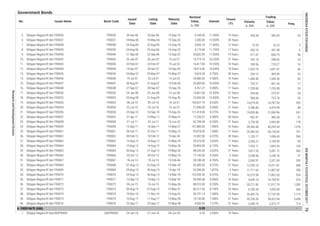
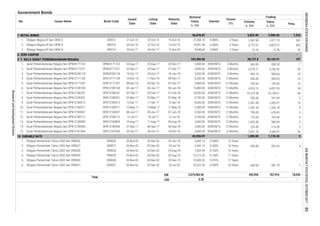
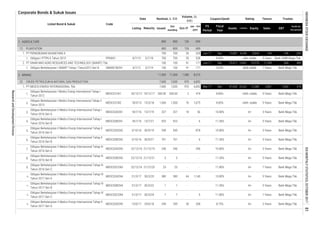
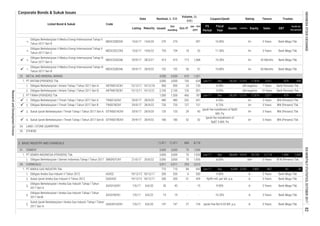
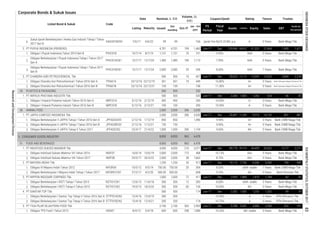
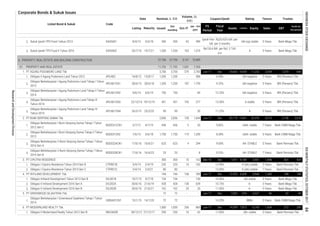

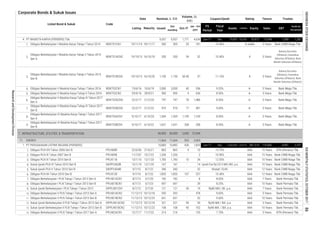
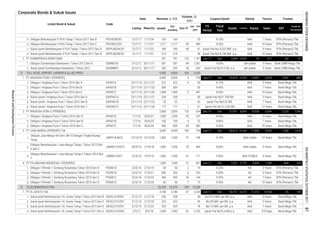

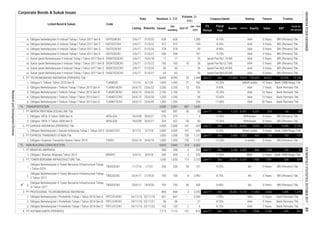
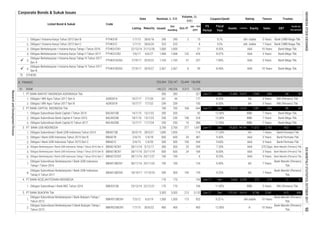
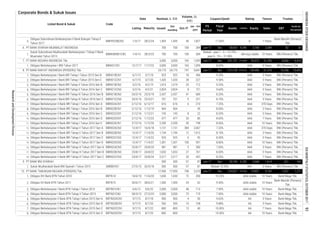

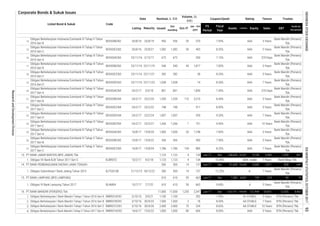

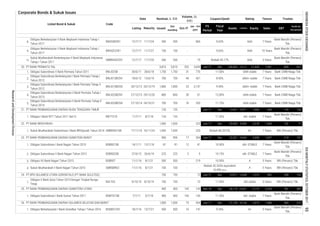
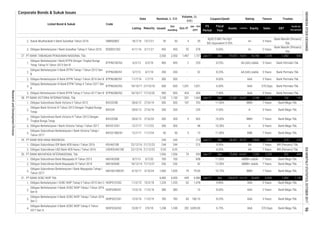

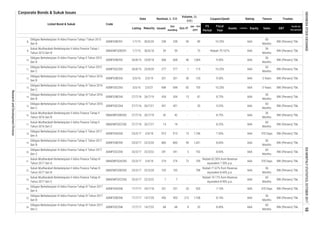
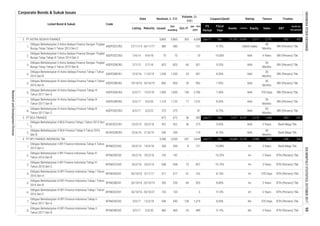

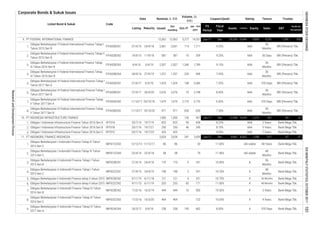
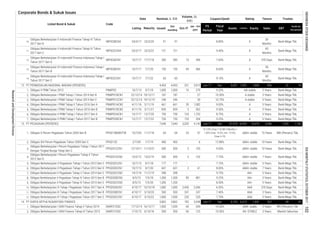
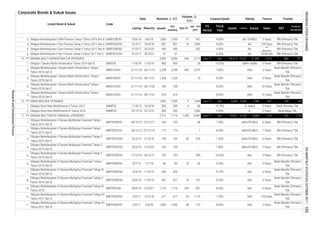
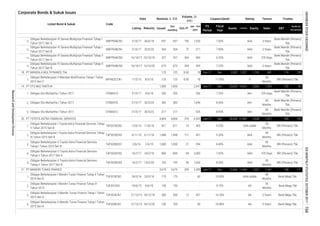
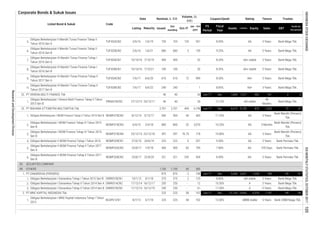
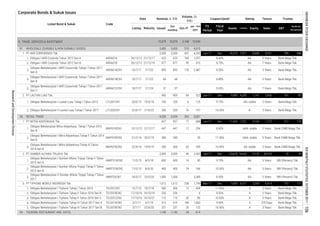
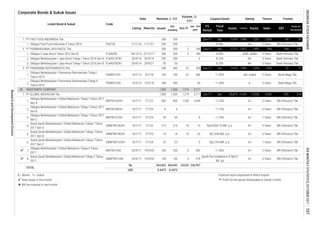
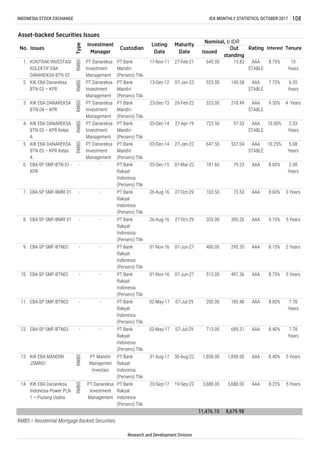
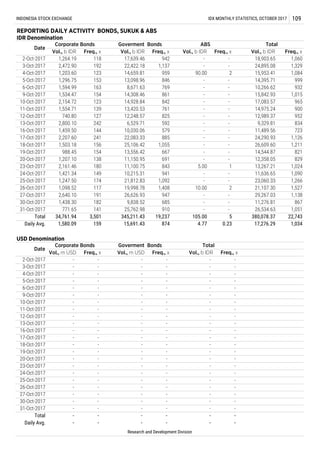
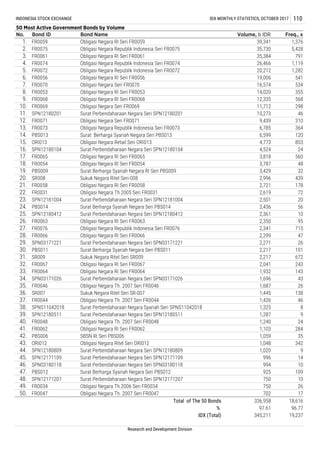
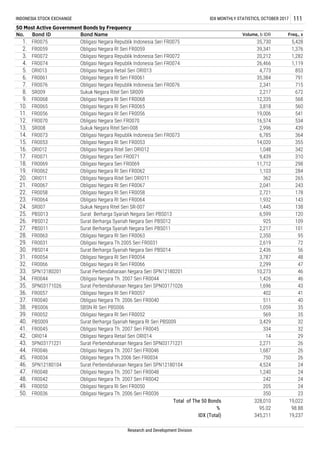
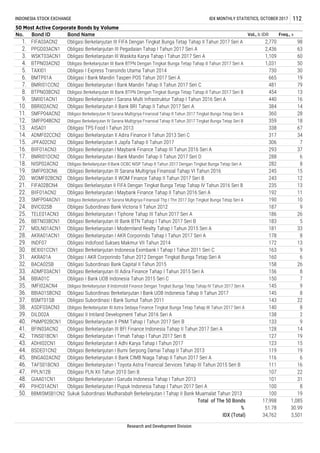
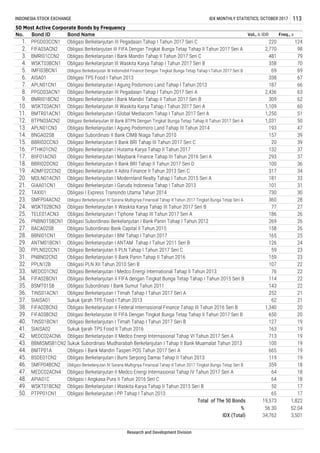
![Notes
1. Trading Volume, Value and Frequency: Figures of trading volume, value and Frequency are calculated
once, except on the IDX’ members trading data. Trading Frequency refers to number of transaction.
2. Number of shares (number of issued shares): This figures is number of listed shares after adjustment
when bonus and rights issues, share splits and consolidations are made.
3. Number of listed shares: This figures refers to the total number of shares that is already listed and can
be traded at the exchange.
4. Market Capitalization: This figures indicates the aggregate number of shares multiplied by regular
market closing price.
5. Jakarta Composite Index 100X
ValueBase
Shares)ofNumber*PriceClosing(Regular
Shares)ofNumber*Price(BaseValueBase
6. Individual Index 100X
PriceBase
PriceClosingRegular
7. To calculate the Jakarta Composite Index and Stock Individual Index, Base Price and Base Value are
adjusted when bonus and rights issues, share splits and consolidations are made. Base price for new
listed companies is IPO price.
8. To calculate Financial Ratio, the latest financial reports are used.
Earning Per Share (EPS): The figure of EPS is derived by dividing Profit for the period
attribute to owner’s entity by number of issued shares. We annualized the EPS when
interim reports are used (see the Financial statement dates and Financial Year Ends).
Price Earnings Ratio (PER)
EPS
PriceClosingRegular
Book Value per Share (BV): The figure of BV is derived by dividing the Total
Shareholders’ Equity by number of issued shares.
Price to Book Value (PBV)
BV
PriceClosingRegular
Debt Equity Ratio (DER)
Equity
sLiabilitieTotal
Return On Asset (ROA) 100X
AssetsTotal
periodtheforProfit
Return On Equity (ROE) 100X
Equity
periodtheforProfit
Net Profit Margin (NPM) 100X
SalesTotal
periodtheforProfit
9. [S] Sharia Compliant Stock
10. LHS: Left Hand Side
11. RHS: Right Hand Side](https://image.slidesharecdn.com/10idxmonthlystatisticsoktober2017-201219125924/85/10-idx-monthly-statistics-oktober-2017-117-320.jpg)

The document provides an overview and statistics about stock trading on the Indonesia Stock Exchange (IDX) in October 2017. It includes information on index values and movements, trading volumes and values by type of investor and market, most active stocks, industry classifications, and other market data. The IDX Composite Index closed at 5,882.787 on October 31, representing a 1.78% increase for the month. Total trading value on the IDX in October was IDR147.262 trillion, an increase of 9.51% compared to the previous month.


