Download to read offline


![20
DATA SERVICES | INDONESIA STOCK EXCHANGE
IDX MONTHLY STATISTICS, JULY 2020
0
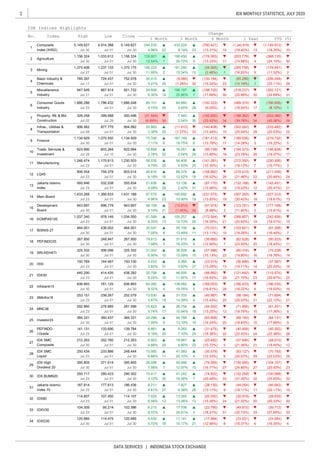
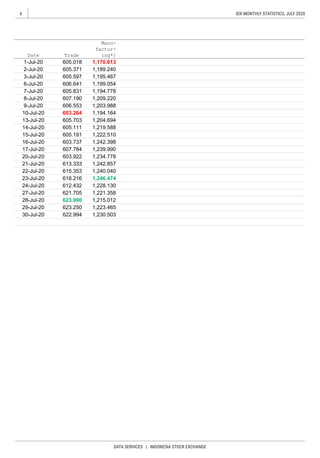
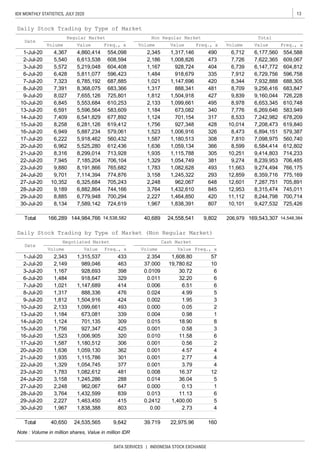
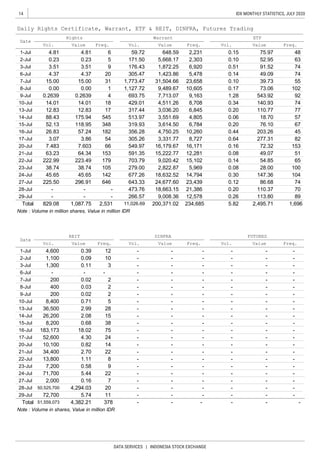
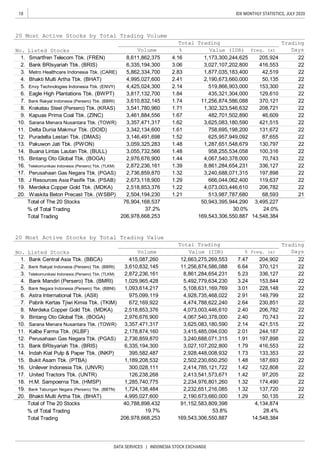
Note: the closing price of the last month is an IPO price if the company listed in this month
* Adjusted price if there are any corporate actions
68 68 50 1.00 -18 -26.47
5,125 5,125 3,790 1.00 -1,335 -26.05
19.
20.
Mahaka Radio Integra Tbk. (MARI)
Duta Pertiwi Tbk. [S] (DUTI)
107 107 78 1.00 -29 -27.10
100 100 73 1.00 -27 -27.00
166 166 119 1.00 -47 -28.31
505 505 366 1.00 -139 -27.52
870 870 615 1.00 -255 -29.31
5,900 5,900 4,190 1.00 -1,710 -28.98
155 155 108 1.00 -47 -30.32
5,800 5,800 4,100 1.00 -1,700 -29.31
185 185 124 1.00 -61 -32.97
112 112 77 1.00 -35 -31.25
1,490 1,490 990 1.00 -500 -33.56
430 430 288 1.00 -142 -33.02
160 160 104 1.00 -56 -35.00
368 368 240 1.00 -128 -34.78
1,440 1,440 845 1.00 -595 -41.32
90 90 54 1.00 -36 -40.00
198 198 76 1.00 -122 -61.62
545 545 270 1.00 -275 -50.46
Sitara Propertindo Tbk. [S] (TARA)
Maming Enam Sembilan Mineral Tbk. [S] (AKSI)
Indonesian Tobacco Tbk. (ITIC)
Menteng Heritage Realty Tbk. [S] (HRME)
Ayana Land International Tbk. (NASA)
Andalan Sakti Primaindo Tbk. [S] (ASPI)
Citra Marga Nusaphala Persada Tbk. [S] (CMNP)
Arkha Jayanti Persada Tbk. (ARKA)
Capitol Nusantara Indonesia Tbk. [S] (CANI)
Jasnita Telekomindo Tbk. [S] (JAST)
Kresna Graha Investama Tbk. [S] (KREN)
Maskapai Reasuransi Indonesia Tbk. (MREI)
Anabatic Technologies Tbk. (ATIC)
Pollux Properti Indonesia Tbk. [S] (POLL)
Indosterling Technomedia Tbk. [S] (TECH)
Jaya Bersama Indo Tbk. [S] (DUCK)
Diamond Citra Propertindo Tbk. [S] (DADA)
Boston Furniture Industries Tbk. [S] (SOFA)
10.
11.
12.
13.
14.
15.
16.
17.
18.
1.
2.
3.
4.
5.
6.
7.
8.
9.
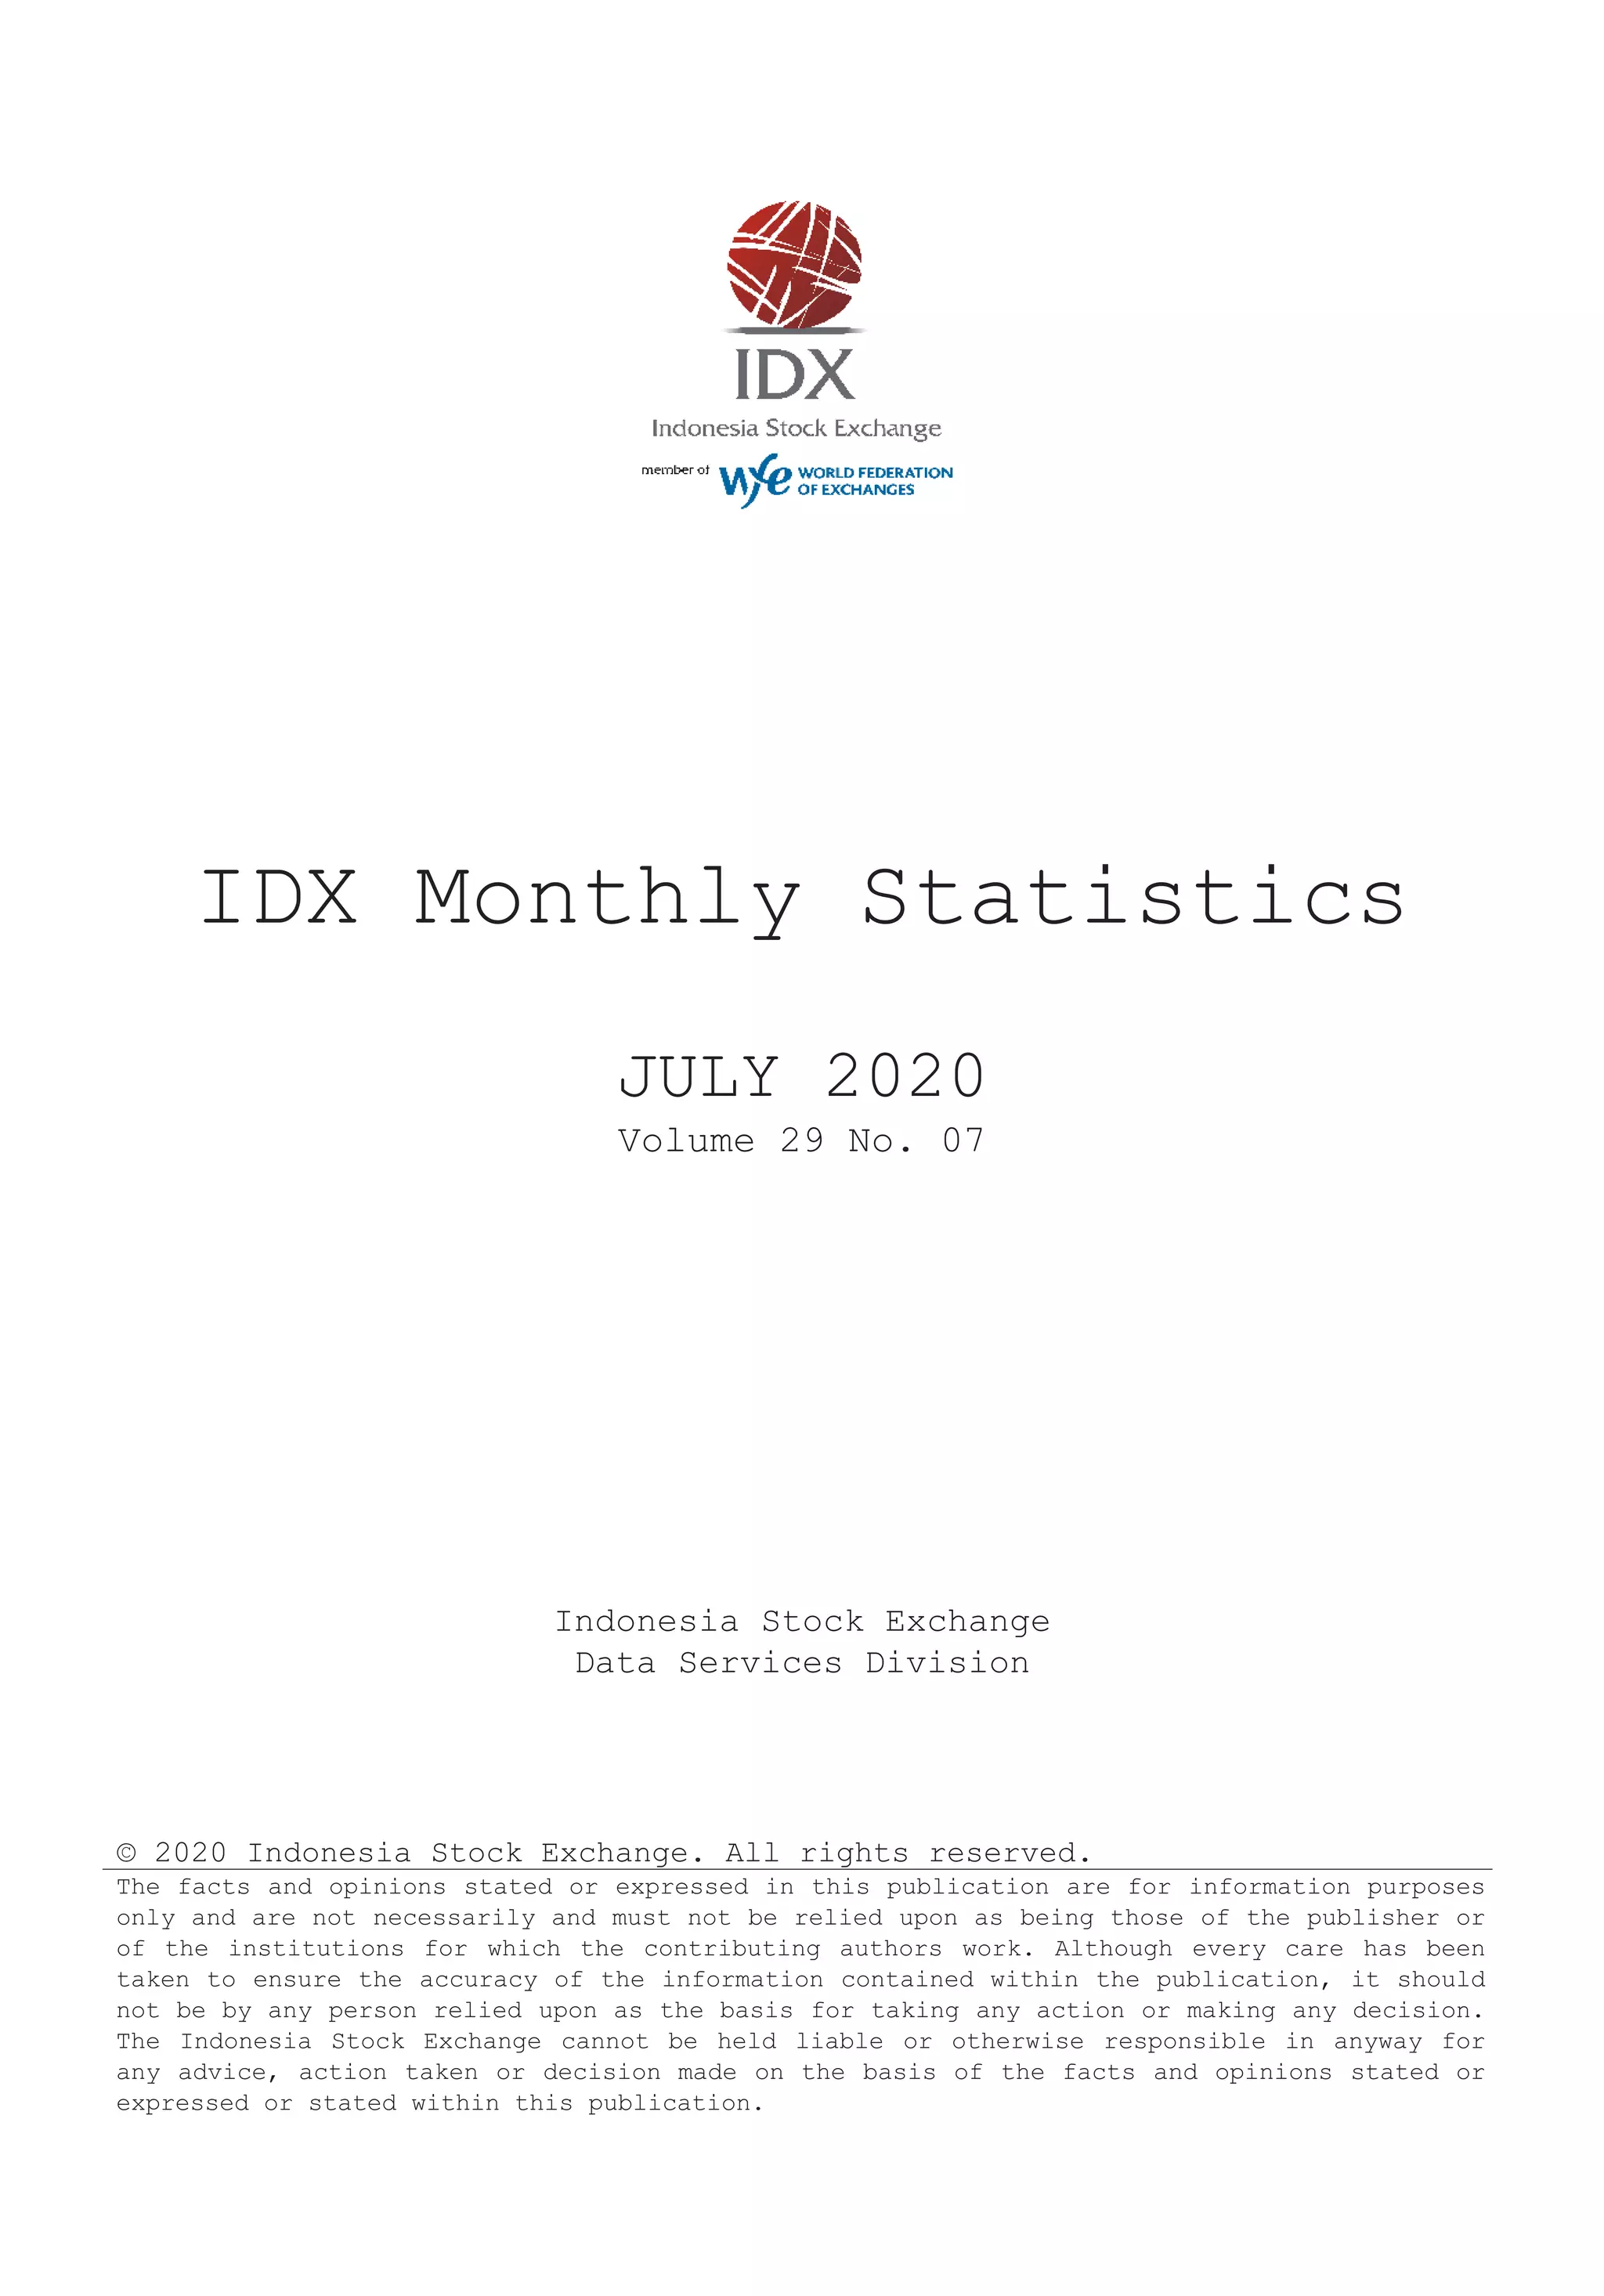
Top 20 Loser Stocks
No. Listed Stocks
Closing Price Dilu-
tion
Factors
Change
Last
Month
Last
Month*
This
Month Price %
80
Listed Stocks
Last
Month
Last
Month*
This
Month
Closing Price Dilu-
tion
Factors
Change
Price %
308
185
79
96
50
366
354
2,280
228
2,250
680
925
414
260
155
470
216
136
122
810
480
110
515
230
232
1,485
865
196
915
406
540
320
130
Bank IBK Indonesia Tbk. (AGRS)
Ginting Jaya Energi Tbk. [S] (WOWS)
115
125
985
110
1,120
344
470
216
136
122
810
480
110
515
230
308
185
79
96
50
Bank Rakyat Indonesia Agroniaga Tbk. (AGRO)
Argo Pantes Tbk. (ARGO)
Pelat Timah Nusantara Tbk. (NIKL)
Prima Globalindo Logistik Tbk. [S] (PPGL)
Pudjiadi & Sons Tbk. [S] (PNSE)
Tifa Finance Tbk. (TIFA)
Bank BRIsyariah Tbk. [S] (BRIS)
Wismilak Inti Makmur Tbk. (WIIM)
Bank Harda Internasional Tbk. (BBHI)
Pradiksi Gunatama Tbk. (PGUN)
Pakuan Tbk. (UANG)
Indofarma Tbk. [S] (INAF)
Megalestari Epack Sentosaraya Tbk. [S] (EPAC)
Kimia Farma Tbk. [S] (KAEF)
Intanwijaya Internasional Tbk. [S] (INCI)
Mark Dynamics Indonesia Tbk. [S] (MARK)
Prima Cakrawala Abadi Tbk. [S] (PCAR)
Delta Dunia Makmur Tbk. (DOID)
6.
7.
8.
18.
19.
20.
9.
10.
11.
12.
13.
14.
15.
16.
17.
Top 20 Gainer Stocks
115
125
985
110
1,120
No.
1.
2.
3.
4.
5.
218.26
183.20
131.47
107.27
100.89
344
1.00
1.00
1.00
1.00
1.00
1.00
1.00
1.00
1.00
1.00
1.00
1.00
1.00
1.00
1.00
1.00
1.00
1.00
+251
+229
+1,295
+118
+1,130
+336
+455
+198
+124
+110
+675
+385
+86
+400
+176
+232
+135
+51
+59
+30
1.00
1.00
97.67
96.81
91.67
91.18
61.46
60.00
90.16
83.33
80.21
78.18
77.67
76.52
75.32
72.97
64.56](https://image.slidesharecdn.com/7idxmonthlystatisticsjuli2020-201227101938/85/7-idx-monthly-statistics-juli-2020-24-320.jpg)
![23IDX MONTHLY STATISTICS, JULY 2020
DATA SERVICES | INDONESIA STOCK EXCHANGE
1
1
2
1
1
2
1
2
1
1
1
2
1
2
1
2
1
1
2
1
1
2
1
1
2
2
2
2
1
1
1
1
2
1
UNSPBakrieSumateraPlantationsTbk.596707/215707/106107/30
ANIMALHUSBANDRY
BEEFEstikaTataTiaraTbk.[S]22224207/0919907/3020007/30
FISHERY
DSFIDharmaSamuderaFishingIndustriesTbk.[S]707507/086207/216607/30
COALMINING
22329,378278,2463,95522
07/30
11.GEMSGoldenEnergyMinesTbk.[S]2,550----2,55003/24102.00015,000--------
10.FIREAlfaEnergiInvestamaTbk.[S]11217107/2410007/0312407/3026.600183284,81339,81034,33222284,81339,81034,33222
9.DSSADianSwastatikaSentosaTbk.[S]19,42522,50007/0318,70007/0120,87507/171,391.66716,085142983771012,337387
8.DOIDDeltaDuniaMakmurTbk.13629607/2813207/0126007/30360.1212,2413,269,752744,221131,667223,342,135758,695131,67222
7.DEWADarmaHenwaTbk.[S]505007/295007/295007/2916.4961,0931,441723615677,70044,9026720
6.BYANBayanResourcesTbk.[S]12,52514,00007/0611,77507/1613,22507/30225.43144,083931,177384223,25641,66338522
5.BUMIBumiResourcesTbk.505007/305007/305007/302.9023,370205,70610,2852,134221,311,58082,9912,26022
4.BSSRBaramultiSuksessaranaTbk.[S]1,4551,44007/091,25007/221,33007/3068.4623,4803774944262137749442621
3.BOSSBorneoOlahSaranaSuksesTbk.[S]829507/097607/228007/3020.000112207,67217,37816,96322217,67218,40516,97222
2.ARIIAtlasResourcesTbk.[S]53059007/0644807/2148207/3033.3331,446470233247222,9701,59624822
1.ADROAdaroEnergyTbk.[S]9951,18007/1599007/011,08507/3098.63634,7051,653,9051,820,206164,403221,695,7311,865,953164,46622
1.61.17637795,37020,67312,4052295,37020,67312,40522
1412320,6321,4213,28020,6321,4213,280
21176,4597,882,5856,805,159736,4979,815,538
1.38.70012320,6321,4213,2802220,6321,4213,28022
2.316,87724,412,71616,763,0121,664,87729,010,26117,659,9261,665,767
7,057,583736,819
76.7093,3834,5488,8231,164224,5488,8231,16422
17.SIMPSalimIvomasPratamaTbk.[S]25433807/27
95,37020,67312,405
18.1,007.7318,6171464692972114646929721
19.124.6277,81124,54319,9323,942
20.2.94415312,5447751,40422302,43422,4111,40722
1337795,37020,67312,405
SMARSMARTTbk.[S]3,1303,40007/152,95007/103,000
SSMS
10,46118
15.PSGOPalmaSerasihTbk.9812007/249507/0311507/3097.1432,1688,576925815228,57692581522
25007/0132207/3029.4555,093323,33698,69925,94822323,33698,69925,94822
14.PGUN*PradiksiGunatamaTbk.11550507/1415507/0736607/30321.7391,82955,57322,02810,4551855,60222,034
16.SGROSampoernaAgroTbk.2,0802,10007/061,78007/271,79007/30
60,3947,55922
13.PALMProvidentAgroTbk.[S]19126807/2718007/1724007/3065.5971,70910,5872,2721,9612212,5872,6421,96222
12.MGROMahkotaGroupTbk.[S]69078507/3066507/0878007/30333.3332,77268,85048,3367,47622102,254
832,14986,06922
11.MAGPMultiAgroGemilangPlantationTbk.[S]505007/295007/295007/2945.4554501095161010951610
10.LSIPPPLondonSumatraIndonesiaTbk.[S]8301,03007/2782007/0199007/30255.4846,755869,774829,87486,05022872,121
1,45743820
9.JAWAJayaAgraWattieTbk.687307/206307/306307/3013.0002381,954131185191,95413118519
8.GZCOGozcoPlantationsTbk.[S]505207/205007/305007/3026.57930017,5028804362029,034
29,2776,51222
7.GOLLGoldenPlantationTbk.50----5002/2717.361183--------
6.DSNGDharmaSatyaNusantaraTbk.36037407/3033207/1436607/3097.2973,88081,92428,7766,5102283,349
435,321129,61022
5.CSRACisadaneSawitRayaTbk.[S]23434407/2122007/0331207/30244.80064089,51625,77814,3102289,52625,78014,31122
4.BWPTEagleHighPlantationsTbk.8912807/278807/0111907/3026.4643,7523,811,664434,674129,607223,817,133
48865007/2747807/0159507/3048.7501,9963642201962136422019621
221,14662213,233221,12454110,811468
1.AALIAstraAgroLestariTbk.[S]8,22510,22507/308,25007/019,70007/30788.00318,66957,155526,39743,7052257,442
22
12PLANTATION70,8635,449,4772,049,535335,6016,103,1262,348,636335,771
125.00007/305007/305007/305050AndiraAgroTbk.[S]ANDI2.
1.BISIBisiInternationalTbk.[S]82587507/3080007/1684007/30407.5002,5204,2803,5121,3642211,266
529,03043,72022
3.ANJTAustindoNusantaraJayaTbk.[S]
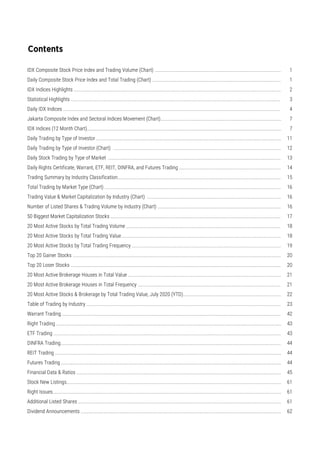
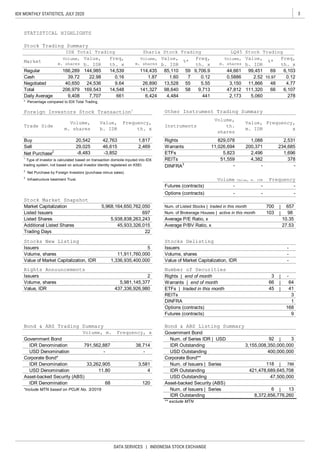
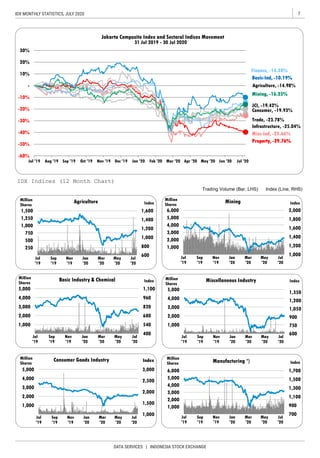
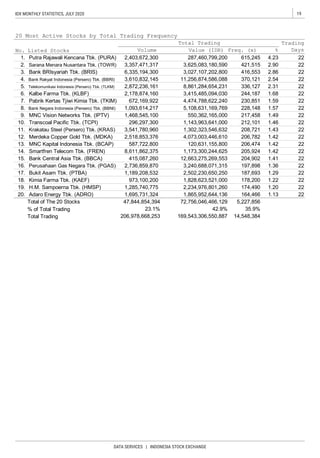
TableTradingbyIndustry
IndustryClassification/StockName
Board
PriceIndivi-
dual
Index
Market
Cap.,
b.IDR
RegularMarketTotalMarket
Prev.
9,2341,368
1.AGRICULTURE73,8825,569,7582,075,141352,6506,230,3942,379,963352,824
11CROPS2,5204,2803,5121,36411,266
Freq.,
xDays
Volume,
th.share
Value,
m.IDR
Freq.,
x
Days
Volume,
th.share
Value,
m.IDRHighDateLowDateCloseDate
9,2341,368
SawitSumbermasSaranaTbk.78086007/2076007/0182007/30
MINING](https://image.slidesharecdn.com/7idxmonthlystatisticsjuli2020-201227101938/85/7-idx-monthly-statistics-juli-2020-27-320.jpg)
![24
DATA SERVICES | INDONESIA STOCK EXCHANGE
IDX MONTHLY STATISTICS, JULY 2020
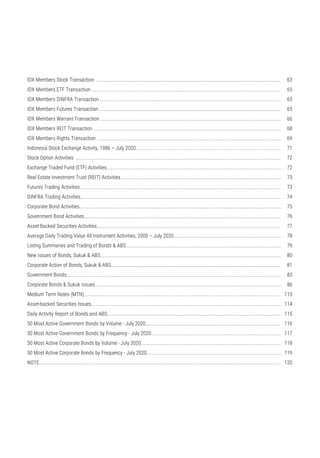
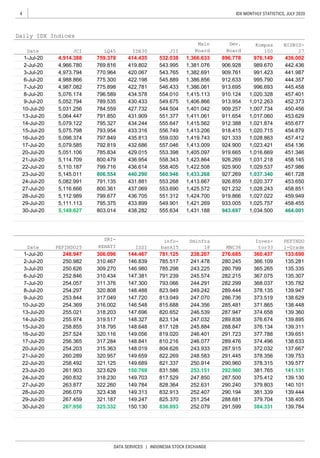
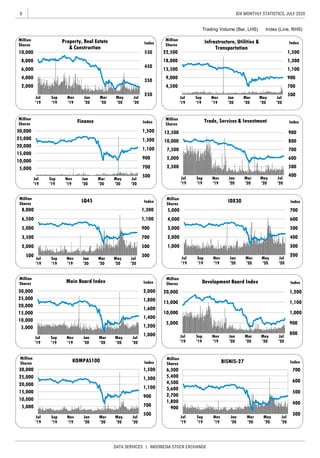
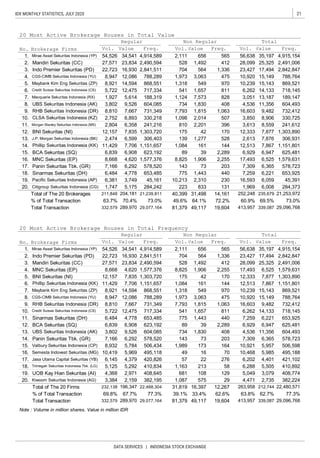
TableTradingbyIndustry
IndustryClassification/StockName
Board
PriceIndivi-
dual
Index
Market
Cap.,
b.IDR
RegularMarketTotalMarket
Prev.
Freq.,
xDays
Volume,
th.share
Value,
m.IDR
Freq.,
x
Days
Volume,
th.share
Value,
m.IDRHighDateLowDateCloseDate
2
1
1
1
1
2
1
1
1
2
2
1
1
2
1
2
1
2
1
2
2
2
2
2
2
1
2
2
2
2
2
1
2
2
1
2
2
TRAMTradaAlamMineraTbk.[S]50----5003/31
CRUDEPETROLEUM&NATURALGASPRODUCTION
243
16,48122
14918
APEXApexindoPratamaDutaTbk.20223007/0115407/2916507/30
419
TOBATobaBaraSejahtraTbk.[S]35436007/0132407/2934607/3073.0142,785698
156117
10.398.5755,660894,297609,37068,236221,077,652829,14968,33622
3.604,61415,540,57017,584,3851,745,06118,028,50119,706,5121,745,742
1.2.10562309156117309
246230915613091561
11.484.831
TINSTimahTbk.59579507/2958507/0176007/30
BASICINDUSTRYANDCHEMICALS
3.CITACitaMineralInvestindoTbk.[S]1,8002,00007/301,65007/231,99007/307,257.4217,8811632907118179319
4.CKRACakraMineralTbk.76--7603/31
9.882.4586,8802,657,819662,224119,635222,673,119666,044
MDKAMerdekaCopperGoldTbk.[S]1,3651,96507/281,35007/031,79007/30
33.830388----11811
26,132
6.102.273956101431491810143
7.INCOValeIndonesiaTbk.[S]2,8003,59007/282,77007/01
5.
8.469.37139,1972,408,9873,907,013206,677222,518,8534,073,003
IFSHIfishdecoTbk.[S]42045007/2939007/0845007/29
3,42007/301,387.75533,982504,3141,619,662101,69622508,1391,633,275
DKFTCentralOmegaResourcesTbk.[S]9814307/249307/0212607/30331.364710217,70626,10616,48022217,906
12.19.1111981,061,98397,47455,883221,067,21197,73655,88822
BumiResourcesMineralsTbk.[S]505007/305007/305007/307.8743,550149,6797,4841,278221,486,71285,8881,323
1.481.30817,5422,134,3141,451,617146,649222,229,8601,532,653146,75722
2.BRMS22
ANTMAnekaTambangTbk.[S]60575507/2859007/0273007/30
10.RUISRadiantUtamaInterinscoTbk.[S]16617507/1616207/3016207/3066.000125274469920274469920
9,329,219707,898
8.MTFNCapitalincInvestmentTbk.[S]505007/295007/295007/291.2661,59210.07141468,0753652116
9.12.5003147,8322,8193,1912047,8322,819
23120,434
3,19120
12,046,4618,713,179707,42014,174,524
11.1,883.871
7.MITIMitraInvestindoTbk.51----5103/314.30572--------
6.MEDCMedcoEnergiInternasionalTbk.45250007/1644807/0146407/30810.1878,3151,622,013766,44989,754221,630,276
5.ENRGEnergiMegaPersadaTbk.[S]525307/225007/305007/304.169517221,88411,3694,89322370,29025,0264,91722
4.ELSAElnusaTbk.[S]22025207/1321807/0122807/3057.5001,6641,526,113366,00266,225221,526,262
3.BIPIAstrindoNusantaraInfrastrukturTbk.505007/305007/305007/3035.7142,2351,5577811822174,1609,87914122
2.ARTIRatuPrabuEnergiTbk.[S]50--5003/2312.251392----133,80554
21.SMMTGoldenEagleEnergyTbk.[S]8310207/206607/088507/30210.55626816,4921,4442,7812216,4921,4442,78122
22.12.227625------
1.10.5634391,669312692221,669
24.41.3242,482-
2219,9224,483,3621,244,659220,8995,019,8911,273,108220,989
23.
SMRUSMRUtamaTbk.[S]50----5003/31
17722
20.PTROPetroseaTbk.[S]1,3202,01007/301,32007/011,97007/301,528.0001,98743,99975,23015,7332243,99975,23015,73322
19.PTBABukitAsamTbk.[S]2,0202,20007/141,99507/012,03007/301,800.00023,3871,181,6852,486,723187,652221,189,2092,502,231187,69322
18.MYOHSamindoResourcesTbk.[S]1,0151,15007/291,00007/101,13507/30136.3792,5042,7642,949765222,7642,94976622
17.MBAPMitrabaraAdiperdanaTbk.[S]1,6251,95007/171,63007/081,77007/30134.6152,1724,2817,5293,026224,2817,5293,02622
16.KKGIResourceAlamIndonesiaTbk.[S]20422207/2818807/1520807/30722.8071,0401,785364416221,78536441622
15.ITMGIndoTambangrayaMegahTbk.[S]7,1008,35007/287,05007/017,90007/3056.4298,92695,230734,77364,1122296,065742,25064,14222
14.INDYIndikaEnergyTbk.6701,08507/2465007/0198007/3034.4075,106892,088838,646104,97222895,947842,307104,98322
13.HRUMHarumEnergyTbk.[S]1,1901,29007/091,17007/161,18007/3022.6923,19018,99423,0596,1102219,11423,2016,11122
12.GTBOGardaTujuhBuanaTbk.[S]828607/077407/137507/1465.217188326251248326251248
--
-------
9,2213,20917822
PSABJResourcesAsiaPasifikTbk.17630807/2817707/0726007/30
3,6873,079,083429,37146,549223,461,885482,702
CTTHCitatahTbk.[S]505107/305007/305007/30
07/30
LAND/STONEQUARRYING
366,04066,22722
770,35889,77722
31269222
206,78222
7418
4,343371083010371093110SURESuperEnergyTbk.2,9302,95007/212,88007/272,90007/30
PKPKPerdanaKaryaPerkasaTbk.507007/205007/305107/30
WOWSGintingJayaEnergiTbk.[S]5011607/215007/138007/30
METALANDMINERALMINING
ZINCKapuasPrimaCoalTbk.[S]14115007/3013207/0814646,60922
119,63722
11
101,74922](https://image.slidesharecdn.com/7idxmonthlystatisticsjuli2020-201227101938/85/7-idx-monthly-statistics-juli-2020-28-320.jpg)
![25IDX MONTHLY STATISTICS, JULY 2020
DATA SERVICES | INDONESIA STOCK EXCHANGE
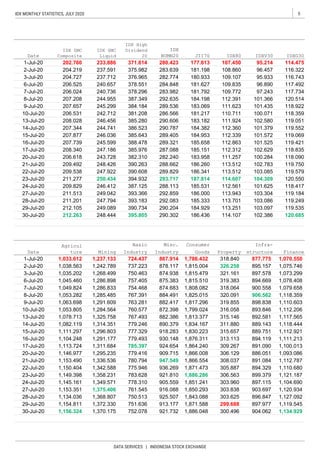
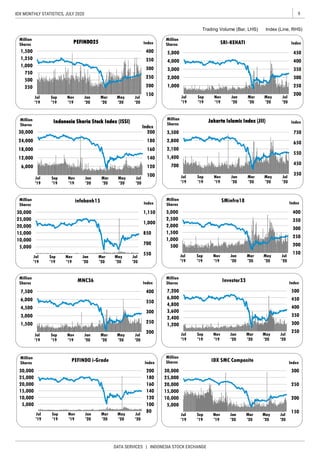
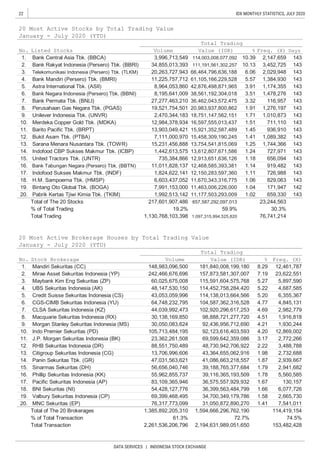
TableTradingbyIndustry
IndustryClassification/StockName
Board
PriceIndivi-
dual
Index
Market
Cap.,
b.IDR
RegularMarketTotalMarket
Prev.
Freq.,
xDays
Volume,
th.share
Value,
m.IDR
Freq.,
x
Days
Volume,
th.share
Value,
m.IDRHighDateLowDateCloseDate
1
1
1
1
1
1
1
1
2
2
1
2
2
2
2
2
2
1
2
2
2
1
2
1
1
2
1
2
1
2
1
1
1
1
1
1
1
07/30
LIONLionMetalWorksTbk.[S]32049807/0629807/0134007/30
22007/30
METALANDALLIEDPRODUCTS
348
378
PelatTimahNusantaraTbk.4801,13007/2447607/0286507/30
7.ETWAEterindoWahanatamaTbk.788007/206707/227207/306.012701,06375134201,0637513420
6.ESSASuryaEsaPerkasaTbk.15417507/2315307/0215507/30299.7522,21754,5728,9374,74622291,57256,6544,75822
5.EKADEkadharmaInternationalTbk.[S]1,0351,38007/211,03007/011,23507/303,135.15486316,71420,74210,5152216,71420,74210,51622
4.DPNSDutaPertiwiNusantaraTbk.[S]24031807/1522807/0824007/3079.9277926270105172627010517
3.BRPTBaritoPacificTbk.[S]1,1601,31007/1588507/3095007/30371.48688,7191,539,4721,740,791141,445221,593,7401,800,720141,52822
2.AGIIAnekaGasIndustriTbk.[S]53061507/0352507/2754507/3049.5451,67114,3138,4432,4162216,3139,6332,41722
1.ADMGPolychemIndonesiaTbk.[S]10113407/2910007/2411507/3010.97944782,6919,7257,5282282,6919,7257,52822
15.30.30810719,5374,1034,6902245,7269,3454,69422
16922620
34231,8862,030,9552,466,628219,1382,859,8992,778,220219,294
17.89.36222227016922620270
PURETrinitanMetalsandMineralsTbk.12312907/0210507/1710907/30
13.LMSHLionmeshPrimaTbk.[S]30232007/1525007/3025007/3034.72224541610219541610219
17,77216,32922
11.KRASKrakatauSteel(Persero)Tbk.27642407/2927207/0338007/3047.9887,3523,540,2631,301,761208,711223,541,7811,302,324208,72122
12.227.97217760122433221601224
16.39.000145152,14517,69416,32422152,650
14.266.1542,183734,236
10.JKSWJakartaKyoeiSteelWorksTbk.60----6003/319.2319--------
9.ISSPSteelPipeIndustryofIndonesiaTbk.12414707/1512107/0112907/3044.746927159,60521,25812,35522160,14821,33012,35822
8.INAIIndalAluminiumIndustryTbk.33438007/2132407/0235807/30129.2442274181472412241814724122
7.GGRPGunungRajaPaksiTbk.[S]27430007/2225207/0827607/3035.0003,3434131122652241311226522
6.GDSTGunawanDianjayaSteelTbk.[S]606507/155407/295807/3037.50053646,2242,8124,6002246,2242,8124,60022
5.CTBNCitraTubindoTbk.[S]2,450----2,45006/122,047.6391,961--------
4.BTONBetonjayaManunggalTbk.[S]19020407/1317407/0618007/30627.8601303,561667838223,56166783822
3.BAJASaranacentralBajatamaTbk.587407/305107/295907/3022.00010616,2861,0071,8042216,2861,0071,80422
3317,7584,674,5961,915,771360,6864,703,3511,921,726360,708
7.700.6842,2701,703378713221,703
2.ALMIAlumindoLightMetalIndustryTbk.22826007/2120007/2120607/3032.9231279682062382196820623821
1.ALKAAlakasaIndustrindoTbk.[S]43043007/0836007/3036007/3063.300183166
71422
634816
TOTOSuryaTotoIndonesiaTbk.[S]220
6.92.693734129,21972,6086,22222129,26972,6366,22322
2.ARNAArwanaCitramuliaTbk.[S]38245007/2036407/1342207/302,881.8053,09836,00514,7273,59122103,54340,0053,60022
3.
4.1.8187461,9489867691,9739867710
5.1,880.0003,515318,257236,57343,21222344,082256,72643,21622
704
KIASKeramikaIndonesiaAssosiasiTbk.[S]505407/235007/295007/29
5.40.6125,2462,486,767510,40368,577212,504,194513,98868,59321
6.
22
3211,596492,459327,35655,579585,898372,81655,595
1.AMFGAsahimasFlatGlassTbk.3,3003,30007/012,48007/072,70007/30
CAKKCahayaputraAsaKeramikTbk.[S]505107/275007/305007/3029.762604,309215704224,309215
48.1362,388494,913147,114
1,0192,75846121
34,450
116.7351,1721,0192,758
1.INTPIndocementTunggalPrakarsaTbk.[S]11,80012,70007/2811,40007/0112,37507/30496.00045,55592,6351,119,28862,57922128,7861,550,55862,63322
31120,6495,103,0513,453,918364,6265,174,652
4.3,297.02854,71883,601797,24149,1272297,519931,08949,19622
SMBRSemenBaturaja(Persero)Tbk.[S]30863007/2430407/0149207/302.91.0714,8871,943,060877,698148,547221,944,503878,359148,56022
3.SMCB
4,024,329364,793
PICOPelangiIndahCanindoTbk.[S]22825007/0118407/1718807/30
MARKMarkDynamicsIndonesiaTbk.[S]470
CEMENT
46121
WTONWijayaKaryaBetonTbk.[S]28232407/0927407/3027407/30
CERAMICS,GLASS,PORCELAIN
22
SolusiBangunIndonesiaTbk.1,0801,12007/0199507/301,02507/301,219.8077,8542,0772,1741,360222,3772,478
34,43622497,273147,855
1,36122
SMGRSemenIndonesia(Persero)Tbk.9,62510,15007/079,15007/279,22507/30
WSBPWaskitaBetonPrecastTbk.[S]19622007/0919407/0119907/29
MLIAMuliaIndustrindoTbk.[S]53561507/1653007/0155507/30
95007/2946807/01925
23407/0921407/29
33221
565,589109,92622734,236565,589109,92622NIKL
TBMSTembagaMuliaSemananTbk.[S]68570007/0260007/2260507/30
CHEMICALS](https://image.slidesharecdn.com/7idxmonthlystatisticsjuli2020-201227101938/85/7-idx-monthly-statistics-juli-2020-29-320.jpg)
![26
DATA SERVICES | INDONESIA STOCK EXCHANGE
IDX MONTHLY STATISTICS, JULY 2020
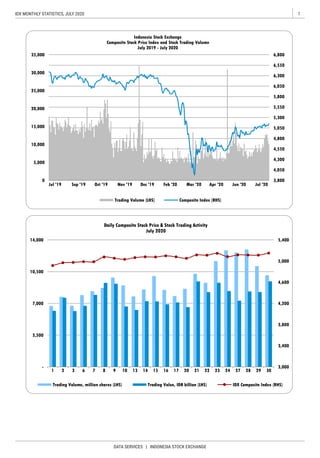
TableTradingbyIndustry
IndustryClassification/StockName
Board
PriceIndivi-
dual
Index
Market
Cap.,
b.IDR
RegularMarketTotalMarket
Prev.
Freq.,
xDays
Volume,
th.share
Value,
m.IDR
Freq.,
x
Days
Volume,
th.share
Value,
m.IDRHighDateLowDateCloseDate
1
2
2
1
1
1
2
1
2
1
2
2
2
2
1
2
1
1
1
2
1
2
1
1
1
1
2
1
2
1
1
2
1
1
2
2
2
MAINMalindoFeedmillTbk.[S]58570507/2356507/0261007/30
WOODINDUSTRIES
SULISLJGlobalTbk.505007/305007/305007/30
PULP&PAPER
UNICUnggulIndahCahayaTbk.[S]3,3504,13007/303,35007/033,70007/30
PLASTICS&PACKAGING
JPFAJapfaComfeedIndonesiaTbk.[S]1,1851,26007/031,05507/301,06007/30
SINISingarajaPutraTbk.[S]52572007/2750007/0252007/30
INKPIndahKiatPulp&PaperTbk.5,9758,250133,28622395,582
9.615434------
07/225,85007/017,80007/30
507
SRSNIndoAcidatamaTbk.[S]556307/30
34473007/2735607/0168007/30
EPAC*MegalestariEpackSentosarayaTbk.[S]11033607/14148
TIRTTirtaMahakamResourcesTbk.535407/21
TPIAChandraAsriPetrochemicalTbk.[S]6,575
5207/28
37407/07420
07/30177.778264
5407/036007/30
CPROCentralProteinaPrimaTbk.505007/305007/305007/30
MOLI
8,628
IPOLIndopolySwakarsaIndustryTbk.[S]727607/216707/027107/30
07/29
INCIIntanwijayaInternasionalTbk.[S]
07/21
5007/23
460505
5,70722
1,416
2,777,436278,3962,565,6422,918,209278,553
07/0815707/30
21
10,930994
138,241
8742210,930994
483,856146,144
449
4.7.7661,0629476921594769215
5.
6.195.000308634505502225,2813,75851022
-
INRUTobaPulpLestariTbk.[S]83007/2976507/29
KedawungSetiaIndustrialTbk.[S]74095007/0672507/0176007/30
4.23.77153780408515780408515
3884,087968,2966,448,858373,0431,103,8137,410,846373,146
2,928,448133,35322
3.0.7141991,9269630171,9269630
1.291.6974291,08643455191,3595276019
2.1,604.18017,34533240321033FASW
3.404.49942,674300,4772,211,119
371,75798,23613,9769,478102,83116,3899,479
5.1.1561,3934194288819419
2.509.25923516393227224,7582,50522822
1.126.6671,27195,36713,7489,1362213,7489,13622
4288919SIPDSieradProduceTbk.[S]1,0501,10007/0897007/221,04007/30
4.372.1591,366412,437262,61250,37722412,622262,73550,38222
3.302.07812,430813,643944,699119,10822816,596948,158
12.59.74731914333118181433311818
13.232.6411,0951505817459,20725,7186411
14.
2.45.4552,9792871430191,067,668
36120,2451,483,439
1.
6621
108,88722
65,785
28,237.009102,078256,654
61322
22
10.105.8821,6503,9963,4861,7372234,08429,4811,74022
11.99.48263993716621921937166219
1,569,683108,79322268,3381,641,102
9.34.286457
5,5756,600CPINCharoenPokphandIndonesiaTbk.[S]07/075,52507/016,22507/30
TRSTTriasSentosaTbk.[S]38639807/2138007/2139007/23
ANIMALFEED
5.ESIPSinergiIntiPlastindoTbk.[S]16223407/3016007/0223407/30131.288150177,11035,76828,07222177,11035,76828,07222
19,4991,50922
YanaprimaHastapersadaTbk.[S]YPAS8718
226,2096,2094491,416
84007/2488007/30
07/30
TALFTunasAlfinTbk.25629407/0321007/1623607/29
7.
PBIDPancaBudiIdamanTbk.[S]86595507/28
9507/018907/309107/30
3,415911613223,415911
3.BRNABerlinaTbk.[S]1,0151,12507/1493007/3093007/30697.77991154451980145445198014
4.214.545753385,039111,64544,09122518,684
8.331.5796,11415,43419,4991,5092215,434
6.27.906FPNILotteChemicalTitanTbk.[S]93
07/0122807/30
IMPCImpackPratamaIndustriTbk.[S]1,2401,28007/221,24007/021,26507/30
22
87422
IGARChampionPacificIndonesiaTbk.[S]25629607/2125207/02272
2.APLIAsiaplastIndustriesTbk.[S]10513407/218907/0311707/30101.66715921424282212142428221
1.AKPIArghaKaryaPrimaIndustryTbk.[S]31443007/2228007/2929207/3037.726199132439114132911443
14.1,641.941130,63194,040652,51731,4112299,319688,01231,42022
13.40.35194490,1058,3746,2942290,1056,294228,374
3513,499604,277173,60779,206827,068251,85779,258
15.145.9221,41834
7,50007/246,45007/017,32507/30
8.73.54613311,9237,0536,5652211,9347,056
12.11.292361118,4086,9785,70422148,408
10.155.1722,1014664101901622,53122,06319316
11.
6,56622
9.MDKIEmdekiUtamaTbk.[S]13816707/23127
296.6671,8355,5362,1891,458221,50022
-
10
95,367
1207317347317120
ALDOAlkindoNaratamaTbk.[S]36640007/2735807/1739007/30
KBRIKertasBasukiRachmatIndonesiaTbk.50----5003/30
24032FajarSuryaWisesaTbk.[S]7,1507,30007/287,00007/307,00007/30
77.064281261187182611
35.3373971,356203554221,356204
44,093
119,12922
17
87007/16765
22
SAMFSaraswantiAnugerahMakmurTbk.[S]34843007/0234807/01358
MadusariMurniIndahTbk.1,0101,03007/0276007/2990007/30
555
TDPMTridomainPerformanceMaterialsTbk.[S]959907/018807/309007/30
SMKLSatyamitraKemasLestariTbk.18119207/2916207/07188
07/30
IFIIIndonesiaFibreboardIndustryTbk.[S]16315707/0312307/2113507/30
KDSI](https://image.slidesharecdn.com/7idxmonthlystatisticsjuli2020-201227101938/85/7-idx-monthly-statistics-juli-2020-30-320.jpg)
![27IDX MONTHLY STATISTICS, JULY 2020
DATA SERVICES | INDONESIA STOCK EXCHANGE
TableTradingbyIndustry
IndustryClassification/StockName
Board
PriceIndivi-
dual
Index
Market
Cap.,
b.IDR
RegularMarketTotalMarket
Prev.
Freq.,
xDays
Volume,
th.share
Value,
m.IDR
Freq.,
x
Days
Volume,
th.share
Value,
m.IDRHighDateLowDateCloseDate
1
2
1
2
2
2
2
2
1
1
2
1
1
2
1
1
1
1
1
2
1
2
1
1
2
2
2
2
2
1
1
1
1
1
2
2
TEXTILE,GARMENT
30029807/0121807/2826007/30
KMTRKiranaMegataraTbk.23832007/3023007/0631607/30
MISCELLANEOUSINDUSTRY
MACHINERYANDHEAVYEQUIPMENT
KPALSteadfastMarineTbk.717707/175907/296207/30
AUTOMOTIVEANDCOMPONENTS
PRASPrimaAlloySteelUniversalTbk.14315107/2110407/1611907/30
SWATSriwahanaAdityakartaTbk.[S]9510207/069207/019507/30
OTHERS
POLUGoldenFlowerTbk[S]8401,13007/03
NIPSNipressTbk.282----28203/31
POLY
GMFIGarudaMaintenanceFacilityAeroAsiaTbk.[S]839407/168107/238407/30
SPMASuparmaTbk.[S]26626807/0324007/2725207/30
490.0001,08817,19912,2894,48822
25007/30
418
73507/0290007/30
129,647
21
22
426.6215,3721,9851,131252
INDRIndo-RamaSyntheticsTbk.[S]2,2002,450
AsiaPacificFibersTbk.505007/305007/305007/30
---25003/27
07/1524807/30
PBRXPanBrothersTbk.
2,054
21
100,85523,498
11.329.861675424011921424011921
12.0.4291251,32966102211,32966
10.442.4781,62010,6132,7781,0672229,4108,1591,08022
8.321.8901,5649992,245429229992,24542922
9.MYTXAsiaPacificInvestamaTbk.505807/215007/285407/307.96670937135227093713522
07/241,98007/022,39007/30
07/2707/03234280286
7.18.924432--------PanasiaIndoResourcesTbk.[S]120----12003/31
4.
5.47.96014753663270225366327022
6.ESTIEverShineTexTbk.51
CNTXCenturyTextileIndustry(PS)Tbk.26026207/15226
22
HDTX
17112274216112450.909
ERTXEratexDjajaTbk.14214007/0210407/1611407/30
6607/155007/3050
43
4216
1.ARGOArgoPantesTbk.8101,49507/2980007/071,48507/3037.437498893113893113
2.BELLTrisulaTextileIndustriesTbk.[S]69576007/2768507/1075007/30
3.CNTBCenturyTextileIndustry(SeriB)Tbk.250-
27
17,19912,2894,48822
100.00033--------
21,5321,070,750228,660124,8751,538,818292,572124,943
13.SMSMSelamatSempurnaTbk.[S]1,0501,34507/301,04007/061,28507/303,485.6707,40095,492110,06637,6492296,965111,61337,650
10.
11.205.234461-------
211,9851,131252
831,282150298211,28215029812.69.808
MASAMultistradaArahSaranaTbk.[S]58062007/2053007/0858507/30
8.203.4371,4047401,637681217401,63768121
7.IMASIndomobilSuksesInternasionalTbk.65574007/2261007/0165007/3089.2771,797149,604100,78723,49422149,704
9.LPINMultiPrimaSejahteraTbk.[S]23827007/1022007/0623607/30108.5611004461052082144610520821
INDSIndospringTbk.[S]1,9852,42007/031,94007/032,14007/30
22
6.
247,061
3.157.2732,0046755772712675
1,525,97642
96007/2383507/01870
GJTLGajahTunggalTbk.[S]38463007/2937007/02540
5,15007/30
113.8681,882262,457129,15025,69122263,65707/30
07/214,77007/08ASIIAstraInternationalTbk.[S]4,8005,450
07/30
2.
5.172.36446020939
122.03457626188
3.
34,939
39
31,7518,9788,97822
178,244
4,7855,337
5.1,160.00059547867613317478
342984.BRAMIndoKordsaTbk.[S]6,1506,15007/015,32507/175,32507/17207.2432,3966342986
67613317
22
12209
07/1428807/14
5,3362269,185
12
22
3.68.1222,5961,155334383191,155334383
4.
41
47010,6802,6488282230,7667,935835
3,764247,84320,30414,896247,843
07/30782.3104,19334,93931,751
21.2502,372178,24415,3879,171
1.3,629.225208,490741,7403,761,643149,621
2.AUTOAstraOtopartsTbk.[S]885
236,1791,289,8444,137,706
4.
1.AMINAteliersMecaniquesD'IndonesieTbk.[S]26432007/1424007/16268
9.431.25221,014636,6814,233,477230,82922672,1704,474,789230,85122
39
1.42.2767273,4283,8523,69817
3,13885,2636,8344,909105,34812,1214,916
3,69817
2.98.40022
INCFIndoKomoditiKorporaTbk.505907/205007/305007/30
TKIMPabrikKertasTjiwiKimiaTbk.5,1507,42507/095,10007/016,75007/30
INOVInocycleTechnologyGroupTbk.
8.59.37528728,0162,6877,9262228,0162,6877,92622
7.32132222321110.2745331,274320
73,4283,852
22
19
9,17122
1569261881569
22
25,69822
-
21
22
35194
55.6526669,1854,785
GDYRGoodyearIndonesiaTbk.[S]1,4001,70007/241,36007/131,45007/30
279,9513,268,7224,527,535447,3124,426,4996,052,012447,616
195.3132891333519407/30
KRAHGrandKartechTbk.50052507/0140007/21
07/30855
47407/23
20,30414,897
149,799
15,387
22
5772712BOLTGarudaMetalindoTbk.[S]97093507/02
1,278
4,928,735
22133
5,306,912247,251
22975,099
ARKAArkhaJayantiPersadaTbk.43046007/01288
810
102
07/3020.08010116,3479962,0542216,347996](https://image.slidesharecdn.com/7idxmonthlystatisticsjuli2020-201227101938/85/7-idx-monthly-statistics-juli-2020-31-320.jpg)
![28
DATA SERVICES | INDONESIA STOCK EXCHANGE
IDX MONTHLY STATISTICS, JULY 2020
TableTradingbyIndustry
IndustryClassification/StockName
Board
PriceIndivi-
dual
Index
Market
Cap.,
b.IDR
RegularMarketTotalMarket
Prev.
Freq.,
xDays
Volume,
th.share
Value,
m.IDR
Freq.,
x
Days
Volume,
th.share
Value,
m.IDRHighDateLowDateCloseDate
1
2
1
2
1
2
2
1
2
2
1
2
2
2
2
1
2
1
1
1
1
2
2
1
1
2
1
1
1
1
2
1
1
2
1
1
FOODANDBEVERAGES
UNITNusantaraIntiCorporaTbk.[S]15116607/1313907/1715907/30
FOOTWEAR
BATASepatuBataTbk.[S]55560007/3053007/1560007/30
CABLE
SCCOSupremeCableManufacturing&CommerceTbk.[S]9,1009,95007/289,00007/019,80007/30
JSKYSkyEnergyIndonesiaTbk.[S]888807/097507/297807/30
20807/16
07/10
22
07/3019707/30
DLTADeltaDjakartaTbk.5,1005,00007/144,74007/304,74007/30
ELECTRONICS
TRISTrisulaInternationalTbk.[S]21223207/0719207/0622007/30
ZONEMegaPerintisTbk.[S]41842207/0840807/2141607/30
KBLIKMIWireandCableTbk.[S]39447007/0737007/30
UCID
KBLMKabelindoMurniTbk.[S]224234
2,518
394,645
2,9362218,0614,5292,93622
14348
RICYRickyPutraGlobalindoTbk.[S]949707/029007/309207/30
BIMAPrimarindoAsiaInfrastructureTbk.505007/3050
113
3303122062,5188,01031620
31007/30
66,95322
07/2051507/302,282.6096,180293,145144,81334,87722
07/2392507/27
07/10117
74507/09
DMNDDiamondFoodIndonesiaTbk.[S]940965
86.66776105,93613,0057,26222105,93613,0057,26322
13.GOODGarudafoodPutraPutriJayaTbk.[S]1,3001,36507/301,27507/081,34007/30103.1139,8894,9456,4343,34322
14.209.6771,623258,257171,69619,24322278,527184,87119,24522
154,945126,434
07/3064007/2868007/30
FOODSentraFoodIndonesiaTbk.[S]140145
11.103.8258,8064654416232246544162322
12.
49.3204059,274820
7.CEKAWilmarCahayaIndonesiaTbk.[S]1,9952,10007/021,77507/301,80007/30392.5621,0714,0457,891
192,01034,881
2,581224,0507,9002,582
22
9.409.0914541,206955479209,9978,95548220
10.28,692.6893,7952111,021488222111,02148822
COCOWahanaInterfoodNusantaraTbk.[S]840860
8.CLEO
1.ADESAkashaWiraInternationalTbk.[S]8651,05007/2984007/0899007/3051.9485842,4532,2661,777222,4532,266
22
3.ALTOTriBanyanTirtaTbk.38640007/2030407/2734007/30170.8677455318591753185917
4.BTEKBumiTeknokulturaUnggulTbk.[S]505007/29
941229,27482094122
6.61.8181,1598,3411,7002,163228,3411,7002,16322
5.BUDI
2.AISATigaPilarSejahteraFoodTbk.168----16801/3020.448804--------
5007/295007/29383.0832,314693321511,3294543616
869507/228407/149007/30
51321,7751,637,2984,279,118388,4262,990,5696,292,354388,886
5.1,082,0139,372,43116,926,8691,547,75311,516,80319,916,2441,548,600CONSUMERGOODSINDUSTRY
1.39.500159347,84028,65322,53322369,04032,22222,54422
4611,525563,616105,30846,597584,818108,87646,609
3.4,456.52210,2506,25232,3601,483226,25232,3601,48322
2.112.7591,116209,52344,29422,58122209,52544,29522,58222PTSNSatNusapersadaTbk.[S]18524407/2817607/1521007/30
SLISGayaAbadiSempurnaTbk.
7.85.8168234,360871597224,36087159722
6.6,322.5812,0151371,296205211,65520821
VOKSVokselElectricTbk.[S]19121007/2418907/3019807/30
300,1548,10622
15,608
38007/30
07/0121407/3022007/305.7.3332468,7321,9731,709228,7321,9731,70922
4.48.1171,52364,75426,6768,07622495,612
2301974816223019
20.102.6676,40125,56638,2167,5532230,92846,3337,560
JECCJemboCableCompanyTbk.[S]6,9506,90007/096,32507/216,80007/21
20521
07/3050
Uni-CharmIndonesiaTbk[S]1,3951,55007/141,39007/011,54007/30
21807/30
22
07/02
3.515.3661,028852124852124
2.19.58926751211320521512
2.12.2863022114112211411
1.7,392.99678083471292283
323,30013,773
1.98.40024018,0614,529
456,14296,56335,51013,740528,939
4712922
07/30
127.451672
6236311062363110
4481010548143105
21.3.8231217226131201722613120
22.139.5973621,727719487221,72771948722
18.69.7971,4954110841108
19.73.333691748162
TFCOTificoFiberIndonesiaTbk.[S]
SBATSejahteraBintangAbadiTextileTbk.10115807/309407/1015807/30143.810336298,37233,21366,91122682,27575,945
17.
13.14.9295960657220226065722022
14.
15.82.5004,009693,083137,35040,25322693,087137,35140,25522
16.143.529779
SRILSriRejekiIsmanTbk.
07/30
IKBISumiIndoKabelTbk.[S]226240
SSTMSunsonTextileManufacturerTbk.[S]50072007/0257007/3066507/30
StarPetrochemTbk.[S]14014407/0311807/2914007/30
38035807/0630807/24
STAR
197CAMPCampinaIceCreamIndustryTbk.[S]20621207/13
07/0211107/30
5,0755,50007/025,02507/215,12507/30
1,77722
81007/30
BudiStarch&SweetenerTbk.[S]
46656507/29444
HOKIBuyungPoetraSembadaTbk.[S]660715
93007/30
SarigunaPrimatirtaTbk.[S]
3,355
18820807/1618607/0119607/30
CCSICommunicationCableSystemsIndonesiaTbk[S]24828407/2724007/30240](https://image.slidesharecdn.com/7idxmonthlystatisticsjuli2020-201227101938/85/7-idx-monthly-statistics-juli-2020-32-320.jpg)
![29IDX MONTHLY STATISTICS, JULY 2020
DATA SERVICES | INDONESIA STOCK EXCHANGE
TableTradingbyIndustry
IndustryClassification/StockName
Board
PriceIndivi-
dual
Index
Market
Cap.,
b.IDR
RegularMarketTotalMarket
Prev.
Freq.,
xDays
Volume,
th.share
Value,
m.IDR
Freq.,
x
Days
Volume,
th.share
Value,
m.IDRHighDateLowDateCloseDate
1
2
2
1
2
1
1
2
2
2
1
2
2
2
1
1
1
1
2
1
1
1
1
1
1
2
1
2
2
1
1
1
2
1
1
1
1
ULTJUltraJayaMilkIndustry&TradingCompanyTbk.[S]1,6501,67507/011,59507/301,62507/30
TOBACCOMANUFACTURERS
WIIMWismilakIntiMakmurTbk.18532807/3017807/0732007/30
PHARMACEUTICALS
TSPCTempoScanPacificTbk.[S]1,3901,70507/231,35507/281,38007/30
TCIDMandomIndonesiaTbk.[S]7,5007,50007/086,72507/306,72507/30
1,455
SCPIMerckSharpDohmePharmaTbk.[S]29,000----29,00003/31
07/3023,953
6007/017207/30
MERKMerckTbk.[S]2,7504,45007/17
07/012,28007/30
638607/14
COSMETICSANDHOUSEHOLD
UNVRUnileverIndonesiaTbk.[S]7,9008,40007/307,75007/018,40007/30
RMBABentoelInternasionalInvestamaTbk.24026807/1622007/2823607/30
SIDOIndustriJamudanFarmasiSidoMunculTbk.[S]1,2151,31507/301,18007/071,30007/30
SKLTSekarLautTbk.[S]1,6101,610
890
--
ICBPIndofoodCBPSuksesMakmurTbk.[S]9,3509,65007/17
STTPSiantarTopTbk.[S]8,0009,00007/077,45007/017,95007/29
ITICIndonesianTobaccoTbk.1,4401,50007/0161007/27
HMSPH.M.SampoernaTbk.1,6451,90007/171,62007/011,70507/30
PYFAPyridamFarmaTbk.[S]6101,57507/2458007/01
MRATMustikaRatuTbk.[S]12817807/2212507/0214507/30
-
15,3277,4832222,163
304,5362,678,8733,891,976343,7052,704,810
3810
18719
9,55622
343,832
15,41422
5003/31
ROTINipponIndosariCorpindoTbk.[S]1,1901,26507/131,180
736011871973
IIKPIntiAgriResourcesTbk.[S]50----
07/221,610
6.211,213.518320,460272,9362,198,534122,69322300,0282,414,785122,80822
5.686.5981,3522071,492328212071,49232821
553,219967,144368,21866,096984,431372,62366,101HOUSEWARE
4.23.077626,4641,0291,635226,4641,0291,63522
3.9.595773,904279384223,90427938422
2.30.9523831,6741,7203,2632231,6741,7203,26422
MBTOMartinaBertoTbk.[S]
KPASCottonindoAriestaTbk.[S]506407/155007/305007/30
1.87.6324,74319,88967,6326,3432220,30169,0206,34722
9.218.96619,500154,506192,27944,35522166,306206,79444,36922
8.227.451104-----
54326,733335,0752,270,687134,646362,5792,488,326134,766
10.246.1826,21015,29022,1117,48222
---
KINOKinoIndonesiaTbk.[S]3,4503,660
4.14,873.69673,3602,083,4503,269,049244,099222,178,8743,415,485244,18722
5.9,781.9501,6406,18823,2578,685226,20823,3118,68622
50,81211,32722
7.935.907476114,397124,57923,94622725,642597,700
6.119.7831,22229,52050,76211,3192229,559
KLBFKalbeFarmaTbk.[S]1,4601,695
22
07/211,45007/171,56507/30
2,74007/013,66007/30
07/30PEHAPhaprosTbk.[S]1,3102,38007/241,06507/08
5.43.6926721,333,143349,80276,831221,333,218349,82176,83222
53124,6733,743,0256,114,266612,2134,463,3986,751,527612,348
3.2,220.00012,497971,3621,825,738178,18722973,1001,828,624178,200
4.1,877.9348,59157313427422573134274
1.853.9712,5981,9654,4512,144221,9654,4512,144
2.
DVLADarya-VariaLaboratoriaTbk.[S]2,1802,45007/222,15007/202,32007/30
IndofarmaTbk.[S]985
3.411.36479551,60851,86429,1262256,98257,88329,127
1.1,937.56196,15626,6301,287,44463,0482228,2971,365,99563,10922
2.8,611.222198,3221,266,9202,202,732174,426221,285,7412,234,977174,49022
22
GGRMGudangGaramTbk.
84507/30
47,17550,60007/1646,50007/0749,97507/30
29.161.6763,900118,21579,57915,41322118,23579,593
30.3,111.91318,774135,443217,0519,285221,120,4451,793,529
4,008,810
26.194.783483441138104411
601
52
74507/2755007/0173007/30
07/221,61007/22
TBLATunasBaruLampungTbk.555
24.10.00014455642105564210
25.480.3927,64010,78013,1553,9792223,24128,420
28.4,697.749
27.134.7911,1121222
PSDNPrasidhaAnekaNiagaTbk.13213607/019907/1710007/21
10,415
SKBMSekarBumiTbk.[S]32232207/0121007/3028007/30
22
22
12
3,981
22.53.704241,41084541221,4108454122
23.241.33348359221040413592210
21.MYORMayoraIndahTbk.[S]2,2602,37007/302,18007/142,35007/3011,755.87852,54363,963143,93527,1422291,248
PANIPratamaAbadiNusaIndustriTbk.[S]597407/075507/025807/30
40413
206,05027,17622
PCARPrimaCakrawalaAbadiTbk.[S]21644007/2818607/1541407/30
17.595.833562174,939109,94934,11822174,939109,94934,11822
18.
MLBIMultiBintangIndonesiaTbk.10,02510,05007/029,50007/279,80007/3062,420.38220,6499849,751953221,11611,068
19.138.0001,5388,9649,5263,6152226,82229,1683,62622
20.
1,095.53456,634254,3871,675,060112,81522262,8971,730,795112,87022
95522
INDFIndofoodSuksesMakmurTbk.[S]6,5256,80007/226,35007/296,45007/30
IKANEraMandiriCemerlangTbk.
16.95.9731,680-----
15.338.276107,290179,0501,669,135106,02422189,226
07/24980
1,23507/30
49875507/2946207/08
9,20007/30
INAF
67507/30
22
KEJUMuliaBogaRayaTbk.[S]8801,13007/2187507/011,02507/30
3,33007/241,09507/012,25007/30KAEFKimiaFarmaTbk.[S]1,120
9,00007/28
07/06
07/023,25007/243,32007/30
2,930
1,762,972106,081
22
844.0007,066366,347602,04091,99622366,417602,18891,999
22
22
22](https://image.slidesharecdn.com/7idxmonthlystatisticsjuli2020-201227101938/85/7-idx-monthly-statistics-juli-2020-33-320.jpg)
![30
DATA SERVICES | INDONESIA STOCK EXCHANGE
IDX MONTHLY STATISTICS, JULY 2020
TableTradingbyIndustry
IndustryClassification/StockName
Board
PriceIndivi-
dual
Index
Market
Cap.,
b.IDR
RegularMarketTotalMarket
Prev.
Freq.,
xDays
Volume,
th.share
Value,
m.IDR
Freq.,
x
Days
Volume,
th.share
Value,
m.IDRHighDateLowDateCloseDate
2
2
1
2
3
1
1
1
1
2
2
1
1
2
2
2
1
2
2
2
1
1
1
2
2
1
2
1
1
1
2
1
2
2
1
1
2
1
SOFA*BostonFurnitureIndustriesTbk.10012107/087107/287307/30
HRTAHartadinataAbadiTbk.[S]21227407/2719807/0123407/30
PROPERTY,REALESTATEANDBUILDINGCONSTRUCTION
PROPERTYANDREALESTATE
16
LMPILanggengMakmurIndustriTbk.[S]828407/227507/208207/29
07/3025427007/24
KICIKedaungIndahCanTbk.[S]18727607/2318607/0225007/29
WOODIntegraIndocabinetTbk.[S]39244807/15
GPRAPerdanaGapuraprimaTbk.[S]5156
20.701352
CINTChitoseInternasionalTbk.[S]
07/24
5007/3021.99921489,5374,596
GowaMakassarTourismDevelopmentTbk.[S]16,97517,97507/2417,97507/2417,97550.7013
2,4542289,5414,5962,45522
30.GMTD3,126.0871,825
31.07/205007/30
29.47.61950180.3914111,411,19269,4602816GAMAGadingDevelopmentTbk.[S]505007/305007/305007/30
28.FORZForzaLandIndonesiaTbk.505007/305007/305007/3022.7279935235217473621
27.FMIIFortuneMateIndonesiaTbk.[S]80074507/2374507/2374507/23745.0002,02710.822110.8221
26.EMDEMegapolitanDevelopmentsTbk.20220207/2918807/2920207/2980.8006771092235953,689
25.ELTYBakrielandDevelopmentTbk.[S]505007/305007/305007/3010.3082,17658629351845,9311,1287320
24.DUTIDutaPertiwiTbk.[S]5,1256,47507/163,79007/303,79007/30388.2137,0121,3977,7352,108203,46717,9912,116
23.DMASPuradeltaLestariTbk.[S]17224207/2916407/0822007/30111.42910,6043,074,534611,28687,642223,146,492625,95887,65522
22.DILDIntilandDevelopmentTbk.[S]18819507/0317607/2417907/3031.0181,85565,24611,8343,83022185,14440,4563,88122
21.DARTDutaAnggadaRealtyTbk.28027007/0120007/2221607/3041.779679159346913159346913
20.DADADiamondCitraPropertindoTbk.[S]10711007/157707/307807/3080.3925601,970,229187,61678,692221,970,22922187,61678,692
19.CTRACiputraDevelopmentTbk.[S]61068507/0960007/0165507/30146.65112,157967,734626,77773,031221,038,278671,08873,08322
18.CPRICapriNusaSatuPropertiTbk.505007/305007/305007/3040.0001221397441713974517
17.COWLCowellDevelopmentTbk.505007/135007/135007/1338.462244100.512251132
16.CITYNaturaCityDevelopmentsTbk.[S]525507/305007/215307/3045.8332861,62684347191,6438534819
15.BSDEBumiSerpongDamaiTbk.[S]74079507/0967007/2169007/30140.05714,6081,061,729784,73863,300221,085,961802,59963,34722
14.BKSLSentulCityTbk.[S]505007/305007/305007/303.4553,354115,9385,79786622143,2266,94388822
13.BKDPBukitDarmoPropertyTbk.[S]596407/215007/305007/3041.6673761,942102401201,94210240120
12.BIPPBhuwanatalaIndahPermaiTbk.[S]508007/305007/017107/3025.4383577,8974511,120227,8974511,12022
11.BIKABinakaryaJayaAbadiTbk.18719807/1616007/1319007/3018.90011310318234211031823421
10.BESTBekasiFajarIndustrialEstateTbk.[S]11413607/1611107/0212307/3073.5291,1871,048,127131,09035,098221,055,227132,01935,10522
9.BCIPBumiCitraPermaiTbk.[S]506107/175007/305007/3045.4557190,7534,9164,2502290,7534,9164,25022
8.BBSSBumiBenowoSuksesSejahteraTbk.[S]14715107/0712207/2912807/30107.500614169,26124,07425,24622208,88629,48225,26422
7.BAPIBhaktiAgungPropertindoTbk.[S]505007/305007/305007/3033.33328068134106229,66934913822
6.BAPABekasiAsriPemulaTbk.[S]505107/305007/305007/3033.33333145723914672410
5.ASRIAlamSuteraRealtyTbk.[S]12914107/1612207/3012307/30120.0002,4171,470,766193,04442,335221,471,767193,18942,33922
4.ASPIAndalanSaktiPrimaindoTbk.[S]36838007/0322607/2824007/30243.810163271,41079,87027,80222333,967100,00727,81222
3.ARMYArmidianKaryatamaTbk.[S]50----5003/2616.667450--------
2.APLNAgungPodomoroLandTbk.[S]11412407/1611007/0611707/3032.3292,656648,16976,11426,11722660,99877,56426,11922
1.AMANMakmurBerkahAmandaTbk.[S]19619707/0219507/3019607/30177.2737595,4351,063216225,6991,11521722
61241,46921,553,1285,541,773972,24028,240,4226,998,947973,171
6.285,04127,916,39210,018,5931,476,66635,181,03711,555,5601,477,804
1.80.6671,07811,0162,6052,6672211,0162,6052,66722
591,07811,0162,6052,66711,0162,6052,667
6.148.4622,396853,547345,22556,23122857,547346,84156,23222
3.53.0776917943148191794314819
37807/2938007/30
OTHERS
2.78.1822586951752432269517524322
5.73.000120152,59215,50524,58618152,92315,53824,60418
4.11.9658319315136191931513619
24007/17258
1.125.000413112,53022,7609,33822125,81825,5499,34222CBMFCahayaBintangMedanTbk.[S]20622807/0818607/1622007/30
20
10,7674212](https://image.slidesharecdn.com/7idxmonthlystatisticsjuli2020-201227101938/85/7-idx-monthly-statistics-juli-2020-34-320.jpg)
![31IDX MONTHLY STATISTICS, JULY 2020
DATA SERVICES | INDONESIA STOCK EXCHANGE
TableTradingbyIndustry
IndustryClassification/StockName
Board
PriceIndivi-
dual
Index
Market
Cap.,
b.IDR
RegularMarketTotalMarket
Prev.
Freq.,
xDays
Volume,
th.share
Value,
m.IDR
Freq.,
x
Days
Volume,
th.share
Value,
m.IDRHighDateLowDateCloseDate
1
2
2
1
2
1
1
2
2
1
1
2
1
2
2
2
1
2
2
2
2
1
2
1
1
2
1
2
1
1
1
1
1
2
2
2
2
2
2
1
1
SMRASummareconAgungTbk.[S]58566007/0356507/2060007/30
TARASitaraPropertindoTbk.[S]19819207/137607/307607/30
1,29570,080
07/30
07/27
CityRetailDevelopmentsTbk.15014807/30131
424
3,297
60422
07/2441207/30
KBAGKaryaBersamaAnugerahTbk.[S]39243007/1734207/2237407/30
2,85007/01
RODAPikkoLandDevelopmentTbk.[S]515207/175007/305007/30
JRPT
29207/07
33.333
RIMORimoInternationalLestariTbk.[S]50----5003/31
07/01
07/15
43,25618,1396,5642243,25618,1406,56522
INPPIndonesianParadisePropertyTbk.[S]650705
65115107/30INDORoyalindoInvestaWijayaTbk.[S]109214
6868911707/03907,257686604
10207/07
07/0210222
4,129871856
JayaRealPropertyTbk.[S]40845407/03404
07/305007/30
76,64022
205222220522
30,17122
2,254--------
73
07/30
26135007/295007/29
20,379
75
5003/31
22
22
LPKRLippoKarawaciTbk.[S]171172
2,84522
-
16,37314,988
07/30668.29334,8561,0615,2303,296221,0615,230
22
---
62,77829,508222,368,455569,73629,51822
105.427768----
230
22
50
22007/2823407/28
22
15
18421
251051717,749
423
07/0739007/29
-
12
19,17015,9585,54222
MPROMahaPropertiIndonesiaTbk.880
22
15,9585,54322
1,352,53677,66223,230121,354,93677,831
423,221
19,170
51520
7912,30007/282,70007/30
50
789907/177407/297707/30
POSA
07/3032.308
21,5201,025
224,912
---642------
226,208
822,50676,626221,376,302837,392
50
14
65.50.0003321,811,90892,545
70.
8,09622815
47723022
96
RISEJayaSuksesMakmurSentosaTbk.[S]46049007/1539007/30
68.79.8346806,208311444
62.1,634.604PWONPakuwonJatiTbk.[S]416438
64.65
22396,768132,7813,86222
REALRepowerAsiaIndonesiaTbk.[S]525807/075007/305007/3030,168221,904,413
3,059,3251,287,652130,797
63.15.9941335732613573
6514813
22
8
97,319
311444
07/1640407/13
60.108.1083,0841,313,02068,11520,312221,526,61076,811
61.29.1867711827751511827
07/3059.
39007/3067.240.4913,8818,8864,0043,860
PUDPPudjiadiPrestigeTbk.[S]248
07/23
69.42.73563492741,08724
PPROPPPropertiTbk.[S]5055
20,4202,491,8181,051,320130,76222
50
07/29
RDTXRodaVivatexTbk.4,9505,35007/304,95007/105,35007/30266.0431,43813
BlissPropertiIndonesiaTbk.505007/30
22760143
419131773211317
58.POLLPolluxPropertiIndonesiaTbk.[S]5,9006,12507/034,00007/304,190
55.79.000241183,66415,45214,98622197,312
28151520250281POLIPolluxInvestasiInternasionalTbk.1,2151,20007/151,06507/271,14007/30
51.40.00056-------
PLINPlazaIndonesiaRealtyTbk.[S]2,330
-
52.12016
50.
07/0619207/1419907/3051.249466113882161
54.15.132551---
53.80.455435760143423
----
07/2314807/30
270
56.1,004.1919,58533279118421332
NZIANusantaraAlmaziaTbk.[S]212240
PAMGBimaSaktiPertiwiTbk.[S]
90007/2783007/301071831
--
NIRO
57.66.0552,292250
55
44.
138821
45.MKPIMetropolitanKentjanaTbk.[S]15,80014,70007/2214,70007/2214,70007/22700.00013,93822883841,332125
46.MMLPMegaManunggalPropertyTbk.[S]18819607/2417807/14188
23,233
48.163.9682,985147567918148,35871,050370
49.MTSMMetroRealtyTbk.[S]220
47.677.2738,252
OMREIndonesiaPrimaPropertyTbk.[S]316----31606/26
MTLAMetropolitanLandTbk.[S]40440007/17340
41.LPCKLippoCikarangTbk.[S]85589007/0778007/2981507/3093.5802,184
42.
MDLNModernlandRealtyTbk.[S]626607/215007/065207/3015.432652
44.8859,784
MYRXHansonInternationalTbk.50--
07/0916507/2319807/30
43.MABAMargaAbhinayaAbadiTbk.50--5002/26
40.LCGP
7,064224,007143,08310,88322292,607186,24110,8882207/30
13807/30
36.378.0002,674
-
37.KIJAKawasanIndustriJababekaTbk.[S]14415907/3013607/0115907/304.8923,31130,8104,4362,94422947,774134,060
38.325.000
EurekaPrimaJakartaTbk.[S]-
3,07022
11403/3191.200
659,440262,58793,45622725,500288,08393,46022
86022
114-
1,032
KOTA
39.LANDTrimitraPropertindoTbk.21425807/0218607/2820407/3048.462570
DMSPropertindoTbk.[S]65067507/3061007/20670
35.396.1545,665
07/0757007/0370007/30
32,1545,2737,3522232,1545,2737,35222
34.666.6677,8273572372802035723728020
32.GWSAGreenwoodSejahteraTbk.[S]07/3043.6007967,257
33.130.000
139.0483,28523,0573,28411414154,15721,385
14,554
13,2252,84322130,36724,559
-34.0994,335---
66.27.451
5007/29
72.76.4157651,6412022231446,650
12.543
71.1,002.3008,6561,352,046
10507/088307/1410007/30
SATUKotaSatuPropertiTbk.505007/295007/2950
SMDMSuryamasDutamakmurTbk.
RBMSRistiaBintangMahkotasejatiTbk.[S]
680
13507/21
MYRXPHansonInternational(SeriB)Tbk.50----5003/31
90
21](https://image.slidesharecdn.com/7idxmonthlystatisticsjuli2020-201227101938/85/7-idx-monthly-statistics-juli-2020-35-320.jpg)
![32
DATA SERVICES | INDONESIA STOCK EXCHANGE
IDX MONTHLY STATISTICS, JULY 2020
TableTradingbyIndustry
IndustryClassification/StockName
Board
PriceIndivi-
dual
Index
Market
Cap.,
b.IDR
RegularMarketTotalMarket
Prev.
Freq.,
xDays
Volume,
th.share
Value,
m.IDR
Freq.,
x
Days
Volume,
th.share
Value,
m.IDRHighDateLowDateCloseDate
2
2
1
1
2
1
1
1
2
1
1
1
2
1
2
1
1
1
1
1
1
2
2
2
1
2
1
1
2
1
1
1
2
1
2
1
ENERGY
PGASPerusahaanGasNegaraTbk.[S]1,1351,28007/301,11007/031,26507/30
TOLLROAD,AIRPORT,HARBORANDALLIEDPRODUCTS
JSMRJasaMarga(Persero)Tbk.[S]4,4004,57007/033,90007/303,93007/30
TELECOMMUNICATION
BUILDINGCONSTRUCTION
WIKAWijayaKarya(Persero)Tbk.[S]1,2001,30007/151,15007/011,19007/30
POWRCikarangListrindoTbk.[S]58573007/2957007/2865507/30
07/30
07/295007/295007/29
URBNUrbanJakartaPropertindoTbk.[S]1,6051,60507/061,36507/301,36507/30
KOPIMitraEnergiPersadaTbk.[S]51052507/1349007/0850507/30
CASSCardigAeroServicesTbk.[S]18826007/3017907/2022007/30
504,6336,940,6154,556,613
METANusantaraInfrastructureTbk.[S]10511507/3010207/0111207/30
SSIASuryaSemestaInternusaTbk.[S]39040007/0336007/1737607/30
TAMA
PTPPPP(Persero)Tbk.[S]8701,07507/2485507/0197507/30
SKRNSuperkraneMitraUtamaTbk.[S]55067507/2852007/0162007/30
07/0164
RAJARukunRaharjaTbk.[S]10913107/2310707/0111907/30
KARWICTSIJasaPrimaTbk.[S]505907/2950
4,476,820504,426
71507/2965507/0671007/30
60,19327,234
3,72810,51522
44,04821,08922101,704
92,84631,16422
190,629
374,47612,344,90410,142,153705,46212,787,49411,254,621
07/305007/30
LancartamaSejatiTbk.16020007/2215007/2216407/30
07/066807/30
25.976786101,704
44,89022
8,242908908228,60094390922
1.BTELBakrieTelecomTbk.50----5003/3146.9131,841--------
7.127.8541,7999101,2805912
3.
13355018
6.33.6291,984
5.
73
4.235.28728,523151,030644,90857,43422165,406707,87357,49422
TEBEDanaBrataLuhurTbk.[S]1,5651,83007/081,29507/091,40007/27
705,823
44,04821,08922
124,287136,5016312
8.464292,531133549182,531
IPCCIndonesiaKendaraanTerminalTbk.[S]45045207/1441607/1443207/30
7237,165526,424753,381108,090664,535951,603108,156
8.34.50018784,2565,9638,32622100,166
22
2.CMNPCitraMargaNusaphalaPersadaTbk.[S]1,4901,50007/0798007/3099007/30100.4733,5851,5741,912817221,5741,91281722
1.54.000459260,43360,19327,234
7,0508,32822
22260,433
TGRATerregraAsiaEnergyTbk.[S]7979
5.410.00030,6662,659,4113,154,312197,805222,736,8603,240,688197,89822
4.26.000422,0731117362263,347738223,175
39,58822
7.415.636503350,85641,55223,71322350,85641,55223,71322
6.43.66710,537485,273302,33239,58022567,772351,565
1.87.8791,41548,16316,3402,4852248,36316,4022,48622
7143,9003,630,6643,520,930273,1193,868,0013,660,753273,226
3.LAPDLeyandInternationalTbk.[S]50----5006/2692.782198--------
2.127.8483526323194742263832247522
348398
7.632,72929,675,32122,351,4132,781,94033,058,26024,334,9602,782,826
18.178.1388,4841,374,133965,68991,733221,381,370970,95791,76422
17.309.72610,674789,576970,87393,91422796,749979,63593,94722
WSKTWaskitaKarya(Persero)Tbk.71075507/0362007/30625
INFRASTRUCTURE,UTILITIESANDTRANSPORTATION
16.68.6211,857937,369190,06644,88522939,869
15.108.5451,037273,12392,83831,16322273,141
14.TOPSTotalindoEkaPersadaTbk.[S]505007/305007/305007/3080.4751,6671,0725425120465,240
TOTLTotalBangunPersadaTbk.[S]32837807/1429607/3030407/30
WEGEWijayaKaryaBangunanGedungTbk.[S]19121807/0918707/0119407/30
13.93.71416451780613225178061322
12.155.8971,769601,133227,82633,44922601,623228,01733,45122
22,46428521
9.59.1671,06570487587048758PBSAParamitaBangunSaranaTbk.[S]
8.36.94177920,0197,1193,4182220,019
1,646,520134,46322
11.90.00093030,51118,6131,5772230,55118,6411,58022
10.188.9106,045
NRCANusaRayaCiptaTbk.[S]34838007/1430607/2731207/303,41822
655
7.131.892188--------
6.279.7625,8716,2332,1325672019,977
5.15.00037731,2405,8631,9642231,2405,8631,96422
JKONJayaKonstruksiManggalaPratamaTbk.[S]40041007/0831807/2336007/306,88257320
--24403/31
20222007/1615407/06188IDPRIndonesiaPondasiRayaTbk.[S]07/30
MTRAMitraPemudaTbk.[S]244--
1.11.84218651,13114,5768,3302295,46326,3698,33222
356,69047,56622
ACSTAcsetIndonusaTbk.[S]25631207/2225407/0226607/30
1243318
3.17.0006764,6303,72710,5142264,659
ADHIAdhiKarya(Persero)Tbk.[S]61069007/0360007/3060007/302.494.7662,137534,765342,36747,55522557,181
CSISCahayasaktiInvestindoSuksesTbk.[S]506807/165007/305107/30
DGIKNusaKonstruksiEnjiniringTbk.[S]5050
6243,5726,363,264
26607/30
4.22.22227729127174,789
73.134.0001,163423,548114,97829,63322423,548114,97829,63322
74.117.9174,4123,9696,074493227,63211,46649722
TRINPerintisTrinitiPropertiTbk.[S]27028807/2126207/30
07/30
7,119
1,647,7131,634,946134,391221,658,158
MPOWMegapowerMakmurTbk.556107/095107/305107/30
07/3030007/13386KEENKencanaEnergiLestariTbk.[S]](https://image.slidesharecdn.com/7idxmonthlystatisticsjuli2020-201227101938/85/7-idx-monthly-statistics-juli-2020-36-320.jpg)
![33IDX MONTHLY STATISTICS, JULY 2020
DATA SERVICES | INDONESIA STOCK EXCHANGE
TableTradingbyIndustry
IndustryClassification/StockName
Board
PriceIndivi-
dual
Index
Market
Cap.,
b.IDR
RegularMarketTotalMarket
Prev.
Freq.,
xDays
Volume,
th.share
Value,
m.IDR
Freq.,
x
Days
Volume,
th.share
Value,
m.IDRHighDateLowDateCloseDate
1
1
1
2
1
2
1
1
2
1
1
1
1
2
2
2
1
2
1
2
2
2
2
1
2
1
2
2
2
3
1
1
2
2
2
2
2
2
1
1
TRANSPORTATION
FRENSmartfrenTelecomTbk.[S]9716807/279407/0114307/30
ISATIndosatTbk.[S]2,3502,64007/142,21007/302,30007/30
BBRMPelayaranNasionalBinaBuanaRayaTbk.
1,15507/2491507/211,115
18
29
23007/21
22
22
3,105,589
550
50
52063507/14
146
27.083
SOCISoechiLinesTbk.12314807/2712007/0112107/30
CANI
1,4073417761934
1,052,052
53,56212,2122251,45454,11712,21522
16,54522250,586119,63116,54822
---
07/30100.000
--
1,09007/30
07/30
544.554
260284
184
07/0219007/30
IPCM
HITS
CapitolNusantaraIndonesiaTbk.[S]
2819
9,565
121
BlueBirdTbk.[S]
HELIJayaTrishindoTbk.[S]
HumpussIntermodaTransportasiTbk.
KJEN
07/30
12,86412,91022
1,1001,10007/231,10007/231,10007/23
7
--5006/26
1,139,664
69,29622
07/09
07/30
18523007/08
6907/277807/30
17
21.739268
958,256100,316
275,043
--184
1481793
33.3386,3161,051,648
--
3,00007/303,05007/30
5007/30
07/17124
19502130,714
--
02/25
-
6,1664,435
846,16281,78122
7807/30
200
24007/0124407/30
22
21,183
3,3764,759
28
07/20
8292210,7281,80682922
9147187,37533,7749,5659187,375
41007/01500
KridaJaringanNusantaraTbk.[S]
66,60025,77522
07/2419307/30
1,539
31607/0141607/30
07/3016.000511,482170140
JasaArmadaIndonesiaTbk.[S]202
6718757
318
1,85322
72
179172204,164
21281
07/295007/29MIRAMitraInternationalResourcesTbk.[S]505007/2950
28151,297,344
142258
557
1776
33,774
0.20
221,482
MBSSMitrabahteraSegaraSejatiTbk.[S]
17421
76,37635
07/1616407/30
JAYAArmadaBerjayaTransTbk.[S]
18
18.
24.PORTNusantaraPelabuhanHandalTbk.[S]44069519
11321132
22.22.06219840.2028194
55,22421,1839,8082255,224
7.806202139
76.78628928137211
11.58.66797128,48111,90312,90822139,5208607/30
43407/28
23.
9,80822
1447
17014007/2811207/0220.LRNAEkaSariLorenaTransportTbk.[S]122150
21.
07/305007/305007/30
26.125728
3721121
19.
PSSIPelitaSamuderaShippingTbk.[S]16918207/0916007/1717007/3026.127.40792110,7281,806
25.PPGL*PrimaGlobalindoLogistikTbk.11019807/3012107/2019607/30178.200
9.62.0001039313
17.
16.56.8421,1107,1581,5391,853227,158
38.462535955
39,7453,3764,7592239,745
AirAsiaIndonesiaTbk.[S]
GIAAGarudaIndonesia(Persero)Tbk.24628407/1612.
13.181.8181642,854663324222,854
CMPP
DEALDewataFreightinternationalTbk.[S]9210507/278107/22
14.
15.
19607/0321007/30
--
274,94169,29122
49607/2351507/293,657308792.308
3.
8.BULLBuanaLintasLautanTbk.[S]30835607/1029807/0332407/3031.2933,8382,883,353908,380100,269
10.34.8061,966--------
22
22
22
22
7.75.0001213812829422381
6.0.6581,2973765007/30
BataviaProsperindoTransTbk.788507/137007/28
62BLTABerlianLajuTankerTbk.50
BPTR
13148
501,004
223,055,733
28294
1.108.0001943,5321,0201,378226,9002,5271,38222
7459,8488,043,8562,908,1761,139,5339,817,959
BIRD
4.BESSBatulicinNusantaraMaritimTbk.23029007/1421807/1725207/30243.81085710,0282,4524,4342227,385
1,818242,432115,9642.ASSAAdiSaranaArmadaTbk.40257007/2339807/0653507/30133.333
5.17.3082,79050,955
6.1,576.582302,1402,536,2627,819,489335,852222,872,2368,861,285336,12722
3.8.50031,1698,605,7671,172,563205,910228,611,8621,173,300205,92422
4.167.14312,498115,174285,95144,35822115,972287,90844,36822
JASTJasnitaTelekomindoTbk.[S]11211507/017607/307707/30
TLKMTelekomunikasiIndonesia(Persero)Tbk.[S]3,0503,190
2.EXCLXLAxiataTbk.[S]2,7703,07007/062,41007/302,50007/30128.90726,765288,400785,90081,72422309,773
5.32.52063799,30178,24937,61822877,65185,96737,62322
AKSIMamingEnamSembilanMineralTbk.[S]54555007/0116107/29270
07/30
07/305007/305007/30
NELYPelayaranNellyDwiPutriTbk.[S]13914007/0211907/23123
889407/09
28.PURAPutraRajawaliKencanaTbk.[S]9514507/089107/0613007/30121.9056892,298,499274,482615,216222,403,672287,461615,24522
27.17.263908014471580
30.19.3301195,7671,083811215,7671,08381121
29.RIGSRigTendersIndonesiaTbk.[S]20224007/1620007/0322607/3092.60413864414225821644
SAFE
15
21
SteadySafeTbk.19120007/17170
32.27.53657379195116379195116
31.900.0001,875571212810257
34.1,043.422832119,47429,12215,92822119,47529,12215,92922
33.421.4291,60511,8877,0152,7212211,887
2910
7,0152,72122SHIPSilloMaritimePerdanaTbk.55560507/2255007/0159007/30
SMDRSamuderaIndonesiaTbk.[S]19028807/2919307/0125407/30
07/3007/3050
35.23.636854498,67266,60025,77522498,672
07/30
IATAIndonesiaTransport&InfrastructureTbk.[S]5050
LEADLogindoSamudramakmurTbk.5050
PTISIndoStraitsTbk.17518907/07159
324
2,049
SDMUSidomulyoSelarasTbk.[S]505007/3050
SAPXSatriaAntaranPrimaTbk.[S]1,8502,34007/101,80007/072,25007/30
663](https://image.slidesharecdn.com/7idxmonthlystatisticsjuli2020-201227101938/85/7-idx-monthly-statistics-juli-2020-37-320.jpg)
![34
DATA SERVICES | INDONESIA STOCK EXCHANGE
IDX MONTHLY STATISTICS, JULY 2020
TableTradingbyIndustry
IndustryClassification/StockName
Board
PriceIndivi-
dual
Index
Market
Cap.,
b.IDR
RegularMarketTotalMarket
Prev.
Freq.,
xDays
Volume,
th.share
Value,
m.IDR
Freq.,
x
Days
Volume,
th.share
Value,
m.IDRHighDateLowDateCloseDate
2
1
2
1
2
2
2
1
1
2
2
2
1
2
1
2
2
2
1
2
2
1
1
1
2
2
2
2
2
1
2
1
1
1
1
1
1
2
TNCATrimudaNuansaCitraTbk.[S]17525007/0314507/1520407/30
NONBUILDINGCONSTRUCTION
PPREPPPresisiTbk.[S]19021407/1617407/3017407/30
PTPWPratamaWidyaTbk.[S]1,0601,60007/211,05007/061,58507/30
FINANCE
SUPRSolusiTunasPratamaTbk.4,8504,65007/154,65007/154,65007/15
MTPSMetaEpsiTbk.[S]13814707/2813007/2114007/30
OASAProtechMitraPerkasaTbk.[S]38839007/2235007/2935007/29
19707/30
IBSTIntiBangunSejahteraTbk.[S]8,200
GOLDVisiTelekomunikasiInfrastrukturTbk.[S]21023607/0216907/23
TRUKGunaTimurRayaTbk.[S]11213907/0910907/0711507/30
TBIGTowerBersamaInfrastructureTbk.1,1051,35007/291,06007/021,29007/30
8,20004/17
GHONGihonTelekomunikasiIndonesiaTbk.[S]1,9751,95007/021,45007/301,55007/30
5,5544,41922
1,88722
13,12721
767
66,906
TCPI
BBYBBankYudhaBhaktiTbk.23831007/3023407/01300
20019
370,121
BBNIBankNegaraIndonesia(Persero)Tbk.4,5804,86007/094,510
20,120,24137,425,2062,047,488
5,864
3,610,832
07/28
32607/1337207/30178.846372500179171
07/20
44.06329291712727522917
320.98829,2281,091,2711,283,56659,718221,235,2201,457,28159,78922
448,89596,97122
3,625,083421,51522
47,454,7942,449,827
2,1961710
7,8356,28322
13848122
415,087
131,80319,89122
17917118
1,750225
18,812
3,661
11,256,875
1
71222
100,125
07/14
4,60007/30
AGRSBankIBKIndonesiaTbk.9618807/2893
22
15507/30
36.TAMUPelayaranTamarinSamudraTbk.[S]646907/015207/305507/30502.5132,063172,02310,51012,86122180,64810,97612,86222
39.TMASTemasTbk.[S]12513207/0210007/2011107/30271.40263366,2357,8356,2832266,235
38.2,862.31919,550281,4771,102,250212,09922296,2971,143,964212,10122
37.8.9293071055138TAXI
42.50.4355077,1259,6556,7222277,1259,6556,72222
41.142.60990642613848122426
40.136.000867411243192274112432022
TPMATransPowerMarineTbk.[S]28036007/2728007/0134407/30
44.WINSWintermarOffshoreMarineTbk.[S]9110207/308507/069907/3027.0434208,553786254218,55378625521
43.WEHAWEHATransportasiIndonesiaTbk.[S]999907/017307/237607/3033.6136712,3821,0073,8392212,3821,0073,83922
2.112.7121,8481,2949101,071221,294
5,362,394555,957
1.1,062.5003,502107901271821417112818
75117,3415,129,4735,026,774555,7365,920,270
9101,07122
BALIBaliTowerindoSentraTbk.[S]79589507/0179507/2189007/30
BUKKBukakaTeknikUtamaTbk.[S]76080007/0363507/2770007/30
5.104.7342521,708307456221,70830745622
4.132.4798531081741481710817414817
3.CENTCentratamaTelekomunikasiIndonesiaTbk.[S]8112107/297907/0211007/30729.6003,430422,17541,97611,46922958,79492,45511,47222
6.881.91011,077-----
13.
9.184.2111264,8041,7502254,804
8.
10.41.8601,779256,90650,17540,93222266,327
7.LCKMLCKGlobalKedatonTbk.[S]36637207/30
----
18500
14.TOWRSaranaMenaraNusantaraTbk.
AGROBankRakyatIndonesiaAgroniagaTbk.122268
11.234.6151,39292,914131,80319,8912292,914
3.AMARBankAmarIndonesiaTbk.29258007/0729207/0237407/30216.0922,97513,1935,5544,41922
12.142.8145,2900.100.47110.10
2.146.3641,7295,8647671,88622
31,914,705
1,904,783BANK
6.249.1982,9545,2192,0567082249,819
5.BABPBankMNCInternasionalTbk.505007/305007/305007/3057.3881,25311869322270,601
12107/0323207/30
BACABankCapitalIndonesiaTbk.41442207/3027007/2842207/30
2,231,795
7.BBCABankCentralAsiaTbk.28,47531,32507/0828,37507/0131,20007/3017,528.571761,544300,6059,166,768
5,192.20757,9023,256,772
4.ARTOBankJagoTbk.1,7703,40007/031,79007/012,80007/3013,960.28630,09424,24666,45413,11821
1,0201,15007/301,00507/011,13507/30
1.392.1064,9022,231,795448,89596,96922
8.2,137,92724,690,40139,314,1092,446,804
81
9.BBKPBankBukopinTbk.18519207/2717607/2217807/3053.6762,3401,115,083205,40640,790221,792,548326,49840,88822
8.BBHIBankHardaInternasionalTbk.7919507/077507/0113007/30106.40053920,4033,0284,0612220,4034,061223,028
11.22.07684,9261,042,7624,870,230228,054221,093,6145,108,631228,14822
10.BBMDBankMestikaDharmaTbk.1,2601,65007/091,26007/011,45507/30105.7975,89281118197192,581
13.BBTNBankTabunganNegara(Persero)Tbk.1,2451,36507/091,22007/061,26507/30167.60913,2621,713,2742,218,632137,678221,724,1382,232,651137,72022
12.BBRIBankRakyatIndonesia(Persero)Tbk.3,0303,25007/143,03007/203,16007/303,565.714385,8753,111,2909,710,945369,80922
14.305.4371,9799,1612,594829219,16107/30
BCICBankJTrustIndonesiaTbk.45070007/2956007/2870007/29
2,59482921
15.52.4876,9380.400.24320.400.2443
43,903,2842,049,976
12727522
---
3,515,717421,45522
12,663,275204,90222
24,420
52,15441,01822
17,5749822
13,193
203,46522
3,357,471
22,297,106
0.471
07/305007/305007/30
TranscoalPacificTbk.[S]4,6504,66007/013,02007/153,91007/30
ExpressTransindoUtamaTbk.5050](https://image.slidesharecdn.com/7idxmonthlystatisticsjuli2020-201227101938/85/7-idx-monthly-statistics-juli-2020-38-320.jpg)
![35IDX MONTHLY STATISTICS, JULY 2020
DATA SERVICES | INDONESIA STOCK EXCHANGE
TableTradingbyIndustry
IndustryClassification/StockName
Board
PriceIndivi-
dual
Index
Market
Cap.,
b.IDR
RegularMarketTotalMarket
Prev.
Freq.,
xDays
Volume,
th.share
Value,
m.IDR
Freq.,
x
Days
Volume,
th.share
Value,
m.IDRHighDateLowDateCloseDate
1
2
2
1
1
1
2
2
1
1
1
1
1
1
1
2
1
1
1
1
1
1
1
1
1
1
1
1
1
1
2
1
2
1
2
2
2
1
2
1
NISPBankOCBCNISPTbk.73575007/1670007/3070007/30
FINANCIALINSTITUTION
PNBNBankPanIndonesiaTbk.81590007/1377507/1080507/30
07/1631407/30
MCORBankChinaConstructionBankIndonesiaTbk.13815707/1313207/2913707/30
07/3088007/30
262198
BankQNBIndonesiaTbk.
DNARBankOkeIndonesiaTbk.16932007/0721007/0224007/30
FUJIFujiFinanceIndonesiaTbk.10611907/2410207/3010407/30
BVICBankVictoriaInternationalTbk.687607/065707/235907/30
FINNFirstIndoAmericanLeasingTbk.50----5003/31
115216
2160,574
36,405
154,737
1,161
115,3341,777
07/305007/30
22
5,492,780
82421
1,26622
10,567
740,106679,49086,17522
1,029,965153,84422
437,067
73007/30
BDMNBankDanamonIndonesiaTbk.2,690
07/30
129.0708,176787,589436,57979,12022788,468
670
82,55442,774
-----
60,5746,265210
22
07/30
BINABankInaPerdanaTbk.94594507/01820
22
BPDBantenTbk.50
206
7,289
33,660
18.49.51555393,0065,0574,9642293,0665,0604,96522
16.1.54726,51228,91280,83312,4712233,73994,96112,48422
07/30217.3063,1739,06345338822
2,90007/082,70007/202,740
505007/305044422
19.477.4124,92617,10214,6931,2652240,702
17.BEKS
BGTGBankGaneshaTbk.506407/075007/305007/30
190.0006957,0792,09157622
23.83.750BMASBankMaspionIndonesiaTbk.24437007/1025007/30
21.
264
20.BJBRBPDJawaBaratdanBantenTbk.7601,04007/2875507/0393507/30160.8339,107726,421664,63486,15022
BKSW
27.BNIIBankMaybankIndonesiaTbk.16107/302.52614,921154,73733,66010,56522
24.1,717.556267,960901,2954,813,823153,66122
79,13522
22.174.3921,5582,041152871222,04115287122
2,15257822
26.BNGABankCIMBNiagaTbk.72093507/1072007/0177007/305.75919,158299,780248,19038,63522398,443324,49338,701
BMRIBankMandiri(Persero)Tbk.4,9506,00007/284,90007/035,80007/30
25.
07/30
29.107.8435,1946,334,9333,026,976416,546226,335,194
28.BNLIBankPermataTbk.1,2701,28507/221,24507/291,27007/3013.77335,258195,716248,9366,47522196,393249,7986,49022
30.BSIMBankSinarmasTbk.54553507/0348607/0251507/30351.2518,89128714724622
BRISBankBRIsyariahTbk.[S]30861507/2930407/0254007/303,027,107416,553
40.854.29715,9012,1481,554856222,5481,85286822
94,34043
38.120.1885,143374,19454,75514,48722375,76454,97214,48822
-
32.441.38018,4712,4255,3791,704222,4255,3791,70422
31.1,306.6532,406--
34.59.57352318,2511,1662,6332218,2511,1662,63322
33.351.795
BTPNBankBTPNTbk.2,1602,45007/302,12007/012,29007/30
39.
37.MAYABankMayapadaInternasionalTbk.6,5006,50007/136,50007/136,50007/132,955.392
36.INPCBankArthaGrahaInternasionalTbk.505407/065007/305007/300.2917823,765191770223,82519477122
35.230.9092,10953914722119539
3315,593
252
14722119
64181,6544,683.35446,1912521,654
8225,393717,828208,79144,180758,337
11521614
2,2566,82422
44.SDRABankWooriSaudaraIndonesia1906Tbk.71580007/2770007/1476007/29850.0644,95112192102171219210217
43.
42.1,340.32619,189258,631215,60322,66222264,239220,08722,67722
41.208.0003,20714NOBUBankNationalnobuTbk.79080007/2168007/21
PNBSBankPaninDubaiSyariahTbk.[S]505407/2750
2.BBLDBuanaFinanceTbk.39639407/0933207/0638207/24151.8136291,43753275131,4455347614
1.ADMFAdiraDinamikaMultiFinanceTbk.7,2008,02507/297,00007/077,90007/30343.0117,9003,00822,7744,285223,00822,7744,28522
4.1,365.0422,2820.600.77210.600.7721
5.14.86876128,2805,4341,2002228,7805,5321,20122CFINClipanFinanceIndonesiaTbk.20622007/2718507/2019107/30
3.BFINBFIFinanceIndonesiaTbk.28232607/3025807/2229007/301,404.1204,630452,432127,40922,50822456,732128,63122,51722
07/281,28007/281,28007/28
6.3,582.7551,227443795430212,123
6,26521021
9.HDFARadanaBhaskaraFinanceTbk.13920407/2113007/0915407/3088.88693963982206398220
8.94.545115
3,8024312107/30DEFIDanasupraErapacificTbk.1,8001,81507/071,78007/301,785
11.49.2001,419144,10137,57510,64622175,60154,90010,65122
10.22.05747618658246186
7.47.61993--------
IBFNIntanBarupranaFinanceTbk.30031407/30290
IMJSIndomobilMultiJasaTbk.26829407/2223607/0324607/30
22286,444937,53182,31222
27222
67020682421
43,96717
26,312263,943864,51282,276
232,84644,202
50.0001,18644,2352,2516,8222244,334
BJTMBPDJawaTimurTbk.500
BSWDBankofIndiaIndonesiaTbk.1,750----1,75003/31
07/0930407/30
55007/30
MEGABankMegaTbk.6,5506,70007/306,20007/206,70007/30
BTPSBankBTPNSyariahTbk.[S]3,1803,53007/293,08007/073,45007/30
07/2815907/08
64507/2849807/03
688807/076507/017707/30
BNBABankBumiArtaTbk.28835807/08282
6418
24586
BPFIBataviaProsperindoFinanceTbk.1,1851,280](https://image.slidesharecdn.com/7idxmonthlystatisticsjuli2020-201227101938/85/7-idx-monthly-statistics-juli-2020-39-320.jpg)
![36
DATA SERVICES | INDONESIA STOCK EXCHANGE
IDX MONTHLY STATISTICS, JULY 2020
TableTradingbyIndustry
IndustryClassification/StockName
Board
PriceIndivi-
dual
Index
Market
Cap.,
b.IDR
RegularMarketTotalMarket
Prev.
Freq.,
xDays
Volume,
th.share
Value,
m.IDR
Freq.,
x
Days
Volume,
th.share
Value,
m.IDRHighDateLowDateCloseDate
2
2
2
2
2
1
2
1
1
1
1
2
2
2
2
2
1
2
1
2
2
2
1
1
2
2
1
2
2
2
1
2
2
2
2
1
1
1
5,45007/074,10007/304,10007/30
OTHERS
GSMFEquityDevelopmentInvestmentTbk.12513007/019007/2110907/30
LPPSLippoSecuritiesTbk.839207/107107/247507/30
POLAPoolAdvistaFinanceTbk.535807/015007/285107/30
SECURITIESCOMPANY
PADIMinnaPadiInvestamaSekuritasTbk.505007/305007/305007/30
INSURANCE
PNLFPaninFinancialTbk.18419407/1317507/0618507/30
SMMASinarMasMultiarthaTbk.18,30018,40007/0215,20007/2417,20007/30
TRUSTrustFinanceIndonesiaTbk.34835007/2331407/2334007/29
RELIRelianceSekuritasIndonesiaTbk.31231207/1428007/3028007/30
MFINMandalaMultifinanceTbk.8651,12507/0985007/081,00507/30
2015,26133,08826720
618621
224198
JMASAsuransiJiwaSyariahJasaMitraAbadiTbk.[S]19726007/0818207/0721807/30
ASMIAsuransiKresnaMitraTbk.1,2301,23007/091,14007/201,170
MREI
07/1314407/3014807/30
BPIIBataviaProsperindoInternasionalTbk.10,00010,00007/23
21
07/30
2,2693,78722
VICOVictoriaInvestamaTbk.9111507/016907/307307/3056.8006681,718134
WOMFWahanaOttomitraMultiarthaTbk.
TrimegahSekuritasIndonesiaTbk.11912707/2011107/01115
TIFATifaFinanceTbk.23044007/23226
22
22
21
1,25321,1581,1052112,016201,3351,12421
112,000.000
49,834
3,8831,59022
13.39.2591391,80394500221,8039450022
12.1,020.5132,6631,1791,107531223,184
15.400.0002723120831208
14.
17.33.95973812,1392,8361,9142212,6522,9131,91522
16.VRNAVerenaMultiFinanceTbk.12513507/069407/1711807/30104.9296711551616321157
201.00043812,0253,8831,5902207/0140607/30
19307/0121207/3020626007/28
1.AMORAshmoreAssetManagementIndonesiaTbk.2,0202,18007/131,94007/301,970
834,96252,15369,44012,294
17164
6.YULEYulieSekuritasIndonesiaTbk.16719407/2415807/0317207/3081.6003073153714133,84626,492113
3.589.09158035,16036,16811,5022235,16336,17111,505
2.98.92256535718196204,142
5.119.9178181,323155274211,323155274
4.138.461504216186
1.ABDAAsuransiBinaDanaArtaTbk.6,0007,02507/305,97507/037,02507/301,603.8124,36111692471169247
8443,0882,655,0551,163,7515,750,6352,259,83363,168
TRIM
4.ASBIAsuransiBintangTbk.33033007/1726207/1430007/30227.7391051223712618123
3.253.3331,24032,4389,4104,4722232,4389,4104,47222
2.203.5971561,9911034012113,46367740221
AMAGAsuransiMultiArthaGunaTbk.27435007/2324807/3024807/30
7.2,138.88910,4818871,055884223,87689622
6.76.6677071985285217198528521
5.ASDMAsuransiDayinMitraTbk.90597507/0890507/0293007/29274.7011793835811751
ASJTAsuransiJasaTaniaTbk.13913807/0110407/2111707/30
46
4,81007/30
9.BHATBhaktiMultiArthaTbk.45045407/3042407/1445007/30427.1842,2502,588,5031,142,40250,102224,995,02850,13522
8.ASRMAsuransiRamayanaTbk.1,9302,03007/161,87507/011,99007/30776.455466761508817761508817
2,190,674
11.LIFEAsuransiJiwaSinarmasMSIGTbk.7,6507,50007/105,77507/276,10007/3095.86812,810106726236167915,52623817
10.148.5712185051033612250510336222
13.398.1922,123157178151,0015,0717915
12.LPGILippoGeneralInsuranceTbk.3,8003,80007/303,68007/273,80007/30166.2925704931,857111164931,85711116
MaskapaiReasuransiIndonesiaTbk.5,800
16.71.6884,8713479363492134793634921
15.770.9492,9705,8314,2801,286225,86622
14.50.000783,16116144022676,03533,80444122MTWIMalaccaTrustWuwunganInsuranceTbk.505707/215007/295107/30
TUGUAsuransiTuguPratamaIndonesiaTbk.2,6502,90007/072,56007/292,74007/30
PNINPaninvestTbk.75077507/0870007/1473007/30
89159,7001,145,123446,921279,7312,918,871962,695280,106
17.91.42914019,8132,269
2.425.3875,885243,52938,300206,17922587,723120,631206,47422
3.1110,00007/2310,00007/23
VINSVictoriaInsuranceTbk.11812707/139207/309607/30
4.606.53721,24628,4419,87776421121,47445,7677782225607/2839007/30
105,40020,96622
43007/13CASACapitalFinancialIndonesiaTbk.400
1.APICPacificStrategicFinancialTbk.84587507/1780007/1483507/30888.1479,825334,180279,10349,81122439,037
1
551
7.195.6335,924534,71498,23320,94722562,551
124,70213718
6.5.2301941,18895240211,25110024121
5.9.41381310110133181,193,101
8.1,259.812109,524
9.221,71813455122
3812718
63,111
5,622110
PANSPaninSekuritasTbk.1,0151,19007/02
104.4742,18915,26133,088
BCAPMNCKapitalIndonesiaTbk.156162
80007/3080507/30
AHAPAsuransiHartaAmanPratamaTbk.506007/305007/285307/30
22
3,7872219,813
4,3061,289
8318
189,756
21
96,13712,375
12,025
10
3,431
364,616
267
53422
07/30](https://image.slidesharecdn.com/7idxmonthlystatisticsjuli2020-201227101938/85/7-idx-monthly-statistics-juli-2020-40-320.jpg)
![37IDX MONTHLY STATISTICS, JULY 2020
DATA SERVICES | INDONESIA STOCK EXCHANGE
TableTradingbyIndustry
IndustryClassification/StockName
Board
PriceIndivi-
dual
Index
Market
Cap.,
b.IDR
RegularMarketTotalMarket
Prev.
Freq.,
xDays
Volume,
th.share
Value,
m.IDR
Freq.,
x
Days
Volume,
th.share
Value,
m.IDRHighDateLowDateCloseDate
2
2
1
2
2
2
1
2
1
2
1
1
2
2
2
1
2
1
1
1
2
2
2
2
2
1
2
1
1
2
1
2
2
2
1
2
2
2
2
TRADE,SERVICES&INVESTMENT
WHOLESALE(DURABLE&NON-DURABLEGOODS)
7,708
12,009
BMSRBintangMitraSemestarayaTbk.[S]54
555
6607/295107/13
8107/30
OPMS
HenselDavestIndonesiaTbk.[S]
07/3079.434
DPUMDuaPutraUtamaMakmurTbk.[S]78
HDIT
5307/30
170,355
1,308
6,74422
48655507/2047007/2049807/30463.6364985426762054267620
91143,5024,509,4255,964,600369,9686,338,6008,118,426370,216
9.554,03625,384,18415,310,0662,023,02537,147,62220,366,8422,024,863
3.AKRAAKRCorporindoTbk.[S]2,5402,93007/302,40007/132,88007/302,271.44111,562409,0541,076,38459,59822419,5031,104,62859,63522
2.AIMSAkbarIndoMakmurStimecTbk.180----18001/30144.00040--------
1.AGARAsiaSejahteraMinaTbk.[S]
5.AYLSAgroYasaLestariTbk.[S]505007/305007/305007/3050.00043541278522541278522
4.APIIAritaPrimaIndonesiaTbk.[S]20233007/2019207/1323207/30105.4552501,608378576191,608
7.10.6006137821174213782117421
6.BLUEBerkahPrimaPerkasaTbk.[S]50552007/2949407/1351507/30392.3082152,7691,3972,351222,769
9.CARSIndustridanPerdaganganBintracoDharmaTbk.505007/305007/305007/3028.57175022,9431,1472742255,3432,22228622
8.BOGABintangOtoGlobalTbk.[S]1,3951,41507/301,31007/141,40007/301,359.2235,3251,601,0132,191,98070,70122
11.CNKOExploitasiEnergiIndonesiaTbk.505007/305007/305007/303.2884482071027182,217373118
10.CLPIColorpakIndonesiaTbk.[S]74575507/0168507/2971007/30350.0002181,6031,136805221,6031,13680522
13.DWGLDwiGunaLaksanaTbk.[S]25827807/0121207/2822607/30152.0001,969379893962136,9988,58539722
12.11.2732802,03814135921127,288
15.2,424.0001,38755162117195516211719
14.1,294.3494,8898121,52432819812
7,656
1,52432819
8807/215907/286707/3036721
FKSMultiAgroTbk.[S]2,7903,05007/222,720
17.HADEHimalayaEnergiPerkasaTbk.[S]505007/305007/305007/30131.57910620.087619,76898887
16.GRENEvergreenInvescoTbk.328----32803/31312.3811,540-----
18.96.190762202951682221310017022
58,98171122
60507/0141807/1550007/30
22.INTAIntracoPentaTbk.28032207/2326007/2930007/30194.5571,0031,27635713815110,43535,57814415
21.599.6381,154
19.HEXAHexindoAdiperkasaTbk.[S]3,1703,80007/143,18007/013,37007/301,056.1442,831
IndahPrakasaSentosaTbk.[S]1,7402,09007/021,51007/171,77507/30
2,220
20.35.6522611,127,93693,62936,103221,147,91795,22736,10722
15921
23,41040,0517022238,269
85
INPS
INTDInterDeltaTbk.[S]16717707/0212207/3014007/30
HKMetalsUtamaTbk.[S]849307/247507/02
25.34.6673458,6333,1754,3852258,6334,386223,175
24.IRRAItamaRanorayaTbk.[S]58064507/2254007/3054007/30155.080864106,06463,09016,01222106,51463,31516,01322
23.40.344836148515921614
27.KONIPerdanaBangunPusakaTbk.55053507/0343007/1348407/29101.89574842716827164
26.KOBXKobexindoTractorsTbk.[S]9310207/018507/179107/3023.75020713,4051,2612,6692213,4051,2612,66922
29.MDRNModernInternasionalTbk.505007/305007/305007/308.039382110.5611103513112
28.LTLSLautanLuasTbk.[S]45045007/0142807/2144007/30155.5396861,886825677221,88682567722
32.210.16314582,2216,9024,8962282,2216,9024,89622
31.MPMXMitraPinasthikaMustikaTbk.[S]48850507/0348007/1048807/3032.8002,17834,78617,0398,2432234,8968,2452217,097
30.MICEMultiIndocitraTbk.[S]29432007/0229207/2030007/3061.6331803361022332233610223322
OKASAncoraIndonesiaResourcesTbk.859307/287507/228207/30
34.PMJSPutraMandiriJembarTbk.[S]12613007/3011707/1512807/30102.4001,7611,487186142221,48718614222
33.98.51912893,44512,0099,2572293,4459,25722
36.41.2071,2646,8043,3081,325227,2373,5221,32722
35.SDPCMillenniumPharmaconInternationalTbk.106
OptimaPrimaMetalSinergiTbk.[S]11814407/28113
SPTOSuryaPertiwiTbk.[S]49850007/0846807/3046807/30
6,7442248,0196,204152
37.117.0603,045731,864154,44242,19822801,17142,20922
39.TFASTelefastIndonesiaTbk.[S]18918007/2415607/1616807/3090.0002807,964
---5003/31
37522
07/2817107/2119607/30
------
SQMIWiltonMakmurIndonesiaTbk.185240
1,308
SUGISugihEnergyTbk.50-38.64.7691,241--
22
37857619
4,067,54070,74322
1,3972,351
375227,964
6,204
07/0812807/30
1,986
HKMU
16807/229807/02119
FISH07/142,89007/30
48,019
EPMTEnsevalPuteraMegatradingTbk.[S]07/30
227,30126,2031,987
---
22
2,976,677
KAYUDarmiBersaudaraTbk.[S]507007/245007/305107/30
1,8501,91007/241,80007/301,805](https://image.slidesharecdn.com/7idxmonthlystatisticsjuli2020-201227101938/85/7-idx-monthly-statistics-juli-2020-41-320.jpg)
![38
DATA SERVICES | INDONESIA STOCK EXCHANGE
IDX MONTHLY STATISTICS, JULY 2020
TableTradingbyIndustry
IndustryClassification/StockName
Board
PriceIndivi-
dual
Index
Market
Cap.,
b.IDR
RegularMarketTotalMarket
Prev.
Freq.,
xDays
Volume,
th.share
Value,
m.IDR
Freq.,
x
Days
Volume,
th.share
Value,
m.IDRHighDateLowDateCloseDate
2
2
2
1
1
2
2
2
1
1
1
2
2
2
1
2
1
2
2
1
2
1
2
2
2
1
2
1
1
2
1
1
1
2
2
2
2
2
2
RANCSupraBogaLestariTbk.[S]37248807/3037407/0145607/30
TOURISM,RESTAURANTANDHOTEL
TURITunasRideanTbk.[S]1,3701,50007/031,35007/231,40007/30
WAPOWahanaPronaturalTbk.[S]656907/076107/026407/29
TGKATigaraksaSatriaTbk.[S]6,0007,80007/295,75007/017,27507/30
MPPAMatahariPutraPrimaTbk.[S]11712107/2110707/1311007/30
07/27
81507/2187507/30
65507/16
SONASonaTopasTourismIndustryTbk.[S]6,0006,00007/306,00007/30
284
1,6151,63507/011,285LPPFMatahariDepartmentStoreTbk.[S]
882,604
2023,042
RALSRamayanaLestariSentosaTbk.[S]595620
---
07/2155507/2056507/30
6,9852,3182216,3816,985
8,750
07/21260
AKKUAnugerahKagumKaryaUtamaTbk.[S]505007/295007/295007/29
-
07/2427007/29
MidiUtamaIndonesiaTbk.[S]1,4101,45007/231,40507/141,440
BAYUBayuBuanaTbk.[S]1,0351,18507/2395007/301,03507/3036644
75.89332260.282410
--42603/31
07/301,30507/30
BUVA
353.1254,009389,525
CSMI
4
6,016
4
88.40071316,381
817354
07/30
189.09811,079
224,33932022
40.6,409.7306,6821274361312743613
43.3,044.4447,8124,3396,016
42.TRILTriwiraInsanlestariTbk.[S]50----5003/3112.50060--
41.121.178159144TIRATiraAusteniteTbk.[S]278
46.29.9827364214842148
45.36.571796645114665114
44.UNTRUnitedTractorsTbk.[S]16,55022,32507/2816,47507/0121,35007/3025,595.23879,638118,6342,272,28097,10322126,2382,413,54297,20522
93123,0322,832,5953,165,951473,2223,237,2003,567,845473,474
47.ZBRAZebraNusantaraTbk.[S]515507/015007/305007/3028.96043310168417310841716
RETAILTRADE
3.163.5001,4717682561891576825618915
2.AMRTSumberAlfariaTrijayaTbk.79581507/0174007/3074007/301,901.04430,72810,5438,0824,08622211,465168,2414,10722
1.ACESAceHardwareIndonesiaTbk.[S]1,5101,81507/291,45007/061,75007/302,121.95130,013255,218410,68878,46322321,05778,511515,91822
07/1330407/2133007/30
5.DIVADistribusiVoucherNusantaraTbk.[S]1,7252,22007/291,54507/082,02007/3071.5251,44311,76920,3293,4262212,244
4.DAYADutaIntidayaTbk.[S]60070007/0857007/3057007/30340.5921,380241513524
7.ERAAErajayaSwasembadaTbk.[S]1,2551,57007/221,23007/061,47007/30145.0004,689626,629875,132113,40922
GLOBGlobalTeleshopTbk.14820007/06126
6.ECIIElectronicCityIndonesiaTbk.[S]70070007/2965507/2470007/2917.284934121855115
07/3012707/30
10.58.33312647990214799021
46222
14.1,123.32511,371
8.11.47814143368317224336831722
3186
12.29.7983,660532,993761,645121,14222544,766777,813121,18622
11.KOINKokohIntiArebamaTbk.[S]9910007/299807/2110007/2967.6479834318634
9.HEROHeroSupermarketTbk.[S]86007/01910
17.MKNTMitraKomunikasiNusantaraTbk.505007/305007/30125.0002503,4041705911812,256
16.MIDI523.6364,151
827,620586,99373,12122857,147608,78773,15322
13.MAPAMapAktifAdiperkasaTbk.[S]2,5302,61007/082,12007/152,20007/30104.7626,27144,150104,23413,3562246,922
145,07016,5522215.
5007/30
MCASMCashIntegrasiTbk.[S]1,6252,29007/291,60007/022,13007/30
70298717
MAPIMitraAdiperkasaTbk.[S]
CitraPutraRealtyTbk.
18.46.66882828,4753,2263,7312229,175
TrikomselOkeTbk.426
225,02141,08322430,737248,69241,09822
19.NFCXNFCIndonesiaTbk.[S]1,8901,93007/291,63007/071,90007/30103.5141,26711,62621,5187872212,861
22.SKYBNorthcliffCitranusaIndonesiaTbk.[S]51----5103/3113.60030--
3,3083,73222
----
21.
25.-TRIO
6,00007/30
2,31822
1.
18
20.
CiptaSeleraMurniTbk.[S]20629007/1019407/3020807/30
--
250,006
31,09032
24.TELETiphoneMobileIndonesiaTbk.[S]121----12106/0939.032884--------
23.
BukitUluwatuVillaTbk.[S]
25,552
9445,7262,591,657320,635201,820
5.1,155.5568
62122
3.125.816
6.104.0821701,112
2
-
2.178.66513653171061953ARTAArthavestTbk.36838807/1530207/2830407/30
4.40.7693812,444137617223,703576707/075207/2356
CLAY
16,5502274,741
27,575
5,24437820244377
5,432,969747,837202,311
9,346
17354
2511
8702987178
19,3035315
15135
------
3613143613
78822
58460219
110,85813,39622
33346222
631,921
392
21,6963,42822
---
-
113,44122
1710619
10,0468118
414
25,224
5,346
320
151.6251,84971,741140,170
1,805.5443,661392333
WICOWicaksanaOverseasInternationalTbk.[S]62061507/1355007/2358007/24
78080007/0268507/30
KIOSKiosonKomersialIndonesiaTbk.[S]22422407/0116507/3017507/30
1,8102,10007/291,80007/102,080
581.8181,9870.201
07/29
4680
CSAPCaturSentosaAdipranaTbk.[S]350350](https://image.slidesharecdn.com/7idxmonthlystatisticsjuli2020-201227101938/85/7-idx-monthly-statistics-juli-2020-42-320.jpg)
![39IDX MONTHLY STATISTICS, JULY 2020
DATA SERVICES | INDONESIA STOCK EXCHANGE
TableTradingbyIndustry
IndustryClassification/StockName
Board
PriceIndivi-
dual
Index
Market
Cap.,
b.IDR
RegularMarketTotalMarket
Prev.
Freq.,
xDays
Volume,
th.share
Value,
m.IDR
Freq.,
x
Days
Volume,
th.share
Value,
m.IDRHighDateLowDateCloseDate
2
1
2
2
2
2
2
1
2
2
1
2
2
2
2
1
1
2
2
2
2
2
1
2
3
2
1
2
2
2
1
2
2
2
2
2
2
1
1
2
PZZASarimelatiKencanaTbk.[S]79080507/0161507/3062507/30
ADVERTISING,PRINTINGANDMEDIA
SOTSSatriaMegaKencanaTbk.[S]19824207/2718807/0219407/30
FORUFortuneIndonesiaTbk.7510307/238307/278807/30
9207/1710407/30
PSKTRedPlanetIndonesiaTbk.[S]505007/305007/305007/30
5207/30
411737432
84.167646,012
86412
9007/0110107/30
107
1,34507/30
IslandConceptsIndonesiaTbk.[S]57
MAMIMasMurniIndonesiaTbk.505007/305007/305007/30
311
-
4,4771
07/30
JGLEGrahaAndrasentraPropertindoTbk.[S]50
64,8503,6504,0002
76
14,3828,4081940.304.00042830,07514,3828,4081930,075
88417797
15,929
2.
411737
3,6504,84322EASTEastparcHotelTbk.[S]646707/14
6.69.23141432
38.SHIDHotelSahidJayaInternationalTbk.[S]
07/0225807/30270
5507/30
5007/305007/305007/30
169.618
181,406
232.3938,62778,648
104
----60003/31
BLTZGrahaLayarPrimaTbk.[S]3,3003,60007/162,90007/163,60007/16
NASAAyanaLandInternationalTbk.16016307/01
27807/1319807/30200
HotelMandarineRegencyTbk.50----50
15.
03/31
HRMEMentengHeritageRealtyTbk.[S]909807/015107/295407/30
07/30
7907/235607/235807/30
07/288107/2884PANRPanoramaSentrawisataTbk.[S]101
PJAAPembangunanJayaAncolTbk.[S]530
07/30
07/30
NATONusantaraPropertiInternasionalTbk.288378
58
36607/3077.22847092,862
MAMIPMasMurniTbk.(PreferredStock)600
111,090
9.41.35322759,5023,6504,8422259,502
DUCKJayaBersamaIndoTbk.[S]50550507/0136407/30
5992,930228,20710.ESTAEstaMultiUsahaTbk.[S]9311107/16
8.
143,06355,872222,227,283
23.
28.NUSASinergiMegahInternusaTbk.
531
1,4861,81022
13.53.1521,111--------
12.FITTHotelFitraInternationalTbk517607/135007/086707/3069.6084022,191
HOME
99507/0399507/03
07/27
14.HOTLSaraswatiGriyaLestariTbk.506407/175007/305007/3027.02717833,5181,8333,2802272,018
86412
17.IKAIIntikeramikAlamasriIndustriTbk.[S]505007/3050
19.
20.33113
30.PDESDestinasiTirtaNusantaraTbk.[S]40855007/0836407/0347007/21235.0003368356148
665130739
16.111.333631,406
49807/30275.6821,160
ICON
29.50.999101
18.35.7141,1293029783,572
JIHDJakartaInternationalHotels&DevelopmentTbk.[S]53070007/13
22.6.8356151,383691142217,352
21.KPIG
995
50
8103,042
370
105.3668403,8772,0801,159
PembangunanGrahaLestariIndahTbk.[S]220
5151,05007/1554007/0991517102
60,8585,5585,5652260,858
1,316,778
400.0004-----
1613607/101,30507/28
273617684
5007/30
8,66457,92922
57507/1652007/3052507/30
07/03
MNCLandTbk.[S]11211307/0610607/30
07/305007/3014.286
130
161,23855,87422
1735,0921,7544518
1,4861,8102222,191
282.667983367412218336
3,7583,28222
7321912
163,29558,20222
25813822
18
389720
1,2101,119910221,2101,11991022
158
77.9762,92013619199
49.5243222,004,464
5007/3087.719138
33.
11
524,183
6938972069
39,15221,71622136,07258,159
1919916
17
35614
18
162916
5,5585,56522
343918
635,34372,2161,09422
95
74122
2
22
9722
22914
4,221,0702,752,516523,5536,932,8693,322,18289,589
123.636194
27.264.0782,16085,84926,89415,43622309,199
26.100.0001,1451,6201951,08322
5050
34.457.189730
102,03970,68518,248
07/3050
20
22107,03974,12018,249
39.
161.40020
22884177
1.ABBAMahakaMediaTbk.505207/095007/30
85507/1516807/0635407/30
970722302297072230
07/303,65007/304,00007/30
31.
17102
35.59.49451825130
PNSEPudjiadi&SonsTbk.[S]620
32.
41
400.0001,1481436.
13914
22
6
21,721
--
24.
3.103.4781,769
214.2922,307
11.2,878.0833,671
7.DFAMDafamPropertyIndonesiaTbk.33436007/0929207/0234607/27300.870657
PGLI
4.638.88925,390
5.FILMMDPicturesTbk.[S]17118807/17158
MINASanurhastaMitraTbk.[S]505007/305007/305007/30
DMMXDigitalMediatamaMaximaTbk.19724807/3017507/1323007/30
58229
92,81515,44822
238.095328
22
5
4,82622
456,07897,51628,95422460,62398,60128,957
33.333
37.57.7271,889
25.
22
113518
470
JSPTJakartaSetiabudiInternasionalTbk.[S]995
3012113
07/3016307/3077.1431,550
22
22
223,8772,0801,15922
07/30
5183012
24,9264,3404,8262224,9264,340
157615
30,0311,5081,4772230,0311,5081,477
UANG*PakuanTbk.125
FASTFastFoodIndonesiaTbk.[S]93595007/0390507/2192007/30
PGJOTourindoGuideIndonesiaTbk.788607/296607/306607/30
38513472516534
281733
07/21
240.0003,146
MAPBMAPBogaAdiperkasaTbk.[S]1,6001,500
PTSPPioneerindoGourmetInternationalTbk.[S]3,5005,20007/303,25007/065,20007/30
EMTKElangMahkotaTeknologiTbk.[S]4,9004,90007/034,50007/304,50007/30](https://image.slidesharecdn.com/7idxmonthlystatisticsjuli2020-201227101938/85/7-idx-monthly-statistics-juli-2020-43-320.jpg)
![40
DATA SERVICES | INDONESIA STOCK EXCHANGE
IDX MONTHLY STATISTICS, JULY 2020
TableTradingbyIndustry
IndustryClassification/StockName
Board
PriceIndivi-
dual
Index
Market
Cap.,
b.IDR
RegularMarketTotalMarket
Prev.
Freq.,
xDays
Volume,
th.share
Value,
m.IDR
Freq.,
x
Days
Volume,
th.share
Value,
m.IDRHighDateLowDateCloseDate
1
2
2
1
2
2
1
1
1
1
1
2
1
2
1
1
1
2
2
1
1
1
1
3
2
2
2
2
2
2
1
1
2
1
1
1
2
1
MLPTMultipolarTechnologyTbk.[S]62568007/0154507/2858507/30
INVESTMENTCOMPANY
MSKYMNCSkyVisionTbk.[S]1,0001,17507/281,00007/231,14007/29
HEALTHCARE
DIGIArkadiaDigitalMediaTbk.[S]1,7051,77507/281,69007/241,77507/28
TMPOTempoIntiMediaTbk.[S]14415307/2012807/2713807/30
SRAJSejahterarayaAnugrahjayaTbk.[S]13017007/3012507/2817007/30
5007/30
HEALMedikalokaHerminaTbk.[S]3,0503,14007/012,91007/093,05007/30
SAMESaranaMeditamaMetropolitanTbk.[S]7910107/286007/208607/30
JasuindoTigaPerkasaTbk.[S]78078007/1676007/3076007/30
SCMA
StarPacificTbk.[S]76----7606/30
MahakaRadioIntegraTbk.688107/0150
MTDLMetrodataElectronicsTbk.[S]1,2951,48007/171,30007/011,44007/30
MNCInvestamaTbk.505007/30
JTPE
83
DNETIndoritelMakmurInternasionalTbk.3,5003,49007/303,16007/033,45007/305.2,969.10548,9357212,4162462239,951131,41324822
6.28.9191824,385,560509,650153,293224,425,024519,867153,30022
13,63722263,87116,61313,63922
68,5664,563,7622,174,6587,596,8523,270,098152,852
328.15511,3052,967,074982,43942,48922
LPLI
22
4.PRDAProdiaWidyahusadaTbk.[S]3,1203,35007/092,96007/163,10007/3047.6922,9061,9886,1501,012221,9886,1501,01222
5.PRIMRoyalPrimaTbk.[S]30034607/1026407/2927207/3054.80092327179231203,5211,08023220
37,1766.111.2505071,130,32087,18337,175221,180,32090,183
3.138.35934,191451,9481,063,06165,63822527,9931,242,11865,73522
2.
42,51922
82.4329,0688,51425,5433,046
96
1.
18.
2214,54443,0163,06522
152,702
5,862,3351,877,035
92,16324,43020,10522
1,700.0001,3027,1645,5194782210,4768,06848222
20,15922
21
31,20022
48.635146234331322134,2675,13813321
-
19.VIVAVisiMediaAsiaTbk.[S]505007/305007/305007/3016.6678237313778211,536,74475,19610322
16.75.0002,274637331660,06360,073326
17.579.04718,985648,722804,92838,50622677,580840,55538,5452207/271,14507/011,28507/30SuryaCitraMediaTbk.[S]1,1651,325
14.MNCNMediaNusantaraCitraTbk.[S]90594007/0381007/3082007/3093.33311,7061,610,0201,436,794155,620221,629,0821,454,041155,89822
15.54.8001,384
12.66.667263588,64634,64331,19622596,446
13.MDIAIntermediaCapitalTbk.505007/295007/295007/2936.2321,961214111,03319214111,03319
360,93597,928MSINMNCStudiosInternationalTbk.[S]25631607/0324407/1426607/30
07/30MARI
10.LINKLinkNetTbk.[S]2,2502,40007/061,89507/291,90507/30118.7505,45442,06187,82723,5832242,29388,30623,58922
11.2.34589-------
37,457
8.
9.92.03660398358121983581
7.IPTVMNCVisionNetworksTbk.[S]37638207/0132607/3032807/30140.83312,564719,372254,259217,243221,468,545550,362217,45822
7.51.6767,625
8.136.6052,0401,645253298224,14856629922
MIKAMitraKeluargaKaryasehatTbk.[S]2,2702,52007/302,26007/13
9757,5034,898,849634,189218,8615,004,461787,366218,876
17,38511,5483,6202217,38511,5483,620221.ASGRAstraGraphiaTbk.[S]68070507/2964507/2866007/30138.912890
COMPUTERANDSERVICES
82.500807117,96364,29118,11322123,321
07/2130407/0234007/30
11531516
2,0039,9492,813222,003
ATICAnabaticTechnologiesTbk.87088007/0960507/2761507/3093.5711,42416
KBLVFirstMediaTbk.[S]37042007/0631007/2434607/30
CAREMetroHealthcareIndonesiaTbk.[S]320356
115315
9,9492,81422
22
7.GLVAGalvaTechnologiesTbk.33032807/1730007/1630607/30141.59345917,9485,7564042117,9485,75640421
8.LMASLimasIndonesiaMakmurTbk.[S]677607/025007/305007/3015.71439245,58114,795
4.887.50057771214
SILOSiloamInternationalHospitalsTbk.[S]5,2005,27507/024,53007/294,69007/30
8712148
3.CASHCashlezWorldwideIndonesiaTbk.54067,10918,11622
2.
9.106.99321512,8702239,49512,26812,870
ENVYEnvyTechnologiesIndonesiaTbk.[S]8615307/108507/0610107/30
62007/2149007/0856507/30
79,946
6,60422
11.2,610.3553,53633,16147,3658,0882241,79059,5098,09122
12.TECHIndosterlingTechnomediaTbk.[S]16617607/0711707/2911907/3077.500149146,07522,50220,03322146,07522,50220,03322
10.118.7501,09712,9017,8676,6032212,9017,867
9821,7371,739,952293,38179,8992,561,365535,216
39,49512,268
2,40007/30
64,90624622
174,57927,411221,189,241244,16227,42222
1.
889,946176,29248,28922
4.BNBRBakrie&BrothersTbk.505007/305007/3050
199
3.180.6933,282867,679
5.KRENKresnaGrahaInvestamaTbk.[S]15515807/0110507/3010807/301,165.2101,967792,436106,07348,28522
2232161386022421
2.BHIT2,11610623222374,777
GlobalMediacomTbk.[S]18522607/3018207/0121407/30BMTR
5007/305007/30146.2203,388
LUCKSentralMitraInformatikaTbk.[S]31835807/2427407/2430007/30
07/300.1721,04326413702118,59624822
ABMMABMInvestamaTbk.1,4001,40507/081,06507/291,07507/3028.6672,960172](https://image.slidesharecdn.com/7idxmonthlystatisticsjuli2020-201227101938/85/7-idx-monthly-statistics-juli-2020-44-320.jpg)
![41IDX MONTHLY STATISTICS, JULY 2020
DATA SERVICES | INDONESIA STOCK EXCHANGE
TableTradingbyIndustry
IndustryClassification/StockName
Board
PriceIndivi-
dual
Index
Market
Cap.,
b.IDR
RegularMarketTotalMarket
Prev.
Freq.,
xDays
Volume,
th.share
Value,
m.IDR
Freq.,
x
Days
Volume,
th.share
Value,
m.IDRHighDateLowDateCloseDate
2
1
2
2
2
2
2
2
2
1
2
2
2
2
2
2
2
2
2
(Board)1:MainBoard2:DevelopmentBoard3:AccelerationBoard[S]:ShariaCompliantStock*NewListedStock**DelistedStock
Note:TotalvalueofsectorandsubsectorexludeAccelerationBoard
10.SOSSShieldonServiceTbk.[S]37248007/2333407/1541007/30155.072269899331554223,3291,33255522
11.YELOYeloooIntegraDatanetTbk.[S]505007/305007/305007/3013.2981924712105224101410722
8.SFANSuryaFajarCapitalTbk99599507/0890507/2298007/30518.6171,3332,3962,2221091416,23614,95511114
9.SIMASiwaniMakmurTbk.50----5002/286.36822--------
OCAPOnixCapitalTbk.19619307/1617407/2917407/29
OTHERS
7.RONYAeslerGrupInternasionalTbk.[S]18019007/0613707/3013707/30142.00017126741405212674140521
5.ITMASumberEnergiAndalanTbk.[S]410----41004/29117.986357--------
4.INDXTanahLautTbk.506707/155007/155607/304.5602574342254217434225421
2.DYANDyandraMediaInternationalTbk.[S]515107/285007/305007/3014.28621420,0131,0025202220,0131,00252022
3.GEMAGemaGrahasaranaTbk.[S]36237207/2936007/2337207/29826.6675951073934710739347
994,38226,8754,1363,00043,30717,8713,005
1.BOLABaliBintangSejahteraTbk.[S]16017807/0314907/1016407/3093.7149841,940312671221,94031267122
2213,30843,0651,02022
11.PLASPolarisInvestamaTbk.[S]50----5003/3111.79159--------
12.POOLPoolAdvistaIndonesiaTbk.50----5006/0931.736117--------
13.SRTGSaratogaInvestamaSedayaTbk.2,7502,78007/282,70007/102,76007/3050.1827,4882,4616,7321,017
8
10.PEGEPancaGlobalKapitalTbk.11214507/3010007/0313207/30291.66537445852276215185827721
8.154.0002016,5122,033
9.87.00048611086110
2656,5122,033265
7.MLPLMultipolarTbk.[S]535807/065007/205207/305.96476167,8493,5932,3492267,8493,5932,34922
206,978,668169,543,30714,548,384TOTAL5,968,165166,289,395144,984,76614,538,582
6.MGNAMagnaInvestamaMandiriTbk.50----5003/3147.61950--------
NICKCharnicCapitalTbk.34832407/2430207/2730807/29
6.MFMIMultifilingMitraIndonesiaTbk.[S]54555007/2048807/0852007/30260.0003942631353482226313534822](https://image.slidesharecdn.com/7idxmonthlystatisticsjuli2020-201227101938/85/7-idx-monthly-statistics-juli-2020-45-320.jpg)
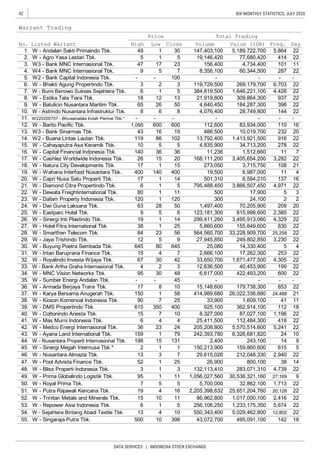
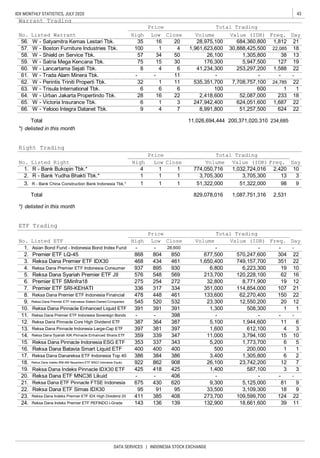
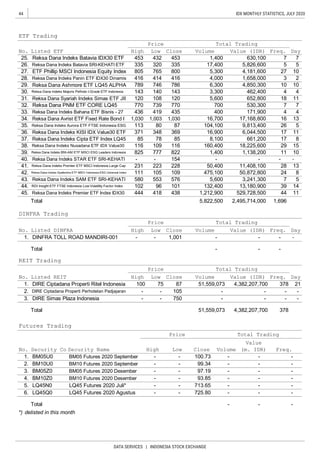
![45IDX MONTHLY STATISTICS, JULY 2020
DATA SERVICES | INDONESIA STOCK EXCHANGE
AGRICULTURE
CROPS
PLANTATION
AALI
ANDI
ANJT
BWPT
CSRA
DSNG
GOLL
GZCO
JAWA
LSIP
MAGP
MGRO
PALM
PGUN
PSGO
SGRO
SIMP
SMAR
SSMS
UNSP
ANIMALHUSBANDRY
BEEF
FISHERY
DSFI
MINING
COALMINING
ADRO
ARII
BOSS
BSSR
BUMI
BYAN
DEWA
DOID
DSSA
FIRE
GEMS
GTBO
HRUM
INDY
ITMG
KKGI
MBAP
MYOH
BEEFEstikaTataTiaraTbk.[S]Mar-20Dec927553374374(40)(32)(33)(14.1)(35.0)(34.9)
DSFIDharmaSamuderaFishingIndustriesTbk.[S]Jun-20Dec377188189163(10)(8.07)(8.07)(4.28)(8.55)(9.88)
Liabi-
lities
Annual
Profit
for
the
period
Profit
attr.
to
owner's
entity
FinancialData&Ratios
billionIDR
P/E
Ratio,
x
Price
toBV,
x
D/E
Ratio,
x
ROA,
%
ROE,
%
NPM,
%ListedStocks
FS
Date
Fiscal
Year
EndEBT
EPS,
IDR
Book
Value,
IDR
1.55
1162.8804131.040.16
1.(100.9)894(1.07)1.11
SalesAssetsEquity
2,8013892,412890
27,3818,06219,3199,081
8,8490.61
0.471.58
0.790.21
4.311.14
2.451.60
0.811.28
0.791.84
1.011.48
1.00
2.94.91,6345.431.762.92
1(8.70)102(7.59)0.65
0.651.00
8.63
2ANDIAndiraAgroTbk.[S]Jun-20Dec5102352751431616163.402915
240.970.422.864.06648408392407.210,0381AALIAstraAgroLestariTbk.[S]Jun-20Dec
21.1
12(115.3)973(1.42)1.141.65
131.040.166.727.80121949462.88041BISIBisiInternationalTbk.[S]Jun-20Dec
(1.75)(2.80)(14.9)
4BWPTEagleHighPlantationsTbk.Jun-20Dec15,58711,4114,1761,218(478)(428)(417)
(77)(46.1)1,643(13)0.363,3375,5121,039(4.57)(78)3ANJTAustindoNusantaraJayaTbk.[S]Jun-20Dec
1.700.856.2411.622.3
15.431.5
6DSNGDharmaSatyaNusantaraTbk.Jun-20Dec11,7107,8543,8563,15025218018234.3364
2737.431.141.486.22
(5.35)(20.0)(68.5)
5CSRACisadaneSawitRayaTbk.[S]Jun-20Dec1,38582555927352434342.0
(26.4)132(4.50)0.902.73
(18.6)(48.1)(237.0)(155)(154)(51.4)107(0.974)1,6571,016641130(183)8GZCOGozcoPlantationsTbk.[S]Jun-20Dec
0.232.27(2.25)(7.34)(2,004.1)
11.5
7GOLLGoldenPlantationTbk.Mar-19Dec2,5901,7977932.90(18)(18)(15)(15.9)216(3.15)
111.012.043.109.43
1.772.1411.7929227.01,2573710,3801,8018,5791,5669610LSIPPPLondonSumatraIndonesiaTbk.[S]Jun-20Dec
0.709.26(5.48)(56.2)(99.3)(48)(48)(50.9)91(1.24)3,5083,166342193(51)9JAWAJayaAgraWattieTbk.Mar-20Dec
(4.83)(10.4)(5.19)(32)(33)(18.8)181(42)1,3807366441,285(30)12MGROMahkotaGroupTbk.[S]Jun-20Dec
1.292.74(7.03)(26.3)(173.4)(23)(23)(10.2)39(4.89)1,30895835053(23)11MAGPMultiAgroGemilangPlantationTbk.[S]Mar-20Dec
(1.12)(2.92)(9.49)(22)(22)(4.35)149(84)1,9391,194746229(20)14PGUNPradiksiGunatamaTbk.Dec-19Dec
0.670.081.231.3328.117174.79359502,7722142,5571211513PALMProvidentAgroTbk.[S]Jun-20Dec
0.020.050.124.950.971.032,1971,7429,4655,3124,1531,6025516SGROSampoernaAgroTbk.Jun-20Dec
1.841.740.050.130.330.790.790.08621,3723,2282,0501,1784751315PSGOPalmaSerasihTbk.Jun-20Dec
0.070.200.1111117.503,81240031,13120,18210,95019,0736718SMARSMARTTbk.[S]Jun-20Dec
0.291.01(1.72)(3.46)(8.75)(378)(301)(38.0)1,100(8.47)34,92217,53117,3926,873(211)17SIMPSalimIvomasPratamaTbk.[S]Jun-20Dec
(2.16)
13(69.4)198(2.88)
20(2,428.8)(2,988)(0.025)(0.020)
2.102.23(11.3)(36.5)(147.6)(339)(339)(142.3)390(5.76)12,0108,2963,713918(319)19SSMSSawitSumbermasSaranaTbk.Mar-20Dec
UNSPBakrieSumateraPlantationsTbk.Mar-20Dec8,68316,155(7,472)540(2,282)(2,024)(1,518)(69.9)N/A(1,123.9)
1.48
14(8.70)102(7.59)
1(69.4)198(2.88)1.01
0.530.745.679.8752.31,7291,607200.92,0365.40113,32548,21065,11512,2832,1721ADROAdaroEnergyTbk.[S]Mar-20Dec
0.991.59179.32,862(1.82)21
0.643.10(4.87)(19.9)(23.2)(18)(18)(25.0)126(3.19)720544176151(18)3BOSSBorneoOlahSaranaSuksesTbk.[S]Jun-20Dec
2.698.65(5.49)(52.9)(99.7)(168)(142)(94.9)179(5.08)5,1854,648538285(169)2ARIIAtlasResourcesTbk.[S]Jun-20Dec
0.436.59(3.88)(29.4)(54.6)(570)(574)(34.1)116(1.47)59,22551,4217,8044,212(563)5BUMIBumiResourcesTbk.Mar-20Dec
1.180.4016.122.442.0166166253.21,1295.254,1271,1722,9551,5762254BSSRBaramultiSuksessaranaTbk.[S]Mar-20Dec
0.281.290.511.173.3611112.06176248,8184,9733,8451,342627DEWADarmaHenwaTbk.[S]Mar-20Dec
4.911.219.9822.019.91,083990594.12,6952219,83610,8538,9849,9501,3496BYANBayanResourcesTbk.[S]Jun-20Dec
0.631.271.443.2612.34342091,086.833,2931958,21232,55825,6546,8184339DSSADianSwastatikaSentosaTbk.[S]Mar-20Dec
0.573.03(1.42)(5.71)(4.47)(112)(112)(26.1)457(9.96)15,88811,9503,9385,036(40)8DOIDDeltaDuniaMakmurTbk.Jun-20Dec
2.331.0016.933.841.9554543369.01,0936.9112,8396,4086,4315,18375811GEMSGoldenEnergyMinesTbk.[S]Mar-20Dec
0.530.542.253.462.395.965.978.09234155311863454998.4310FIREAlfaEnergiInvestamaTbk.[S]Jun-20Dec
0.530.119.4010.442.8341314232.02,2215.096,6756696,0051,46740613HRUMHarumEnergyTbk.[S]Jun-20Dec
0.310.32(2.40)(3.17)N/A(9.51)(9.51)(7.60)240(9.86)7941955990.00(9.51)12GTBOGardaTujuhBuanaTbk.[S]Jun-20Dec
0.630.434.977.1216.8236252892.512,5318.8520,2816,12314,1595,98972915ITMGIndoTambangrayaMegahTbk.[S]Mar-20Dec
0.312.52(2.39)(8.41)(13.1)(290)(344)(264.2)3,141(3.71)57,62541,26016,36510,500(275)14INDYIndikaEnergyTbk.Mar-20Dec
0.920.3222.129.137.3342342556.91,9153.183,0997492,3501,83245917MBAPMitrabaraAdiperdanaTbk.[S]Jun-20Dec
0.780.31(1.36)(1.78)(3.51)(13)(12)(4.73)266(44)1,7354071,328673(12)16KKGIResourceAlamIndonesiaTbk.[S]Jun-20Dec
1.330.21(6.91)(8.39)(19.5)(39)(39)(71.4)850(16)2,2804031,876809(29)18MYOHSamindoResourcesTbk.[S]Mar-20Dec](https://image.slidesharecdn.com/7idxmonthlystatisticsjuli2020-201227101938/85/7-idx-monthly-statistics-juli-2020-49-320.jpg)
![46
DATA SERVICES | INDONESIA STOCK EXCHANGE
IDX MONTHLY STATISTICS, JULY 2020
Liabi-
lities
Annual
Profit
for
the
period
Profit
attr.
to
owner's
entity
FinancialData&Ratios
billionIDR
P/E
Ratio,
x
Price
toBV,
x
D/E
Ratio,
x
ROA,
%
ROE,
%
NPM,
%ListedStocks
FS
Date
Fiscal
Year
EndEBT
EPS,
IDR
Book
Value,
IDRSalesAssetsEquity
PTBA
PTRO
SMMT
SMRU
TOBA
TRAM
CRUDEPETROLEUM&NATURALGASPRODUCTION
APEX
ARTI
ELSA
ENRG
MEDC
MITI
MTFN
PKPK
RUIS
SURE
WOWS
METALANDMINERALMINING
ANTM
BRMS
CITA
CKRA
DKFT
IFSH
INCO
MDKA
PSAB
TINS
ZINC
LAND/STONEQUARRYING
CTTH
BASICINDUSTRYANDCHEMICALS
CEMENT
INTP
SMBR
SMCB
SMGR
WSBP
WTON
CERAMICS,GLASS,PORCELAIN
AMFG
ARNA
CAKK
KIAS
MARK
MLIA
TOTO
TRAMTradaAlamMineraTbk.[S]Sep-19Dec9,1763,9055,2713,23023(40)(29)(0.428)(0.745)(1.22)
1.170.3913.018.170.5909903313.61,7306.4727,7297,80319,9265,1221,18719PTBABukitAsamTbk.[S]Mar-20Dec
0.470.51(1.64)(2.47)(16.1)(10)(7.09)(4.50)182(19)86729357488(10)21SMMTGoldenEagleEnergyTbk.[S]Jun-20Dec
0.581.623.047.9816.27169273.03,4207.229,0495,6003,4491,6953220PTROPetroseaTbk.[S]Mar-20Dec
0.681.585.5914.418.847129573.35084.7210,5486,4624,0863,13652023TOBATobaBaraSejahtraTbk.[S]Jun-20Dec
0.961.37(16.0)(37.9)(101.7)(123)(123)(19.7)52(2.54)1,544893651242(114)22SMRUSMRUtamaTbk.[S]Jun-20Dec
0.679.68(4.25)(45.4)(58.4)(149)(149)(112.2)247(1.47)7,0276,369658511(165)1APEXApexindoPratamaDutaTbk.Jun-20Dec
3.347.42
0.74
22(0.442)26316
24(0.791)106(63)0.47
0.412.382.247.5690.02632069.211225.4318,39612,9505,4454573263BIPIAstrindoNusantaraInfrastrukturTbk.Jun-20Dec
0.491.23(19.6)(43.8)(203.4)(992)(351)(44.7)102(1.12)1,785984801172(988)2ARTIRatuPrabuEnergiTbk.[S]Dec-19Dec
0.254.267.6840.363.934320880.62000.6210,8558,7902,0651,3046855ENRGEnergiMegaPersadaTbk.[S]Mar-20Dec
0.450.903.717.046.6913013035.75076.387,0223,3203,7033,8972014ELSAElnusaTbk.[S]Jun-20Dec
(3.21)(3.10)(44.0)N/AN/A(10)(10)(14.7)(16)(3.47)4770(22)0.00(10)7MITIMitraInvestindoTbk.Jun-20Dec
0.443.43(0.567)(2.51)(2.37)(189)(475)(26.5)1,055(18)83,76164,84818,91320,0572,4986MEDCMedcoEnergiInternasionalTbk.Dec-19Dec
1.783.477.5233.660.42.892.899.65295.297760179.583.729PKPKPerdanaKaryaPerkasaTbk.Jun-20Dec
115.661.01.1269.32.184.704.770.300.43167854840144376.178MTFNCapitalincInvestmentTbk.[S]Jun-20Dec
34.83.390.713.114.510.970.972.59831,12054742212586(1.76)11SURESuperEnergyTbk.Mar-20Dec
0.282.012.718.174.48181847.95863.381,3619104518222810RUISRadiantUtamaInterinscoTbk.[S]Jun-20Dec
0.970.660.560.941.84
1.01
1ANTMAnekaTambangTbk.[S]Jun-20Dec30,03311,93018,1049,22613385857.06753103
2326.4577132.00
0.330.372.112.889.6517176.89239128082175921772412WOWSGintingJayaEnergiTbk.[S]Dec-19Dec
2.140.1822.226.238.1484484244.49328.144,3636723,6902,5394843CITACitaMineralInvestindoTbk.[S]Jun-20Dec
0.420.370.090.1366.62.642.700.1512032911,7033,1688,535162.532BRMSBumiResourcesMineralsTbk.[S]Mar-20Dec
0.852.13(6.48)(20.3)(36.7)(137)(85)(30.2)149(4.17)2,6271,788838464(175)5DKFTCentralOmegaResourcesTbk.[S]Jun-20Dec
2.980.13(0.316)(0.357)N/A(0.225)(0.232)(0.091)25(836)147171300.00(0.225)4CKRACakraMineralTbk.Jun-20Dec
1.190.124.755.3329.5760760152.92,8712231,9973,46728,5305,1546317INCOValeIndonesiaTbk.[S]Jun-20Dec
1.951.48(4.09)(10.2)(61.8)(29)(25)(23.4)230(19)1,21572648980(35)6IFSHIfishdecoTbk.[S]Jun-20Dec
1.391.78(0.681)(1.89)(5.51)15(47)(3.54)187(74)13,7448,7964,9481,696199PSABJResourcesAsiaPasifikTbk.Jun-20Dec
4.480.766.3611.257.723124544.83994015,4116,6648,7471,6994088MDKAMerdekaCopperGoldTbk.[S]Mar-20Dec
4.490.715.9610.227.841423.3233441,4055838223015611ZINCKapuasPrimaCoalTbk.[S]Jun-20Dec
1.182.82(4.24)(16.2)(9.78)(390)(390)(104.7)647(7.26)18,39713,5814,8157,979(436)10TINSTimahTbk.Jun-20Dec
0.97
3181.62,346261.271.18
3.(225.1)2,564131.37
0.221.70(5.57)(15.0)(97.4)
1.70
1CTTHCitatahTbk.[S]Jun-20Dec74546927643(22)(21)(21)(33.7)225(1.48)
24(33.7)225(1.48)0.22
1.470.69(4.91)(8.27)(41.0)(138)(138)(27.7)335(18)5,6102,2823,328672(125)2SMBRSemenBaturaja(Persero)Tbk.[S]Jun-20Dec
1.940.153.483.9915.2470470255.46,3944827,0373,49923,5386,1755501INTPIndocementTunggalPrakarsaTbk.[S]Jun-20Dec
1.591.281.563.567.64606612206.55,7954578,29943,92834,37116,0261,0284SMGRSemenIndonesia(Persero)Tbk.Jun-20Dec
1.111.760.842.323.63828221.49234819,50412,4317,0734,5181523SMCBSolusiBangunIndonesiaTbk.Jun-20Dec
0.742.003.029.0624.9727333.33688.229,6206,4113,2091,166756WTONWijayaKaryaBetonTbk.[S]Mar-20Dec
0.761.220.070.150.945.185.180.3926250715,3588,4456,9141,1016.885WSBPWaskitaBetonPrecastTbk.[S]Jun-20Dec
2.770.5414.121.624.212212132.9152131,7155981,1179961562ARNAArwanaCitramuliaTbk.[S]Jun-20Dec
0.381.76(9.19)(25.4)(47.3)
0.77
1AMFGAsahimasFlatGlassTbk.Jun-20Dec8,4265,3753,0511,637(368)(387)(387)(1,783.4)7,029(1.51)
32(254.8)1,3674.522.28
0.860.21(7.02)(8.50)(40.5)(35)(37)(4.96)58(10)1,054184870183(37)4KIASKeramikaIndonesiaAssosiasiTbk.[S]Jun-20Dec
0.280.42(3.75)(5.33)(12.5)(5.76)(5.76)(9.57)180(5.22)3079121692(5.76)3CAKKCahayaputraAsaKeramikTbk.[S]Jun-20Dec
0.301.32(1.57)(3.64)(5.17)(45)(45)(68.0)1,867(8.16)5,7253,2552,4701,740(53)6MLIAMuliaIndustrindoTbk.[S]Jun-20Dec
10.20.4121.330.153.7525227.29034485142344193645MARKMarkDynamicsIndonesiaTbk.[S]Jun-20Dec
1.150.706.8611.747.9585822.41929.823,3721,3901,982483747TOTOSuryaTotoIndonesiaTbk.[S]Mar-20Dec](https://image.slidesharecdn.com/7idxmonthlystatisticsjuli2020-201227101938/85/7-idx-monthly-statistics-juli-2020-50-320.jpg)
![47IDX MONTHLY STATISTICS, JULY 2020
DATA SERVICES | INDONESIA STOCK EXCHANGE
Liabi-
lities
Annual
Profit
for
the
period
Profit
attr.
to
owner's
entity
FinancialData&Ratios
billionIDR
P/E
Ratio,
x
Price
toBV,
x
D/E
Ratio,
x
ROA,
%
ROE,
%
NPM,
%ListedStocks
FS
Date
Fiscal
Year
EndEBT
EPS,
IDR
Book
Value,
IDRSalesAssetsEquity
METALANDALLIEDPRODUCTS
ALKA
ALMI
BAJA
BTON
CTBN
GDST
GGRP
INAI
ISSP
JKSW
KRAS
LION
LMSH
NIKL
PICO
PURE
TBMS
CHEMICALS
ADMG
AGII
BRPT
DPNS
EKAD
ESSA
ETWA
INCI
MDKI
MOLI
SAMF
SRSN
TDPM
TPIA
UNIC
PLASTICS&PACKAGING
AKPI
APLI
BRNA
EPAC
ESIP
FPNI
IGAR
IMPC
IPOL
PBID
SMKL
TALF
TRST
YPAS
1.563.542.3710.80.92
1.31
1ALKAAlakasaIndustrindoTbk.[S]Jun-20Dec5324151171,3691.686.226.3024.823015
33(1,126.0)7,658210.69
1.5110.1(1.54)(17.1)(2.03)(5.99)(5.99)(6.66)39(8.86)77670670590(5.76)3BAJASaranacentralBajatamaTbk.Jun-20Dec
(1.08)(14.0)(13.4)N/A(46.2)(103)(103)(334.7)(192)(0.615)1,5341,652(118)446(122)2ALMIAlumindoLightMetalIndustryTbk.Jun-20Dec
1.320.343.935.278.53393997.91,856251,9915061,485918535CTBNCitraTubindoTbk.[S]Jun-20Dec
0.690.333.324.4015.44.134.1311.52611624961188544.044BTONBetonjayaManunggalTbk.[S]Jun-20Dec
0.340.53(2.07)(3.17)(6.84)(154)(154)(25.5)804(11)14,9055,1669,7394,514(165)7GGRPGunungRajaPaksiTbk.[S]Jun-20Dec
0.641.01(8.74)(17.5)(22.3)(74)(74)(15.9)91(3.64)1,686846840661(61)6GDSTGunawanDianjayaSteelTbk.[S]Jun-20Dec
0.301.030.080.170.322.642.630.734311776,3063,2063,1011,6662.959ISSPSteelPipeIndustryofIndonesiaTbk.Jun-20Dec
0.713.090.170.690.411.111.113.515061021,310990320548128INAIIndalAluminiumIndustryTbk.Jun-20Dec
1.096.050.271.911.6367656.673485747,54240,8016,7417,90734211KRASKrakatauSteel(Persero)Tbk.Jun-20Dec
(0.018)(1.36)(1.10)N/AN/A(0.989)(0.989)(13.2)(3,311)(4.55)180677(497)0.000.0010JKSWJakartaKyoeiSteelWorksTbk.Jun-20Dec
0.220.23(4.68)(5.77)(11.8)(3.19)(3.19)(66.4)1,151(3.77)1362611054(3.17)13LMSHLionmeshPrimaTbk.[S]Jun-20Dec
0.380.45(1.04)(1.51)(4.99)(3.51)(3.51)(13.5)894(25)675210465141(3.32)12LIONLionMetalWorksTbk.[S]Jun-20Dec
0.473.79(4.52)(21.7)(28.3)(25)(25)(87.0)402(2.16)1,094866228175(26)15PICOPelangiIndahCanindoTbk.[S]Jun-20Dec
3.331.990.421.260.834.154.153.292602631,9621,3066569974.3614NIKLPelatTimahNusantaraTbk.Jun-20Dec
0.321.463.638.922.123131170.51,9123.551,7281,0257022,9574117TBMSTembagaMuliaSemananTbk.[S]Jun-20Dec
0.003.68(3.24)(15.2)(29.2)(6,299)(6,299)(18,898.1)124,505(0.006)777,274611,267166,00786,407(7,254)16PURETrinitanMetalsandMineralsTbk.Mar-20Dec
0.511.150.471.013.24181710.91,079507,1213,8133,3081,030202AGIIAnekaGasIndustriTbk.[S]Jun-20Dec
0.160.20(9.48)(11.3)(26.3)
0.35
1ADMGPolychemIndonesiaTbk.[S]Jun-20Dec3,3015402,7601,188(149)(156)(156)(80.4)710(1.43)
3432.91,0391.471.08
0.280.140.690.784.500.271.106.668543632139283491.794DPNSDutaPertiwiNusantaraTbk.[S]Jun-20Dec
2.121.45(0.247)(0.607)(1.61)349(127)(2.72)448(349)102,63860,82541,81315,8196253BRPTBaritoPacificTbk.[S]Jun-20Dec
0.531.92(1.58)(4.62)(14.1)(182)(97)(13.5)293(11)12,2528,0574,1951,370(257)6ESSASuryaEsaPerkasaTbk.Jun-20Dec
0.960.109.4910.427.74847133.61,2859.2498486898337595EKADEkadharmaInternationalTbk.[S]Jun-20Dec
0.370.218.7710.620.51919194.91,8413.4943675361186248INCIIntanwijayaInternasionalTbk.[S]Jun-20Dec
(0.206)(4.33)(9.45)N/A(57.2)(80)(80)(110.0)(350)(0.655)1,1281,467(339)186(80)7ETWAEterindoWahanatamaTbk.Sep-19Dec
1.720.553.805.9010.7433630.9524291,8986751,2236735710MOLIMadusariMurniIndahTbk.Jun-20Dec
0.480.113.043.3717.9141411.03261491791826155179MDKIEmdekiUtamaTbk.[S]Jun-20Dec
0.680.464.997.289.1819196.46899.287802465344242812SRSNIndoAcidatamaTbk.[S]Jun-20Dec
2.401.085.5911.614.2464417.3149211,5858217646245811SAMFSaraswantiAnugerahMakmurTbk.[S]Jun-20Dec
5.290.93(1.79)(3.46)(7.10)(428)(427)(47.9)1,384(153)47,58122,89224,68812,034(1,084)14TPIAChandraAsriPetrochemicalTbk.[S]Jun-20Dec
0.351.106.1512.931.6758733.12562.725,6472,9622,6851,0986413TDPMTridomainPerformanceMaterialsTbk.[S]Mar-20Dec
0.151.141.302.773.13181852.31,8905.582,7461,4601,2851,1376.301AKPIArghaKaryaPrimaIndustryTbk.[S]Jun-20Dec
1.430.83
0.20
3517.153326
15303.86,693120.55UNICUnggulIndahCahayaTbk.[S]Jun-20Dec3,0825172,5652,27611257583.784.545.12
1.001.38(3.96)(9.45)(14.2)(44)(43)(87.8)929(11)2,1681,258910604(56)3BRNABerlinaTbk.[S]Jun-20Dec
0.750.81(0.098)(0.178)(0.258)(0.190)(0.188)(0.276)155(424)384172211146(0.130)2APLIAsiaplastIndustriesTbk.[S]Jun-20Dec
2.850.571.983.127.340.820.822.568291833053220.965ESIPSinergiIntiPlastindoTbk.[S]Jun-20Dec
4.931.030.821.661.272.442.540.77462963091571532013.804EPACMegalestariEpackSentosarayaTbk.[S]Dec-19Dec
0.470.186.577.7310.9302245.15846.03668100567401397IGARChampionPacificIndonesiaTbk.[S]Jun-20Dec
0.340.733.796.554.71484817.32645.262,5411,0721,4692,0429.836FPNILotteChemicalTitanTbk.[S]Jun-20Dec
0.190.651.702.804.83363310.33666.923,8961,5362,3601,368619IPOLIndopolySwakarsaIndustryTbk.[S]Jun-20Dec
4.280.852.234.127.66222912.22951042,6391,2101,428768358IMPCImpackPratamaIndustriTbk.[S]Jun-20Dec
0.921.421.784.313.5915158.79204211,6809876938322011SMKLSatyamitraKemasLestariTbk.Jun-20Dec
0.970.3412.416.515.1141140149.29035.902,2625681,6941,85418910PBIDPancaBudiIdamanTbk.[S]Jun-20Dec
2.311.130.240.500.45
0.95
14YPASYanaprimaHastapersadaTbk.[S]Jun-20Dec2591371221362.240.310.310.92182458
1319.9809200.48
0.320.430.751.072.135.575.407.98749301,4454321,0135088.7512TALFTunasAlfinTbk.Jun-20Dec
TRSTTriasSentosaTbk.[S]Jun-20Dec4,4312,1592,2721,4842735281.262.463.77](https://image.slidesharecdn.com/7idxmonthlystatisticsjuli2020-201227101938/85/7-idx-monthly-statistics-juli-2020-51-320.jpg)
![48
DATA SERVICES | INDONESIA STOCK EXCHANGE
IDX MONTHLY STATISTICS, JULY 2020
Liabi-
lities
Annual
Profit
for
the
period
Profit
attr.
to
owner's
entity
FinancialData&Ratios
billionIDR
P/E
Ratio,
x
Price
toBV,
x
D/E
Ratio,
x
ROA,
%
ROE,
%
NPM,
%ListedStocks
FS
Date
Fiscal
Year
EndEBT
EPS,
IDR
Book
Value,
IDRSalesAssetsEquity
ANIMALFEED
CPIN
CPRO
JPFA
MAIN
SIPD
WOODINDUSTRIES
SINI
SULI
TIRT
PULP&PAPER
ALDO
FASW
INKP
INRU
KBRI
KDSI
SPMA
SWAT
TKIM
OTHERS
INCF
INOV
KMTR
MISCELLANEOUSINDUSTRY
MACHINERYANDHEAVYEQUIPMENT
AMIN
ARKA
GMFI
KPAL
KRAH
AUTOMOTIVEANDCOMPONENTS
AUTO
BOLT
BRAM
GDYR
GJTL
IMAS
INDS
LPIN
MASA
NIPS
PRAS
SMSM
TEXTILE,GARMENT
ARGO
BELL
(5.04)(6.92)
KMTRKiranaMegataraTbk.Jun-20Dec4,3702,5091,8613,9925838391.794.201.96
KPALSteadfastMarineTbk.Dec-19Dec756565192141(2.05)(3.15)(1.30)(0.172)(0.680)(0.924)
PRASPrimaAlloySteelUniversalTbk.Jun-20Dec1,6501,1085421081914141.685.1225.8
4.490.4110.314.512.01,6511,653201.61,3863132,0059,27522,73027,6012,0591CPINCharoenPokphandIndonesiaTbk.[S]Jun-20Dec
3.154.2439.57882336
1.091.451.122.731.8318115526.59684027,79616,44111,35516,9102433JPFAJapfaComfeedIndonesiaTbk.[S]Jun-20Dec
7.9616.2(6.23)(107.0)(7.27)(300)(300)(6.72)6.28(7.44)6,4326,0583745,510(260)2CPROCentralProteinaPrimaTbk.Sep-19Dec
1.89(3.83)(174.4)(32)5.9737
1.501.640.852.251.02
1.51
5SIPDSieradProduceTbk.[S]Jun-20Dec2,4451,5189272,05013101015.669267
4(39.5)887(15)0.69MAINMalindoFeedmillTbk.[S]Jun-20Dec4,9933,0071,9863,193(35)(44)(44)(1.77)(4.45)(2.77)
8.894.82(0.048)(0.278)(0.057)0.93(0.037)(0.163)58(3,196)154127261282.522SINISingarajaPutraTbk.[S]Jun-20Dec
1.260.106.156.7421.334347.21107191,104981,006319451IFIIIndonesiaFibreboardIndustryTbk.[S]Jun-20Dec
1.311.71246.62,6603.0338
(0.191)(2.77)(132.3)N/A(447.4)
(17.5)
4TIRTTirtaMahakamResourcesTbk.Jun-20Dec487762(275)144(317)(322)(322)(636.2)(272)(0.082)
3(68.4)(21)(0.731)(2.38)SULISLJGlobalTbk.Jun-20Dec1,3771,461(84)394(135)(136)(136)(19.8)N/A(69.2)
3.901.493.939.8011.6218218176.01,7964011,0916,6414,4503,7471632FASWFajarSuryaWisesaTbk.[S]Jun-20Dec
0.770.683.936.587.07251833.450712935377558520331ALDOAlkindoNaratamaTbk.[S]Jun-20Dec
0.502.17(1.36)(4.32)(9.77)(46)(46)(65.6)1,518(12)6,6774,5692,108932(5.41)4INRUTobaPulpLestariTbk.[S]Jun-20Dec
0.710.984.899.6727.42,9062,9071,062.510,9927.34118,86358,72860,13521,2263,5123INKPIndahKiatPulp&PaperTbk.Jun-20Dec
0.491.034.439.016.032828140.01,5535.431,279650629939416KDSIKedawungSetiaIndustrialTbk.[S]Jun-20Dec
3.206.45(4.44)(33.1)(11,749.3)(34)(34)(5.18)16(9.66)1,0138771360.38(26)5KBRIKertasBasukiRachmatIndonesiaTbk.Sep-19Dec
1.001.115.7712.239.8
0.85
9TKIMPabrikKertasTjiwiKimiaTbk.Jun-20Dec44,39223,33821,0546,4371,2911,2821,282823.36,7638.20
8(3.37)116(28)0.82
0.370.635.278.5912.5626258.46804.322,3459071,438991797SPMASuparmaTbk.[S]Jun-20Dec
SWATSriwahanaAdityakartaTbk.[S]Jun-20Dec64729835086(4.39)(5.10)(5.09)(1.57)(2.91)(11.8)
1.33
39.52227331.391.35
2(9.00)179(29)1.46
0.512.29(7.75)(25.5)(82.2)(9.00)(8.93)(24.8)97(2.01)46132114043(9.00)1INCFIndoKomoditiKorporaTbk.Mar-20Dec
1.121.66(8.10)1670.7639
INOVInocycleTechnologyGroupTbk.Jun-20Dec754431323235(11)(8.14)(8.14)(2.16)
4.415.70(34.2)102(19)41
1.441.07(2.83)1,133154.
5.433.26(7.10)(30.2)(166.1)(16)(16)(16.0)53(18)45234610619(16)2ARKAArkhaJayantiPersadaTbk.Jun-20Dec
1.411.13(4.91)(10.5)(74.5)(5.36)(5.36)(19.8)189(14)43623220529(5.36)1AMINAteliersMecaniquesD'IndonesieTbk.[S]Apr-20Jan
13.316.3(5.39)(93.5)(18.0)
2.95
5KRAHGrandKartechTbk.Sep-19Dec59856435179(24)(24)(24)(33.2)36(14)
4(1.22)179(51)0.35
1.554.83(31.8)(185.2)(124.8)(1,420)(1,421)(100.6)54(0.835)8,9457,4111,5352,277(1,698)3GMFIGarudaMaintenanceFacilityAeroAsiaTbk.[S]Jun-20Dec
1.090.796.6211.925.313,13711,378562.14,7349.16343,674152,017191,65789,79514,9861ASIIAstraInternationalTbk.[S]Jun-20Dec
0.941.102.122,1327.3142
2.670.53(1.37)(2.09)(4.20)(10)(7.85)(6.70)320(128)1,150399751374(9.45)3BOLTGarudaMetalindoTbk.[S]Jun-20Dec
0.380.38(3.88)(5.34)(10.5)(337)(296)(122.9)2,300(7.08)15,2524,16611,0865,653(277)2AUTOAstraOtopartsTbk.[S]Jun-20Dec
0.871.47(8.08)(19.9)(20.4)(68)(68)(331.7)1,664(4.37)1,6831,001682666(88)5GDYRGoodyearIndonesiaTbk.[S]Jun-20Dec
0.780.240.310.381.091.805.8926.26,8362033,8107343,0761,081(4.20)4BRAMIndoKordsaTbk.[S]Jun-20Dec
0.204.08(1.53)(7.77)(9.41)(404)(347)(251.3)3,234(2.59)45,39936,4568,9437,380(304)7IMASIndomobilSuksesInternasionalTbk.Jun-20Dec
0.312.00(1.54)(4.61)(4.76)(141)(141)(81.0)1,758(6.67)18,36612,2396,1265,927(155)6GJTLGajahTunggalTbk.[S]Jun-20Dec
0.320.063.874.1029.26.366.3629.97297.8932818310446.949LPINMultiPrimaSejahteraTbk.[S]Jun-20Dec
0.540.091.862.036.52262680.43,960272,8432452,599809348INDSIndospringTbk.[S]Jun-20Dec
0.481.200.190.430.513.103.102.535921122,1341,1669688091211NIPSNipressTbk.Sep-18Dec
1.671.181.292.809.2223239.82350607,0053,7893,2169791410MASAMultistradaArahSaranaTbk.[S]Mar-20Dec
1.410.04(59.9)2952443
2.790.2712.115.327.8
2.05
13SMSMSelamatSempurnaTbk.[S]Jun-20Dec3,3677172,6491,46429422520370.646018
1239.57733.010.15
3.901.350.090.220.201.690.300.421921,8056553772793012.862BELLTrisulaTextileIndustriesTbk.[S]Jun-20Dec
(0.392)(1.94)(5.40)N/A(248.4)(32)(32)(192.0)(3,788)(7.73)1,1922,464(1,271)26(32)1ARGOArgoPantesTbk.Jun-20Dec](https://image.slidesharecdn.com/7idxmonthlystatisticsjuli2020-201227101938/85/7-idx-monthly-statistics-juli-2020-52-320.jpg)
![49IDX MONTHLY STATISTICS, JULY 2020
DATA SERVICES | INDONESIA STOCK EXCHANGE
Liabi-
lities
Annual
Profit
for
the
period
Profit
attr.
to
owner's
entity
FinancialData&Ratios
billionIDR
P/E
Ratio,
x
Price
toBV,
x
D/E
Ratio,
x
ROA,
%
ROE,
%
NPM,
%ListedStocks
FS
Date
Fiscal
Year
EndEBT
EPS,
IDR
Book
Value,
IDRSalesAssetsEquity
CNTB
CNTX
ERTX
ESTI
HDTX
INDR
MYTX
PBRX
POLU
POLY
RICY
SBAT
SRIL
SSTM
STAR
TFCO
TRIS
UCID
UNIT
ZONE
FOOTWEAR
BATA
BIMA
CABLE
CCSI
JECC
KBLI
KBLM
SCCO
VOKS
ELECTRONICS
JSKY
PTSN
SLIS
CONSUMERGOODSINDUSTRY
FOODANDBEVERAGES
ADES
AISA
ALTO
BTEK
BUDI
CAMP
CEKA
CLEO
COCO
DLTA
DMND
FOOD
7.418.36
SLISGayaAbadiSempurnaTbk.Jun-20Dec3571911651791611116.1513.312.2
(0.436)(19.1)(5.05)N/A(5.81)(36)(36)(518.2)(569)(0.479)719758(40)624(28)4CNTXCenturyTextileIndustry(PS)Tbk.Mar-20Mar
(0.817)(19.1)(5.05)N/A(5.81)(36)(36)(279.1)(306)(0.896)719758(40)624(28)3CNTBCenturyTextileIndustry(SeriB)Tbk.Mar-20Mar
0.523.270.190.800.820.770.770.7696668256311931870.556ESTIEverShineTexTbk.Jun-20Dec
0.502.682.137.853.84111117.82266.421,073781291596145ERTXEratexDjajaTbk.Jun-20Dec
0.291.020.290.580.76161647.58,1425010,7755,4485,3284,0793.688INDRIndo-RamaSyntheticsTbk.[S]Jun-20Dec
9.518.12(11.9)(108.6)(1,023.7)(25)(25)(13.7)13(8.75)415369454.82(25)7HDTXPanasiaIndoResourcesTbk.[S]Jun-20Dec
0.411.373.708.767.4117717353.36094.699,3505,4053,9454,66523210PBRXPanBrothersTbk.Jun-20Dec
1.4211.7(1.34)(16.9)(6.88)(26)(25)(6.44)38(8.38)3,7313,436295725(26)9MYTXAsiaPacificInvestamaTbk.Jun-20Dec
(0.009)(1.24)(11.2)N/A(21.3)(180)(180)(143.9)(5,466)(0.348)3,21416,856(13,643)1,686(159)12POLYAsiaPacificFibersTbk.Jun-20Dec
4.271.05(4.01)(8.24)(9.11)(6.52)(6.52)(17.4)211(52)325167158143(6.52)11POLUGoldenFlowerTbk[S]Jun-20Dec
1.822.021.364.128.313.793.793.578744557372184915.3314SBATSejahteraBintangAbadiTextileTbk.Jun-20Dec
0.153.03(6.99)(28.2)(21.3)(57)(56)(175.8)624(0.523)1,6141,214400530(56)13RICYRickyPutraGlobalindoTbk.[S]Jun-20Dec
3.821.241.543.445.513.503.505.981741114562522041274.7716SSTMSunsonTextileManufacturerTbk.[S]Jun-20Dec
0.441.606.0215.616.471371369.74462.8123,68114,5569,1258,69977015SRILSriRejekiIsmanTbk.Jun-20Dec
0.360.040.340.361.377.447.443.088611004,3381864,1521,0837.0818TFCOTificoFiberIndonesiaTbk.[S]Jun-20Dec
1.370.180.450.53204.31.301.300.54102259581904911.271.3017STARStarPetrochemTbk.[S]Jun-20Dec
1.541.09(6.05)(12.6)(25.7)(131)(131)(126.4)1,001(12)8,6864,5244,1622,047(113)20UCIDUni-CharmIndonesiaTbk[S]Mar-20Dec
1.050.870.340.640.67112.121.352111631,2375766616321519TRISTrisulaInternationalTbk.[S]Jun-20Dec
0.922.28(38.5)288(13)44
1.361.19(8.09)(17.7)(33.4)
0.47
22ZONEMegaPerintisTbk.[S]Jun-20Dec585318267142(25)(25)(24)(54.4)307(7.64)
215.833,275270.05UNITNusantaraIntiCorporaTbk.[S]Jun-20Dec364117247530.330.250.220.120.180.83
0.670.59193.33,3143845
0.634.04(13.0)(65.8)(96.6)
0.51
2BIMAPrimarindoAsiaInfrastructureTbk.Jun-20Dec2431954833(20)(16)(16)(52.1)79(0.959)
1(24.8)496(24)1.21BATASepatuBataTbk.[S]Mar-20Dec974329645151(10)(8.07)(8.07)(3.31)(5.00)(21.5)
0.270.30(2.48)(3.23)(7.76)(7.94)(7.94)(25.9)804(8.40)1,282298984409(8.26)2IKBISumiIndoKabelTbk.[S]Jun-20Mar
0.740.363.705.0313.98.168.1616.332415440116324117101CCSICommunicationCableSystemsIndonesiaTbk[S]Jun-20Dec
0.670.31(6.01)(7.89)(19.9)(100)(90)(44.8)568(8.48)2,9877102,277902(91)4KBLIKMIWireandCableTbk.[S]Jun-20Dec
1.360.990.350.700.712.662.6635.25,0131931,5127547587483.103JECCJemboCableCompanyTbk.[S]Jun-20Dec
0.731.551.523.884.50
0.25
7VOKSVokselElectricTbk.[S]Jun-20Dec2,8801,7491,13297429222210.627219
61,357.115,4587.220.63
0.290.360.450.621.192.622.624.68760471,1573068514413.835KBLMKabelindoMurniTbk.[S]Jun-20Dec
SCCOSupremeCableManufacturing&CommerceTbk.[S]Jun-20Dec3,9868083,1782,1021781401397.008.7813.3
0.85
311.08346762.01.16
216.2219130.96
0.711.194.399.6023.95.375.3710.61107.38489265224907.161JSKYSkyEnergyIndonesiaTbk.[S]Mar-20Dec
0.831.0712.61371046
PTSNSatNusapersadaTbk.[S]Jun-20Dec2,1519891,1611,0305643434.00
3.150.8188.57461351
3.510.851,347.94,836155.
(0.608)(2.64)0.50N/A3.132.712.722.27(276)742,1663,489(1,323)3472.342AISATigaPilarSejahteraFoodTbk.Mar-20Dec
0.960.359.7613.125.04040135.41,0307.31818210608320471ADESAkashaWiraInternationalTbk.[S]Jun-20Dec
1.141.57(5.57)(14.3)(45.4)(145)(145)(6.27)44(7.97)5,2163,1882,028640(145)4BTEKBumiTeknokulturaUnggulTbk.[S]Jun-20Dec
2.021.96(2.02)(5.97)(14.3)(11)(11)(10.1)169(34)1,094724370154(11)3ALTOTriBanyanTirtaTbk.Jun-20Dec
1.220.132.793.156.5115155.07161391,071122949459186CAMPCampinaIceCreamIndustryTbk.[S]Jun-20Dec
0.311.240.922.062.3116135.95289152,9141,6131,3011,157205BUDIBudiStarch&SweetenerTbk.[S]Jun-20Dec
7.460.629.6615.626.2656510.869481,340511828494828CLEOSarigunaPrimatirtaTbk.[S]Jun-20Dec
0.890.149.7811.28.166767225.02,0148.001,3691711,1981,640867CEKAWilmarCahayaIndonesiaTbk.[S]Jun-20Dec
3.030.124.945.5534.2353586.71,563551,4061551,2512034210DLTADeltaDjakartaTbk.Jun-20Dec
4.071.241.783.989.342.222.227.93199102250138112483.109COCOWahanaInterfoodNusantaraTbk.[S]Jun-20Dec
1.040.72(2.50)(4.31)(6.59)(1.73)(1.57)(4.83)112(24)126537348(2.55)12FOODSentraFoodIndonesiaTbk.[S]Jun-20Dec
1.960.223.233.965.98928918.7474505,4921,0054,4882,96712011DMNDDiamondFoodIndonesiaTbk.[S]Jun-20Dec](https://image.slidesharecdn.com/7idxmonthlystatisticsjuli2020-201227101938/85/7-idx-monthly-statistics-juli-2020-53-320.jpg)
![50
DATA SERVICES | INDONESIA STOCK EXCHANGE
IDX MONTHLY STATISTICS, JULY 2020
Liabi-
lities
Annual
Profit
for
the
period
Profit
attr.
to
owner's
entity
FinancialData&Ratios
billionIDR
P/E
Ratio,
x
Price
toBV,
x
D/E
Ratio,
x
ROA,
%
ROE,
%
NPM,
%ListedStocks
FS
Date
Fiscal
Year
EndEBT
EPS,
IDR
Book
Value,
IDRSalesAssetsEquity
GOOD
HOKI
ICBP
IKAN
INDF
KEJU
MLBI
MYOR
PANI
PCAR
PSDN
ROTI
SKBM
SKLT
STTP
TBLA
ULTJ
TOBACCOMANUFACTURERS
GGRM
HMSP
RMBA
WIIM
PHARMACEUTICALS
DVLA
INAF
KAEF
KLBF
MERK
PEHA
PYFA
SCPI
SIDO
TSPC
COSMETICSANDHOUSEHOLD
KINO
KPAS
MBTO
MRAT
TCID
UNVR
HOUSEWARE
CBMF
CINT
KICI
LMPI
SOFA
WOOD
ULTJUltraJayaMilkIndustry&TradingCompanyTbk.[S]Jun-20Dec7,0548496,2053,01975956255515.717.936.8
WIIMWismilakIntiMakmurTbk.Jun-20Dec1,4373661,0718295744446.078.1410.5
2.430.255.767.186.35242420.1280348331656687563214HOKIBuyungPoetraSembadaTbk.[S]Jun-20Dec
3.440.9210.219.525.014514076.1390185,5182,6432,8752,24621213GOODGarudafoodPutraPutriJayaTbk.[S]Mar-20Dec
4.750.07(3.23)(3.45)(161.0)(6.10)(6.10)(0.363)11(138)378243537.57(8.07)16IIKPIntiAgriResourcesTbk.[S]Jun-20Dec
3.560.4415.522.429.33,5853,378579.32,5871643,45813,28830,17123,0474,74415ICBPIndofoodCBPSuksesMakmurTbk.[S]Jun-20Dec
0.990.805.509.9114.43,4642,843647.56,5309.96103,39546,05657,34039,3854,96018INDFIndofoodSuksesMakmurTbk.[S]Jun-20Dec
8.250.87(3.26)(6.10)(11.6)(2.08)(2.08)(4.99)82(135)127596836(2.11)17IKANEraMandiriCemerlangTbk.Jun-20Dec
17.11.883.6410.515.8636359.95731643,4732,2651,2088009620MLBIMultiBintangIndonesiaTbk.Jun-20Dec
3.330.3616.522.545.1262669.2308156281674612303519KEJUMuliaBogaRayaTbk.[S]Mar-20Dec
0.602.38(0.016)(0.054)(0.028)(0.012)(0.011)(0.053)97(1,093)135954079(0.116)22PANIPratamaAbadiNusaIndustriTbk.[S]Jun-20Dec
4.840.6910.217.316.996393883.94862818,3517,48910,86211,0821,22921MYORMayoraIndahTbk.[S]Jun-20Dec
1.004.21(10.1)(52.7)(19.6)(32)(38)(52.8)100(1.90)750606144388(26)24PSDNPrasidhaAnekaNiagaTbk.Jun-20Dec
6.480.54(16.4)(25.3)(80.6)(9.43)(9.43)(16.2)64(26)115407523(9.43)23PCARPrimaCakrawalaAbadiTbk.[S]Jun-20Dec
0.510.75(0.648)(1.13)(0.842)(8.05)(5.41)(6.27)552(45)1,6687159531,285(9.18)26SKBMSekarBumiTbk.[S]Jun-20Dec
2.730.733.796.5310.9609129.6453424,8302,0302,8001,6749425ROTINipponIndosariCorpindoTbk.[S]Jun-20Dec
4.300.2917.923.030.9278278424.51,848193,1116902,4211,80034428STTPSiantarTopTbk.[S]Jun-20Dec
2.861.054.449.105.49181851.2563317964073896452127SKLTSekarLautTbk.[S]Jun-20Dec
2.760.60
0.14
52819.65,94220
3096.1537173.03
0.692.423.3211.411.3321321120.21,0586.0719,34213,6875,6545,68741329TBLATunasBaruLampungTbk.Jun-20Dec
7.450.5723.336.721.84,8864,88684.02292041,90515,29326,61244,7336,3462HMSPH.M.SampoernaTbk.Jun-20Dec
1.760.459.6514.014.23,8213,8213,971.528,4561379,15924,40754,75253,6554,9381GGRMGudangGaramTbk.Jun-20Dec
1.040.87(2.14)(4.01)(4.36)(165)(165)(9.09)227(26)15,4337,1848,2497,596(165)4RMBABentoelInternasionalInvestamaTbk.Jun-20Dec
2.940.751.943.399.094.594.599.75287874732032701016.543ITICIndonesianTobaccoTbk.Jun-20Dec
1.820.4113.819.529.9139139248.21,2759.352,0115821,4289281791DVLADarya-VariaLaboratoriaTbk.[S]Jun-20Dec
3.800.91
0.34
537,164.221,38920
541.55107.700.63
1.801.530.551.402.07514917.51,24812917,51410,5816,9334,688813KAEFKimiaFarmaTbk.[S]Jun-20Dec
14.61.85(6.22)(17.7)(57.9)(21)(21)(27.7)156(82)1,378895484148(29)2INAFIndofarmaTbk.[S]Mar-20Dec
2.620.526.7310.322.73232143.41,39826954328626283435MERKMerckTbk.[S]Jun-20Dec
4.270.2912.616.223.91,4081,38859.23672622,0914,91017,18111,6051,8094KLBFKalbeFarmaTbk.[S]Jun-20Dec
3.650.545.668.749.375.705.7021.324442201711301227.137PYFAPyridamFarmaTbk.[S]Jun-20Dec
1.751.972.597.6911.8272764.0833232,0761,377699454356PEHAPhaprosTbk.[S]Jun-20Dec
6.340.1224.026.956.741441455.2205243,4443673,0781,4605339SIDOIndustriJamudanFarmasiSidoMunculTbk.[S]Jun-20Dec
0.141.3714.534.319.212812870,896.1206,8370.411,7631,0187451,3291758SCPIMerckSharpDohmePharmaTbk.[S]Jun-20Dec
1.750.944.518.7610.8118119166.11,896205,2662,5582,7082,1941511KINOKinoIndonesiaTbk.[S]Jun-20Dec
6.610.97
0.47
54(41.1)2,1174.08
10164.81,3238.371.04TSPCTempoScanPacificTbk.[S]Jun-20Dec8,7572,8025,9555,3555024023718.4712.513.8
0.402.02(15.2)(46.0)(52.6)(44)(44)(82.2)179(0.876)578387191167(57)3MBTOMartinaBertoTbk.[S]Jun-20Dec
0.260.73(0.321)(0.555)(2.26)(0.415)(0.404)(1.05)190(47)25210614636(0.415)2KPASCottonindoAriestaTbk.[S]Jun-20Dec
0.720.21(4.64)(5.63)(10.6)(53)(53)(526.2)9,340(13)2,2804021,878997(48)5TCIDMandomIndonesiaTbk.[S]Jun-20Dec
0.170.460.540.782.031.451.456.79865215401703701433.214MRATMustikaRatuTbk.[S]Jun-20Dec
1.650.383.364.6323.05.785.786.161333634494250507.881CBMFCahayaBintangMedanTbk.[S]Jun-20Dec
2.811.01
1.42
55(0.214)26024
6189.82314436.4UNVRUnileverIndonesiaTbk.[S]Jun-20Dec21,35212,5448,80821,7724,6033,6203,62033.982.233.3
0.800.84(1.50)(2.76)(4.96)(1.19)(1.19)(8.62)312(29)1597286480.333KICIKedaungIndahCanTbk.[S]Jun-20Dec
0.660.320.470.621.781.031.212.433911065181263911362.812CINTChitoseInternasionalTbk.[S]Jun-20Dec
1.88
6WOODIntegraIndocabinetTbk.[S]Jun-20Dec5,5922,7752,8171,13414411411336.044711
50.235.8031812.6
0.311.63(5.30)(14.0)(18.2)(19)(19)(37.4)268(2.19)712442270208(24)4LMPILanggengMakmurIndustriTbk.[S]Jun-20Dec
SOFABostonFurnitureIndustriesTbk.Jun-20Dec28189.57110.300.190.191.383.963.53
0.850.984.058.0520.0](https://image.slidesharecdn.com/7idxmonthlystatisticsjuli2020-201227101938/85/7-idx-monthly-statistics-juli-2020-54-320.jpg)
![51IDX MONTHLY STATISTICS, JULY 2020
DATA SERVICES | INDONESIA STOCK EXCHANGE
Liabi-
lities
Annual
Profit
for
the
period
Profit
attr.
to
owner's
entity
FinancialData&Ratios
billionIDR
P/E
Ratio,
x
Price
toBV,
x
D/E
Ratio,
x
ROA,
%
ROE,
%
NPM,
%ListedStocks
FS
Date
Fiscal
Year
EndEBT
EPS,
IDR
Book
Value,
IDRSalesAssetsEquity
OTHERS
HRTA
PROPERTY,REALESTATEANDBUILDINGCONSTRUCTION
PROPERTYANDREALESTATE
AMAN
APLN
ARMY
ASPI
ASRI
BAPA
BAPI
BBSS
BCIP
BEST
BIKA
BIPP
BKDP
BKSL
BSDE
CITY
COWL
CPRI
CTRA
DADA
DART
DILD
DMAS
DUTI
ELTY
EMDE
FMII
FORZ
GAMA
GMTD
GPRA
GWSA
INDO
INPP
JRPT
KBAG
KIJA
KOTA
LAND
LCGP
LPCK
LPKR
MABA
MDLN
MKPI
1.252.247.15854(1.18)6.
1.14
134.32806.830.841.14
5934.32806.830.84
HRTAHartadinataAbadiTbk.[S]Jun-20Dec2,7601,4691,2901,9699979795.7212.28.01
1.320.400.881.2316.92.053.551.83149107805228577421.821AMANMakmurBerkahAmandaTbk.[S]Jun-20Dec
1.250.8418.6902(6.61)61
0.310.281.021.3023.914142.10161241,8554071,44879163ARMYArmidianKaryatamaTbk.[S]Sep-19Dec
0.231.67(0.020)(0.052)(0.349)117(3.00)(0.264)506(443)30,63219,14711,4841,7211982APLNAgungPodomoroLandTbk.[S]Jun-20Dec
0.261.49(24.0)(59.7)(1,827.0)(1,374)(1,370)(279.0)468(0.441)22,85413,6669,188300(1,361)5ASRIAlamSuteraRealtyTbk.[S]Mar-20Dec
2.410.44(2.24)(3.23)(187.2)(1.09)(1.09)(3.22)100(75)9830681.17(1.09)4ASPIAndalanSaktiPrimaindoTbk.[S]Jun-20Dec
0.650.46(0.718)(1.05)(135.3)(2.26)(2.26)(0.809)77(62)6301994313.34(2.18)7BAPIBhaktiAgungPropertindoTbk.[S]Jun-20Dec
0.250.09(4.09)(4.44)(164.1)(2.94)(2.94)(8.88)200(5.63)144111323.58(2.94)6BAPABekasiAsriPemulaTbk.[S]Jun-20Dec
0.160.933.426.6049.5161520.73142.4186741844960189BCIPBumiCitraPermaiTbk.[S]Jun-20Dec
2.440.02(0.429)(0.437)(34.9)(0.549)(0.549)(0.229)52(559)2564.222523.14(0.460)8BBSSBumiBenowoSuksesSejahteraTbk.[S]Jun-20Dec
0.223.40(2.27)(9.98)(83.0)(93)(26)(87.8)880(2.16)2,2961,77552163(93)11BIKABinakaryaJayaAbadiTbk.Jun-20Dec
0.270.44(1.17)(1.68)(48.4)(37)(37)(7.72)459(16)6,3951,9644,431154(34)10BESTBekasiFajarIndustrialEstateTbk.[S]Jun-20Dec
0.750.64(3.28)(5.40)(161.8)(13)(13)(3.58)66(14)81932149817(12)13BKDPBukitDarmoPropertyTbk.[S]Jun-20Dec
0.300.832.925.3318.6633112.52345.682,1529731,1793387312BIPPBhuwanatalaIndahPermaiTbk.[S]Jun-20Dec
0.430.78(0.296)(0.526)(7.64)(16)(89)(8.44)1,604(82)60,41226,45233,9602,338(18)15BSDEBumiSerpongDamaiTbk.[S]Jun-20Dec
0.310.610.290.465.2069500.741596817,2756,57810,6979516814BKSLSentulCityTbk.[S]Dec-19Dec
0.273.10(0.944)(3.87)(14.6)(26)(26)(7.09)183(7.05)3,6612,769892237(5.77)17COWLCowellDevelopmentTbk.Sep-19Dec
0.360.23(0.750)(0.921)(24.1)(3.70)(3.70)(1.37)149(39)98618380331(3.67)16CITYNaturaCityDevelopmentsTbk.[S]Jun-20Dec
0.711.220.891.9912.116217018.39183637,88420,84117,0432,80425719CTRACiputraDevelopmentTbk.[S]Jun-20Dec
0.640.24(0.988)(1.22)(293.8)(0.582)(0.582)(0.957)78(52)236451910.79(0.533)18CPRICapriNusaSatuPropertiTbk.Mar-20Dec
0.221.15(5.87)(12.6)(231.6)(197)(197)(125.2)993(1.73)6,6983,5803,118170(193)21DARTDutaAnggadaRealtyTbk.Jun-20Dec
1.960.7628.349.981.9363619.9403.935042182861744020DADADiamondCitraPropertindoTbk.[S]Mar-20Dec
1.940.282.262.9062.579793.28113676,9881,5345,4532538523DMASPuradeltaLestariTbk.[S]Jun-20Dec
0.311.641.132.9811.9829017.35811015,9179,8916,0261,5107622DILDIntilandDevelopmentTbk.[S]Jun-20Dec
0.240.39(3.85)(5.37)(67.6)(424)(370)(11.3)211(4.41)12,7923,6109,182729(421)25ELTYBakrielandDevelopmentTbk.[S]Sep-19Dec
0.660.312.272.9843.9197157170.15,7112213,8483,28310,56571819824DUTIDutaPertiwiTbk.[S]Jun-20Dec
3.240.40(1.16)(1.63)(45.0)(5.10)(5.10)(3.75)230(199)87925362623(4.52)27FMIIFortuneMateIndonesiaTbk.[S]Jun-20Dec
0.911.93(2.72)(7.98)(113.3)(30)(30)(17.7)222(11)2,1791,43674352(27)26EMDEMegapolitanDevelopmentsTbk.Jun-20Dec
0.460.28(1.04)(1.33)(127.1)(7.37)(7.30)(1.46)109(34)1,3993051,09411(7.32)29GAMAGadingDevelopmentTbk.[S]Jun-20Dec
0.341.042.034.14128.76.076.056.101478.205973052929.406.0728FORZForzaLandIndonesiaTbk.Jun-20Dec
0.200.680.130.221.656.551.180.55246911,7617111,0501446.7531GPRAPerdanaGapuraprimaTbk.[S]Jun-20Dec
2.640.600.220.353.341.211.2123.86,8097551,103411691721.4630GMTDGowaMakassarTourismDevelopmentTbk.[S]Jun-20Dec
0.700.1317.019.322,901.6454541.52153.641,0521259270.784533INDORoyalindoInvestaWijayaTbk.[S]Mar-20Dec
0.110.081.311.42476.8465012.89067.957,6285637,066214732GWSAGreenwoodSejahteraTbk.[S]Jun-20Dec
0.770.596.9011.078.340940358.65357.0411,6654,3147,3511,02841335JRPTJayaRealPropertyTbk.[S]Jun-20Dec
1.230.293.164.0798.213813023.3571308,2311,8436,38926513034INPPIndonesianParadisePropertyTbk.[S]Jun-20Dec
0.530.97(1.37)(2.71)(13.5)(12)(84)(8.09)299(20)12,2776,0606,2171,252(9.74)37KIJAKawasanIndustriJababekaTbk.[S]Jun-20Dec
6.810.203.023.6468.37.147.142.005518747280393217.6636KBAGKaryaBersamaAnugerahTbk.[S]Jun-20Dec
1.050.33(0.534)(0.711)(41.0)(0.961)(0.961)(1.38)194(148)7201805419.37(0.780)39LANDTrimitraPropertindoTbk.Mar-20Dec
5.490.23(2.08)(2.56)(1,068.9)(16)(16)(3.12)122(214)1,5863011,2863.08(16)38KOTADMSPropertindoTbk.[S]Jun-20Dec
0.210.295.857.5675.2410400298.73,9512.7313,6943,10710,5871,06442041LPCKLippoCikarangTbk.[S]Jun-20Dec
0.400.03(0.339)(0.348)(609.4)(1.49)(1.38)(0.984)283(116)1,635411,5940.91(1.47)40LCGPEurekaPrimaJakartaTbk.[S]Mar-20Dec
2.716.84(11.8)(92.1)(575.6)(266)(262)(17.0)18(2.94)2,2251,94128445(266)43MABAMargaAbhinayaAbadiTbk.Dec-19Dec
0.310.91(4.19)(7.99)(47.4)(1,216)(1,251)(35.3)442(3.91)59,77528,44731,3285,276(1,093)42LPKRLippoKarawaciTbk.[S]Jun-20Dec
2.480.382.934.0439.8113113239.15,924617,7282,1115,61757013945MKPIMetropolitanKentjanaTbk.[S]Jun-20Dec
0.091.41(3.74)(9.02)(569.1)(159)(159)(50.8)563(1.02)17,0009,9477,054112(144)44MDLNModernlandRealtyTbk.[S]Mar-20Dec](https://image.slidesharecdn.com/7idxmonthlystatisticsjuli2020-201227101938/85/7-idx-monthly-statistics-juli-2020-55-320.jpg)
![52
DATA SERVICES | INDONESIA STOCK EXCHANGE
IDX MONTHLY STATISTICS, JULY 2020
Liabi-
lities
Annual
Profit
for
the
period
Profit
attr.
to
owner's
entity
FinancialData&Ratios
billionIDR
P/E
Ratio,
x
Price
toBV,
x
D/E
Ratio,
x
ROA,
%
ROE,
%
NPM,
%ListedStocks
FS
Date
Fiscal
Year
EndEBT
EPS,
IDR
Book
Value,
IDRSalesAssetsEquity
MMLP
MPRO
MTLA
MTSM
MYRX
MYRXP
NIRO
NZIA
OMRE
PAMG
PLIN
POLI
POLL
POSA
PPRO
PUDP
PWON
RBMS
RDTX
REAL
RIMO
RISE
RODA
SATU
SMDM
SMRA
TARA
TRIN
URBN
BUILDINGCONSTRUCTION
ACST
ADHI
CSIS
DGIK
IDPR
JKON
MTRA
NRCA
PBSA
PTPP
SKRN
SSIA
TAMA
TOPS
TOTL
WEGE
WIKA
WSKT
INFRASTRUCTURE,UTILITIESANDTRANSPORTATION
8.938.38
WEGEWijayaKaryaBangunanGedungTbk.[S]Mar-20Dec5,9613,7252,2369578383825.4814.634.1
6.030.311.431.8733.513132.571383231,7894211,368761547MPROMahaPropertiIndonesiaTbk.Jun-20Dec
0.220.231.952.3971.5966920.18389.377,0811,3105,7711939646MMLPMegaManunggalPropertyTbk.[S]Jun-20Dec
0.860.40(0.887)(1.24)(5.82)(0.335)(0.335)(2.88)232(69)762254120.2049MTSMMetroRealtyTbk.[S]Jun-20Dec
0.760.473.044.4845.2968823.1515175,8111,8703,94139011748MTLAMetropolitanLandTbk.[S]Jun-20Dec
0.010.520.801.2111.2987792.17,5850.5412,9044,4028,50292311751MYRXPHansonInternational(SeriB)Tbk.Sep-19Dec
0.510.520.801.2111.298771.19984212,9044,4028,50292311750MYRXHansonInternationalTbk.Sep-19Dec
0.860.340.590.7916.72.492.001.82231109679171508242.8153NZIANusantaraAlmaziaTbk.[S]Jun-20Dec
0.510.290.570.7420.014242.15291698,3201,8686,4522393752NIROCityRetailDevelopmentsTbk.Jun-20Dec
0.540.311.712.2437.35.005.003.2014324586139447275.8255PAMGBimaSaktiPertiwiTbk.[S]Jun-20Dec
0.150.15(4.08)(4.69)(464.0)(88)(87)(99.4)2,119(3.18)4,2505523,69837(88)54OMREIndonesiaPrimaPropertyTbk.[S]Jun-20Dec
1.320.488.9513.3252.95757114.38629.972,5708371,733916157POLIPolluxInvestasiInternasionalTbk.Mar-20Dec
0.840.113.654.0594.0232232130.63,2272112,6971,24011,45749322456PLINPlazaIndonesiaRealtyTbk.[S]Jun-20Dec
1.943.80(8.42)(40.4)(261.4)(44)(44)(10.4)26(4.80)1,03982321633(44)59POSABlissPropertiIndonesiaTbk.Jun-20Dec
15.11.531.172.9710.0183698.242775095,8353,5292,30668419958POLLPolluxPropertiIndonesiaTbk.[S]Dec-19Dec
0.230.65(4.05)(6.67)(81.4)(11)(11)(66.8)1,002(3.50)54421433027(10)61PUDPPudjiadiPrestigeTbk.[S]Jun-20Dec
0.652.900.552.1613.354511.67773018,56913,8074,7627725460PPROPPPropertiTbk.[S]Jun-20Dec
0.230.33(5.03)(6.71)(245.0)(20)(20)(14.8)220(3.39)77919558416(20)63RBMSRistiaBintangMahkotasejatiTbk.[S]Jun-20Dec
1.200.563.645.6748.952348320.03542126,4929,45917,0341,97453662PWONPakuwonJatiTbk.[S]Jun-20Dec
0.950.000.000.000.300.010.010.005319,4563501.543495.710.1565REALRepowerAsiaIndonesiaTbk.[S]Jun-20Dec
0.540.127.998.94121.0118118878.69,8326.092,9573142,64319513864RDTXRodaVivatexTbk.Jun-20Dec
2.070.25(0.868)(1.08)(27.5)(17)(10)(2.05)189(191)2,3444661,87874(16)67RISEJayaSuksesMakmurSentosaTbk.[S]Jun-20Dec
0.370.091.521.6620.281772.27137226,7415706,1725088266RIMORimoInternationalLestariTbk.[S]Sep-19Dec
0.692.04(6.82)(20.8)(158.3)(9.66)(9.35)(15.0)72(3.34)2741849012(11)69SATUKotaSatuPropertiTbk.Jun-20Dec
0.290.70(1.85)(3.14)(135.5)(42)(37)(5.46)174(9.15)4,0211,6562,36555(49)68RODAPikkoLandDevelopmentTbk.[S]Jun-20Dec
0.730.07(0.426)(0.454)(97.3)
1.76
72TARASitaraPropertindoTbk.[S]Jun-20Dec1,121691,0524.91(2.31)(2.31)(2.39)(0.474)104(160)
711.416484240.93
0.180.22(0.284)(0.347)(4.83)4.76(4.56)(1.91)551(52)3,2115832,6281898.2870SMDMSuryamasDutamakmurTbk.Jun-20Dec
SMRASummareconAgungTbk.[S]Jun-20Dec25,75216,4099,3432,18213238100.080.220.94
4.041.550.360.9319.92.542.543.143384352,7821,6891,093512.5474URBNUrbanJakartaPropertindoTbk.[S]Mar-20Dec
1.611.83(0.357)(1.01)(20.1)(11)(3.66)(1.68)166(159)2,0511,32772436(11)73TRINPerintisTrinitiPropertiTbk.[S]Jun-20Dec
5.11113.4(12.1)(1,385.0)(67.4)(250)(252)(720.6)52(0.369)4,1654,12936749(250)1ACSTAcsetIndonusaTbk.[S]Jun-20Dec
1.248.01(39.7)6582062
0.251.242.575.7561.15.863.7611.52004.44585324261256.743CSISCahayasaktiInvestindoSuksesTbk.[S]Mar-20Dec
0.385.700.060.400.4111116.331,5809537,69132,0665,6255,527172ADHIAdhiKarya(Persero)Tbk.[S]Jun-20Dec
0.350.65(14.1)(23.4)(72.7)(131)(126)(125.8)539(1.49)1,7847051,079347(131)5IDPRIndonesiaPondasiRayaTbk.[S]Jun-20Dec
0.420.85(2.77)(5.11)(15.5)(17)(17)(6.04)118(8.28)1,210556654216(16)4DGIKNusaKonstruksiEnjiniringTbk.[S]Jun-20Dec
1.612.381.234.161.833.593.646.30151393942781172656.147MTRAMitraPemudaTbk.[S]Sep-19Dec
2.230.80(2.41)(4.33)(8.73)(59)(57)(7.00)162(51)4,7422,1062,6361,308(30)6JKONJayaKonstruksiManggalaPratamaTbk.[S]Jun-20Dec
1.890.336.488.6016.3242432.237522746184562296309PBSAParamitaBangunSaranaTbk.[S]Jun-20Dec
0.620.903.626.867.61434334.55049.032,3851,1281,2571,133768NRCANusaRayaCiptaTbk.[S]Jun-20Dec
1.461.55(1.40)(3.58)(9.05)(11)(11)(15.2)424(41)1,624988636252(8.85)11SKRNSuperkraneMitraUtamaTbk.[S]Jun-20Dec
0.432.810.060.220.4730165.142,29019054,11939,91914,2006,74624510PTPPPP(Persero)Tbk.[S]Jun-20Dec
3.032.140.451.435.370.390.390.775421217011654140.9513TAMALancartamaSejatiTbk.Jun-20Dec
0.410.81(3.14)(5.69)(16.8)(115)(123)(52.2)918(7.20)7,8223,5054,3171,466(120)12SSIASuryaSemestaInternusaTbk.[S]Jun-20Dec
0.642.640.652.369.451529944.21,8722761,11644,32516,7924,19915717WIKAWijayaKarya(Persero)Tbk.[S]Mar-20Dec
1.66
1634.12345.690.831.67
1529.5330100.92
1.411.33(7.02)(16.3)(28.3)(193)(193)(5.79)35(8.64)2,7511,5681,182681(144)14TOPSTotalindoEkaPersadaTbk.[S]Dec-19Dec
TOTLTotalBangunPersadaTbk.[S]Jun-20Dec2,9981,8711,1271,2015150503.36
1.65(0.637)16.3525167.
0.313.270.150.634.10104312.62,00950116,36689,09627,2704,1702618WSKTWaskitaKarya(Persero)Tbk.Mar-20Dec](https://image.slidesharecdn.com/7idxmonthlystatisticsjuli2020-201227101938/85/7-idx-monthly-statistics-juli-2020-56-320.jpg)
![53IDX MONTHLY STATISTICS, JULY 2020
DATA SERVICES | INDONESIA STOCK EXCHANGE
Liabi-
lities
Annual
Profit
for
the
period
Profit
attr.
to
owner's
entity
FinancialData&Ratios
billionIDR
P/E
Ratio,
x
Price
toBV,
x
D/E
Ratio,
x
ROA,
%
ROE,
%
NPM,
%ListedStocks
FS
Date
Fiscal
Year
EndEBT
EPS,
IDR
Book
Value,
IDRSalesAssetsEquity
ENERGY
KEEN
KOPI
LAPD
MPOW
PGAS
POWR
RAJA
TGRA
TOLLROAD,AIRPORT,HARBORANDALLIEDPRODUCTS
CASS
CMNP
IPCC
JSMR
KARW
META
TEBE
TELECOMMUNICATION
BTEL
EXCL
FREN
ISAT
JAST
TLKM
TRANSPORTATION
AKSI
ASSA
BBRM
BESS
BIRD
BLTA
BPTR
BULL
CANI
CMPP
DEAL
GIAA
HELI
HITS
IATA
IPCM
JAYA
KJEN
LEAD
LRNA
MBSS
MIRA
NELY
PORT
PGASPerusahaanGasNegaraTbk.[S]Mar-20Dec129,89276,18153,71114,3021,5089247822.415.8221.9
JSMRJasaMarga(Persero)Tbk.[S]Jun-20Dec102,69178,59124,1016,775153(115)1060.210.883.12
0.630.672.824.7292.8695328.8610133,7441,5062,238114311KEENKencanaEnergiLestariTbk.[S]Jun-20Dec
0.710.4625.05310.2471
(1.76)(2.25)(37.9)N/A(1,862.9)(27)(27)(13.5)(28)(3.71)141254(113)2.87(27)3LAPDLeyandInternationalTbk.[S]Jun-20Dec
4.061.000.190.380.340.190.170.481251,0621748787981.252KOPIMitraEnergiPersadaTbk.[S]Jun-20Dec
1.060.945.4010.531.4
1.42
6POWRCikarangListrindoTbk.[S]Jun-20Dec19,2649,3309,9343,31371452052064.661710
5129.02,2169.800.57
0.290.88(1.85)(3.47)(26.6)(2.48)(2.48)(6.07)175(8.40)26812514319(2.29)4MPOWMegapowerMakmurTbk.Jun-20Dec
0.540.64(1.66)(2.73)(120.4)(4.68)(4.72)(3.43)126(20)5682213467.84(5.15)8TGRATerregraAsiaEnergyTbk.[S]Jun-20Dec
0.290.390.040.060.135.630.490.234105182,4056721,733758197RAJARukunRaharjaTbk.[S]Jun-20Dec
0.811.75(0.920)(2.53)(2.02)27(7.14)(6.84)271(32)1,553988565708531CASSCardigAeroServicesTbk.[S]Jun-20Dec
0.930.8823.08991472
0.730.79(0.025)(0.044)(0.271)(0.238)(0.238)(0.262)590(1,652)1,9258521,073176(1.52)3IPCCIndonesiaKendaraanTerminalTbk.[S]Jun-20Dec
0.440.884.698.8292.1165181200.52,2734.9415,4777,2478,2307881992CMNPCitraMargaNusaphalaPersadaTbk.[S]Mar-20Dec
0.600.721.292.227.8253374.17187275,7122,3953,317943696METANusantaraInfrastructureTbk.[S]Jun-20Dec
(0.059)(1.56)(8.01)N/A(124.3)
3.26
5KARWICTSIJasaPrimaTbk.[S]Jun-20Dec279776(497)18(11)(11)(11)(38.1)(847)(1.31)
429.13,3211351.18
1.321.45108.5902(3.67)73
2.800.32(4.18)(5.52)(39.7)(18)(18)(27.6)499(51)84720664289(18)7TEBEDanaBrataLuhurTbk.[S]Jun-20Dec
1.302.468.5029.493.61,5201,520567.81,9294.4071,51250,86420,6486,4971,5462EXCLXLAxiataTbk.[S]Mar-20Dec
(0.121)(1.00)46.4N/A70.97.287.280.20(414)2531615,260(15,244)107.341BTELBakrieTelecomTbk.Dec-19Dec
0.740.74(9.25)(16.1)(92.8)(4.80)(3.42)(16.8)104(4.57)148638515(4.80)5JASTJasnitaTelekomindoTbk.[S]Mar-20Dec
0.933.56(1.12)(5.10)(5.07)
2.02
4ISATIndosatTbk.[S]Jun-20Dec61,07947,69313,38613,452(261)(318)(341)(125.5)2,463(18)
3(11.2)53(13)2.71FRENSmartfrenTelecomTbk.[S]Jun-20Dec34,76923,25611,5134,303(1,438)(1,222)(1,222)(7.03)(21.2)(56.8)
1.81(1.94)(11.2)3059.4874
2.390.919.6918.568.68,3015,862236.71,27713241,914115,367126,54734,19410,9246TLKMTelekomunikasiIndonesia(Persero)Tbk.[S]Mar-20Dec
1.292.632.729.8819.8263541.0415135,1113,7021,409702272ASSAAdiSaranaArmadaTbk.Mar-20Dec
2.051.46(16.5)(40.5)(17.0)(19)(19)(53.3)132(5.07)23313895226(19)1AKSIMamingEnamSembilanMineralTbk.[S]Jun-20Dec
3.071.172.996.4713.19.039.035.318247605326279137114BESSBatulicinNusantaraMaritimTbk.Jun-20Dec
1.123.36(4.01)(17.5)(39.4)(21)(21)(7.81)45(6.40)1,045805240106(20)3BBRMPelayaranNasionalBinaBuanaRayaTbk.Jun-20Dec
2.751.146.6914.348.334342.6118191,012539472140356BLTABerlianLajuTankerTbk.Jun-20Dec
0.530.44(2.46)(3.53)(16.3)(95)(94)(74.9)2,123(15)7,6302,3175,3131,151(122)5BIRDBlueBirdTbk.[S]Jun-20Dec
0.851.238.9520.064.546045276.23824.2510,0905,5674,5241,4014618BULLBuanaLintasLautanTbk.[S]Jun-20Dec
0.551.340.912.125.792.352.353.0314326518297221814.387BPTRBataviaProsperindoTransTbk.Jun-20Dec
9.7311.9(6.03)(77.9)(2.35)(157)(157)(14.7)19(12)2,6132,4112026,709(62)10CMPPAirAsiaIndonesiaTbk.[S]Dec-19Dec
(0.455)(3.59)(7.87)N/A(257.0)(35)(35)(55.6)(273)(2.23)589816(227)18(38)9CANICapitolNusantaraIndonesiaTbk.[S]Mar-20Jun
(5.47)(128.4)(13.9)N/A(155.4)(10,344)(10,193)(787.5)(45)(0.310)147,124148,279(1,155)13,119(12,535)12GIAAGarudaIndonesia(Persero)Tbk.Jun-20Dec
0.791.17(3.29)(7.13)(19.5)(2.21)(2.21)(7.79)109(11)26814412445(2.03)11DEALDewataFreightinternationalTbk.[S]Mar-20Dec
3.561.808.1322.838.013411733.0145162,8811,8531,02861614514HITSHumpussIntermodaTransportasiTbk.Jun-20Dec
1.300.520.280.433.080.270.270.6615430419166126180.6513HELIJayaTrishindoTbk.[S]Jun-20Dec
0.980.257.659.5532.0545420.5214101,4142811,1333387116IPCMJasaArmadaIndonesiaTbk.[S]Jun-20Dec
1.080.94(6.32)(12.2)(85.9)(30)(30)(5.66)46(8.83)95946449471(35)15IATAIndonesiaTransport&InfrastructureTbk.[S]Jun-20Dec
8.340.071.882.0044.70.330.332.64132416704.44662.960.3318KJENKridaJaringanNusantaraTbk.[S]Mar-20Dec
0.450.362.823.857.661.261.266.7117412892465331.3917JAYAArmadaBerjayaTransTbk.[S]Jun-20Dec
0.200.21(15.2)(18.4)(218.6)(11)(11)(131.0)713(1.11)3015225021(5.49)20LRNAEkaSariLorenaTransportTbk.[S]Mar-20Dec
0.362.70(1.65)(6.10)(18.1)(17)(17)(8.48)139(5.90)2,0831,520563190(15)19LEADLogindoSamudramakmurTbk.Jun-20Dec
0.900.49(7.55)(11.2)(60.7)(13)(12)(6.28)56(7.97)32910822141(13)22MIRAMitraInternationalResourcesTbk.[S]Jun-20Dec
0.260.27(3.91)(4.95)(51.3)(36)(34)(78.5)1,587(5.30)3,5147382,777268(36)21MBSSMitrabahteraSegaraSejatiTbk.[S]Mar-20Dec
1.431.20(2.49)(5.46)(8.30)(45)(27)(19.1)350(26)2,1621,177985647(25)24PORTNusantaraPelabuhanHandalTbk.[S]Jun-20Dec
0.610.186.437.5930.8181815.22018.08556854721161923NELYPelayaranNellyDwiPutriTbk.[S]Jun-20Dec](https://image.slidesharecdn.com/7idxmonthlystatisticsjuli2020-201227101938/85/7-idx-monthly-statistics-juli-2020-57-320.jpg)
![54
DATA SERVICES | INDONESIA STOCK EXCHANGE
IDX MONTHLY STATISTICS, JULY 2020
Liabi-
lities
Annual
Profit
for
the
period
Profit
attr.
to
owner's
entity
FinancialData&Ratios
billionIDR
P/E
Ratio,
x
Price
toBV,
x
D/E
Ratio,
x
ROA,
%
ROE,
%
NPM,
%ListedStocks
FS
Date
Fiscal
Year
EndEBT
EPS,
IDR
Book
Value,
IDRSalesAssetsEquity
PPGL
PSSI
PTIS
PURA
RIGS
SAFE
SAPX
SDMU
SHIP
SMDR
SOCI
TAMU
TAXI
TCPI
TMAS
TNCA
TPMA
TRUK
WEHA
WINS
NONBUILDINGCONSTRUCTION
BALI
BUKK
CENT
GHON
GOLD
IBST
LCKM
MTPS
OASA
PPRE
PTPW
SUPR
TBIG
TOWR
FINANCE
BANK
AGRO
AGRS
AMAR
ARTO
BABP
BACA
BBCA
BBHI
BBKP
BBMD
BBNI
BBRI
1.363.78
PTPWPratamaWidyaTbk.[S]Jun-20Dec469883811032222229.4211.643.0
0.720.593.175.0612.7323211.9235142,0257541,2725083626PSSIPelitaSamuderaShippingTbk.[S]Jun-20Dec
2.210.622.313.752.463.532.493.32895910841661015.6625PPGLPrimaGlobalindoLogistikTbk.Dec-19Dec
1.860.113.533.9239.73.633.632.74704741241370374.7828PURAPutraRajawaliKencanaTbk.[S]Mar-20Dec
0.381.130.110.240.660.290.291.05433156506268238870.4127PTISIndoStraitsTbk.Jun-20Dec
(2.37)(8.02)1.65N/A12.31.451.459.41(81)21352402(50)471.4530SAFESteadySafeTbk.Mar-20Dec
0.190.1933.139.569.6291291477.71,2100.4787814173741841829RIGSRigTendersIndonesiaTbk.[S]Mar-20Mar
3.079.15(34.4)(348.8)(150.9)(33)(32)(56.7)16(0.881)18716918430.0032SDMUSidomulyoSelarasTbk.[S]Jun-20Dec
15.10.6117.728.416.2181842.514953200751252182331SAPXSatriaAntaranPrimaTbk.[S]Jun-20Dec
0.231.101.893.963.981107043.01,0875.917,4663,9063,5603,54212934SMDRSamuderaIndonesiaTbk.[S]Jun-20Dec
0.890.916.7512.941.315811685.26626.923,4361,6361,80056119133SHIPSilloMaritimePerdanaTbk.Jun-20Dec
3.571.08(1.52)(3.17)(16.5)(11)(9.15)(0.488)15(113)1,200623577111(11)36TAMUPelayaranTamarinSamudraTbk.[S]Jun-20Dec
0.181.030.601.215.9629298.27684159,7914,9634,8289795735SOCISoechiLinesTbk.Jun-20Dec
13.41.012.154.327.62253112.62913112,9311,4741,4578273738TCPITranscoalPacificTbk.[S]Jun-20Dec
(0.617)(1.73)(24.0)N/A(447.6)(44)(43)(14.1)(81)(3.54)362859(498)19(49)37TAXIExpressTransindoUtamaTbk.Jun-20Dec
0.780.382.934.0314.7
0.24
41TPMATransPowerMarineTbk.[S]Jun-20Dec1,5914371,15431727232317.743819
403.33101612.02
0.521.822.346.596.12424014.12147.893,4342,2151,2181,3126639TMASTemasTbk.[S]Jun-20Dec
TNCATrimudaNuansaCitraTbk.[S]Mar-20Dec531043200.470.350.352.673.307.12
0.520.84(19.5)(36.0)(128.6)(23)(23)(52.2)145(1.46)23710812936(30)43WEHAWEHATransportasiIndonesiaTbk.[S]Jun-20Dec
0.760.34(14.7)(19.7)(71.8)(6.53)(6.53)(30.0)152(3.83)89236618(6.26)42TRUKGunaTimurRayaTbk.[S]Jun-20Dec
2.191.1654.88634975
0.190.58(3.34)(5.27)(36.2)(65)(57)(26.8)508(3.70)3,4051,2482,157314(61)44WINSWintermarOffshoreMarineTbk.[S]Jun-20Dec
0.690.809.5517.221.8230229173.81,0124.034,8082,1372,6712,1062512BUKKBukakaTeknikUtamaTbk.[S]Jun-20Dec
1.721.171.413.0616.8313115.9519564,4182,3782,040372441BALIBaliTowerindoSentraTbk.[S]Jun-20Dec
1.240.248.4810.5107.53636131.31,2521285216368967414GHONGihonTelekomunikasiIndonesiaTbk.[S]Jun-20Dec
1.211.190.771.7021.812121.5591716,2333,3892,843221143CENTCentratamaTelekomunikasiIndonesiaTbk.[S]Mar-20Dec
1.810.491.001.4915.5454567.34,5221229,0912,9836,109585556IBSTIntiBangunSejahteraTbk.[S]Jun-20Dec
0.780.113.934.3572.07.067.0611.12541835935325207.135GOLDVisiTelekomunikasiInfrastrukturTbk.[S]Jun-20Dec
0.790.340.771.028.151.901.901.8217877495125370472.418MTPSMetaEpsiTbk.[S]Jun-20Dec
2.850.112.642.9441.40.960.963.8413197146151319.270.967LCKMLCKGlobalKedatonTbk.[S]Mar-20Dec
1.642.851.907.3025.0118118206.72,8322212,3899,1673,22293911912SUPRSolusiTunasPratamaTbk.Jun-20Dec
1.58
1150.3434323.650.23
103.69271470.64
2.660.013.323.36145.80.790.794.4313279480.64471.090.969OASAProtechMitraPerkasaTbk.[S]Jun-20Dec
PPREPPPresisiTbk.[S]Jun-20Dec7,1464,3732,7739976435190.53
6.252.687.6328.170.61,3161,30151.01822234,08824,8269,2623,6851,54514TOWRSaranaMenaraNusantaraTbk.Jun-20Dec
4.684.453.0016.439.653851045.12762934,04127,7986,2432,57769313TBIGTowerBersamaInfrastructureTbk.Jun-20Dec
2.135.43108.71,1093481
2.143.5491.11,120268.
1.535.11(1.33)(8.13)(23.1)(46)(46)(8.25)101(19)6,9895,8451,143402(46)2AGRSBankIBKIndonesiaTbk.Jun-20Dec
1.185.260.150.963.9720201.8719612426,18422,0004,1841,008311AGROBankRakyatIndonesiaAgroniagaTbk.Jun-20Dec
23.90.34(5.97)(8.01)(246.8)(51)(51)(9.38)117(299)1,7074351,27241(51)4ARTOBankJagoTbk.Jun-20Dec
2.721.851.313.749.6720205.14137733,1182,0241,094423203AMARBankAmarIndonesiaTbk.Jun-20Dec
1.879.980.596.527.81525214.72252917,50515,9111,5941,331676BACABankCapitalIndonesiaTbk.Jun-20Dec
0.835.690.100.671.965.135.130.406012310,1958,6711,5245236.645BABPBankMNCInternasionalTbk.Jun-20Dec
1.645.622.9819.872.9333315.7798.282,2041,87133390348BBHIBankHardaInternasionalTbk.Jun-20Dec
4.544.732.5114.569.312,24412,240992.96,86631975,076800,861169,27435,31514,9907BBCABankCentralAsiaTbk.Jun-20Dec
1.792.901.234.8128.7808039.18133712,9929,6653,32755710310BBMDBankMestikaDharmaTbk.Jun-20Dec
0.258.210.121.142.7354548.157132287,21177,7399,4733,969649BBKPBankBukopinTbk.Jun-20Dec
2.176.442.4018.279.98,1708,163264.71,456121,358,9791,156,571179,63940,86110,15612BBRIBankRakyatIndonesia(Persero)Tbk.Mar-20Dec
0.786.611.9615.589.64,2204,253912.25,8905.04868,448725,819109,84118,9935,33511BBNIBankNegaraIndonesia(Persero)Tbk.Mar-20Dec](https://image.slidesharecdn.com/7idxmonthlystatisticsjuli2020-201227101938/85/7-idx-monthly-statistics-juli-2020-58-320.jpg)
![55IDX MONTHLY STATISTICS, JULY 2020
DATA SERVICES | INDONESIA STOCK EXCHANGE
Liabi-
lities
Annual
Profit
for
the
period
Profit
attr.
to
owner's
entity
FinancialData&Ratios
billionIDR
P/E
Ratio,
x
Price
toBV,
x
D/E
Ratio,
x
ROA,
%
ROE,
%
NPM,
%ListedStocks
FS
Date
Fiscal
Year
EndEBT
EPS,
IDR
Book
Value,
IDRSalesAssetsEquity
BBTN
BBYB
BCIC
BDMN
BEKS
BGTG
BINA
BJBR
BJTM
BKSW
BMAS
BMRI
BNBA
BNGA
BNII
BNLI
BRIS
BSIM
BSWD
BTPN
BTPS
BVIC
DNAR
INPC
MAYA
MCOR
MEGA
NISP
NOBU
PNBN
PNBS
SDRA
FINANCIALINSTITUTION
ADMF
BBLD
BFIN
BPFI
CFIN
DEFI
FINN
FUJI
HDFA
IBFN
IMJS
MFIN
POLA
TIFA
TRUS
VRNA
NISPBankOCBCNISPTbk.Jun-20Dec182,161153,14329,0187,2202,1041,5631,5631.7210.843.3
POLAPoolAdvistaFinanceTbk.Jun-20Dec3449.5633511(2.92)(2.92)(2.92)(1.70)(1.74)(52.4)
2.063.110.973.9716.019195.80146523,9983,0259722412014BBYBBankYudhaBhaktiTbk.Jun-20Dec
0.7816.40.498.9713.1768768145.01,6168.73314,603280,61617,11611,72796313BBTNBankTabunganNegara(Persero)Tbk.Jun-20Dec
0.623.510.873.9214.7892845172.94,41516194,441151,29443,14711,4841,34316BDMNBankDanamonIndonesiaTbk.Jun-20Dec
4.409.25(1.37)(14.0)(42.1)(317)(317)(22.3)159(31)16,32714,7341,593531(317)15BCICBankJTrustIndonesiaTbk.Jun-20Dec
0.492.940.592.3113.113132.36102214,4963,3551,1412001618BGTGBankGaneshaTbk.Jun-20Dec
6.1914.7(1.57)(24.6)(105.7)(32)(32)(1.99)8.07(25)8,1087,591518121(42)17BEKSBPDBantenTbk.Mar-20Dec
0.8610.21.2915.125.3808807164.11,0875.70125,320109,50110,6956,37199820BJBRBPDJawaBaratdanBantenTbk.Jun-20Dec
4.303.410.100.462.572.672.670.942059335,1023,9441,1582083.6319BINABankInaPerdanaTbk.Jun-20Dec
0.445.02(5.03)(30.3)(153.6)(538)(538)(52.6)174(1.46)21,39417,8413,553700(512)22BKSWBankQNBIndonesiaTbk.Jun-20Dec
0.907.032.0516.852.5770770102.66115.3675,24064,4339,1712,93498121BJTMBPDJawaTimurTbk.Jun-20Dec
1.535.982.4017.899.78,0747,916678.53,8028.551,320,0381,060,234177,44231,75710,41724BMRIBankMandiri(Persero)Tbk.Mar-20Dec
0.934.990.804.8020.2303013.6283197,5246,2681,2562994023BMASBankMaspionIndonesiaTbk.Jun-20Dec
0.495.911.278.7930.51,7441,745138.91,5805.55274,419234,69939,72011,4412,27026BNGABankCIMBNiagaTbk.Jun-20Dec
0.474.100.643.2815.1252521.4652147,6866,1811,5063283225BNBABankBumiArtaTbk.Jun-20Dec
1.536.200.000.030.151.741.740.258295,129167,394144,14823,2474,62728128BNLIBankPermataTbk.Mar-20Dec
0.575.250.996.1723.082881021.33459.31164,121137,87226,2507,0471,06527BNIIBankMaybankIndonesiaTbk.Jun-20Dec
1.625.430.332.3513.833337.483186939,38330,1155,5439454330BSIMBankSinarmasTbk.Mar-20Dec
1.022.540.715.8229.4757530.95321742,22913,1175,1661,02210929BRISBankBRIsyariahTbk.[S]Mar-20Dec
0.584.551.216.9824.51,2391,117274.13,9288.35185,191145,52932,0039,1051,62032BTPNBankBTPNTbk.Jun-20Dec
2.162.350.371.2410.56.996.9910.18111743,7662,6411,1261339.3231BSWDBankofIndiaIndonesiaTbk.Jun-20Dec
0.197.400.060.581.678.048.041.803093324,74420,4572,7669647.9434BVICBankVictoriaInternationalTbk.Jun-20Dec
4.890.405.3315.048.7407407105.67063315,2722,1745,4401,67254733BTPSBankBTPNSyariahTbk.[S]Jun-20Dec
0.246.610.151.154.4819192.382082124,96721,6883,2798402236INPCBankArthaGrahaInternasionalTbk.Jun-20Dec
1.061.500.390.979.189.719.712.192271105,0213,0102,0112119.7135DNARBankOkeIndonesiaTbk.Jun-20Dec
1.865.830.332.249.5331311.65748319,08116,2872,7946584038MCORBankChinaConstructionBankIndonesiaTbk.Jun-20Dec
2.894.770.321.8711.314414442.02,25215588,72273,33415,3882,55217937MAYABankMayapadaInternasionalTbk.Jun-20Dec
2.207.620.524.4615.3
5.28
41NOBUBankNationalnobuTbk.Jun-20Dec12,67611,2061,47042942333314.833149
40136.21,2655.140.55
3.055.482.3815.449.71,1821,182339.52,1982099,23683,93015,3064,7531,46039MEGABankMegaTbk.Jun-20Dec
0.710.330.030.193.741.571.570.137138110,6025541,696842.1043PNBSBankPaninDubaiSyariahTbk.[S]Jun-20Dec
0.443.831.235.9431.31,3491,300108.01,8197.46211,289167,50043,7898,3101,72742PNBNBankPanIndonesiaTbk.Jun-20Dec
1.752.4077.78004.3582
0.724.181.397.1841.325025076.01,0609.9936,11929,1456,9741,21133344SDRABankWooriSaudaraIndonesia1906Tbk.Jun-20Dec
0.522.970.562.217.45131316.2733244,7873,5801,207358172BBLDBuanaFinanceTbk.Jun-20Dec
1.053.253.7415.925.95975971,194.17,5216.6231,96024,4397,5214,6168271ADMFAdiraDinamikaMultiFinanceTbk.Jun-20Dec
2.720.922.775.3431.4222225.1470511,614775838143294BPFIBataviaProsperindoFinanceTbk.Jun-20Dec
0.751.813.8410.830.933233241.63856.9717,28511,1346,1512,1514243BFINBFIFinanceIndonesiaTbk.Jun-20Dec
12.70.011.031.0442.10.500.501.461401,223970.60962.390.526DEFIDanasupraErapacificTbk.Jun-20Dec
0.161.331.844.2824.010310351.61,2043.7011,1556,3594,7968551305CFINClipanFinanceIndonesiaTbk.Jun-20Dec
0.830.004.644.65136.03.233.235.85126181390.341394.753.478FUJIFujiFinanceIndonesiaTbk.Jun-20Dec
1.577.14(49.5)(403.0)(277.5)(239)(239)(128.7)32(0.388)4844245986(240)7FINNFirstIndoAmericanLeasingTbk.Dec-19Dec
1.904.81(3.35)(19.5)(1,355.4)(24)(24)(32.2)165(9.75)1,4591,2082513.60(32)10IBFNIntanBarupranaFinanceTbk.Jun-20Dec
1.700.72(8.22)(14.2)(196.7)(39)(39)(12.8)91(12)95240055240(46)9HDFARadanaBhaskaraFinanceTbk.Jun-20Dec
1.130.955.3710.430.512312392.6887114,5732,2242,34980415712MFINMandalaMultifinanceTbk.Jun-20Dec
0.446.91(0.103)(0.818)(1.23)(31)(13)(4.55)556(54)25,36922,1633,2062,138(23)11IMJSIndomobilMultiJasaTbk.Jun-20Dec
0.940.103.784.1749.36.066.0615.13632232030290259.4515TRUSTrustFinanceIndonesiaTbk.Jun-20Dec
1.141.822.567.2134.1
0.03
14TIFATifaFinanceTbk.Jun-20Dec1,0857013858115141425.735616
13(2.14)123(24)0.42
1.073.41(0.084)(0.372)(1.80)(1.17)(1.17)(0.410)110(288)2,7632,137626130(4.59)16VRNAVerenaMultiFinanceTbk.Jun-20Dec](https://image.slidesharecdn.com/7idxmonthlystatisticsjuli2020-201227101938/85/7-idx-monthly-statistics-juli-2020-59-320.jpg)
![56
DATA SERVICES | INDONESIA STOCK EXCHANGE
IDX MONTHLY STATISTICS, JULY 2020
Liabi-
lities
Annual
Profit
for
the
period
Profit
attr.
to
owner's
entity
FinancialData&Ratios
billionIDR
P/E
Ratio,
x
Price
toBV,
x
D/E
Ratio,
x
ROA,
%
ROE,
%
NPM,
%ListedStocks
FS
Date
Fiscal
Year
EndEBT
EPS,
IDR
Book
Value,
IDRSalesAssetsEquity
WOMF
SECURITIESCOMPANY
AMOR
PADI
PANS
RELI
TRIM
YULE
INSURANCE
ABDA
AHAP
AMAG
ASBI
ASDM
ASJT
ASMI
ASRM
BHAT
JMAS
LIFE
LPGI
MREI
MTWI
PNIN
TUGU
VINS
OTHERS
APIC
BCAP
CASA
GSMF
LPPS
PNLF
SMMA
VICO
TRADE,SERVICES&INVESTMENT
WHOLESALE(DURABLE&NON-DURABLEGOODS)
AGAR
AIMS
AKRA
AYLS
BLUE
BMSR
BOGA
CARS
CLPI
CNKO
(3.36)(10.7)
LPPSLippoSecuritiesTbk.Jun-20Dec1,0445.161,038(7.33)(18)(18)(18)(3.51)(3.52)N/A
0.624.651.699.5712.1575732.93446.446,7625,5661,1969447317WOMFWahanaOttomitraMultiarthaTbk.Jun-20Dec
7.940.2227.533.641.2696983.42482433762276225901AMORAshmoreAssetManagementIndonesiaTbk.Mar-20Dec
2.240.51(46.8)4072283
1.000.2416.820.91,374.2535358.82814.766301245067.71534RELIRelianceSekuritasIndonesiaTbk.Jun-20Dec
0.500.68(12.5)(21.0)N/A
0.10
3PANSPaninSekuritasTbk.Jun-20Dec1,9417861,155(3.84)(110)(124)(121)(337.0)1,604(2.39)
2(14.9)25(3.36)1.99PADIMinnaPadiInvestamaSekuritasTbk.Jun-20Dec31127284(77)(84)(84)(84)(54.1)(59.3)N/A
1.060.01(44.0)(44.5)N/A(65)(65)(72.3)163(2.38)2933.01290(62)(65)6YULEYulieSekuritasIndonesiaTbk.Jun-20Dec
0.951.820.300.863.813.683.671.031211112,4251,566859193155TRIMTrimegahSekuritasIndonesiaTbk.Jun-20Dec
3.350.973.977.8224.95151163.92,096432,5621,2611,301409541ABDAAsuransiBinaDanaArtaTbk.Jun-20Dec
2.481.54133.71,8572684
0.631.491.603.976.34393915.8397164,9362,9511,9841,244433AMAGAsuransiMultiArthaGunaTbk.Jun-20Dec
0.993.132.199.075.727.167.164.8754116534951582517.162AHAPAsuransiHartaAmanPratamaTbk.Jun-20Dec
0.553.120.943.871.926.296.2965.51,695141,3421,0163256557.975ASDMAsuransiDayinMitraTbk.Jun-20Dec
0.352.010.912.732.984.044.0423.2848138895932962713.584ASBIAsuransiBintangTbk.Jun-20Dec
23.11.44(13.7)(33.5)(50.0)(76)(76)(17.0)51(69)1,108652454304(80)7ASMIAsuransiKresnaMitraTbk.Jun-20Dec
0.330.920.310.601.210.630.632.11351554051942101050.816ASJTAsuransiJasaTaniaTbk.Jun-20Dec
4.350.19(0.124)(0.147)(1.90)(0.419)(0.380)(0.152)103(2,958)6149751740(0.419)9BHATBhaktiMultiArthaTbk.Jun-20Dec
0.962.704.7917.79.164343368.82,0835.401,8021,315488942498ASRMAsuransiRamayanaTbk.Jun-20Dec
1.680.942.334.5628.6173173164.93,6213714,8367,1777,6031,21020711LIFEAsuransiJiwaSinarmasMSIGTbk.Jun-20Dec
1.890.911.573.0819.91.781.783.5511561226106115181.7810JMASAsuransiJiwaSyariahJasaMitraAbadiTbk.[S]Jun-19Dec
0.602.540.120.420.30
1.55
14MTWIMalaccaTrustWuwunganInsuranceTbk.Jun-20Dec4633321311840.280.280.280.3686140
13150.53,076271.33
0.692.106.1619.118.178781,045.85,4733.632,5471,7268218678912LPGILippoGeneralInsuranceTbk.Jun-20Dec
MREIMaskapaiReasuransiIndonesiaTbk.Jun-20Dec4,1052,4671,5931,2214239391.904.896.38
0.591.580.912.364.729897108.64,6122521,17212,9738,1994,09515816TUGUAsuransiTuguPratamaIndonesiaTbk.Jun-20Dec
0.110.142.212.5343.3732349171.56,7874.2631,6063,94427,6121,61213515PNINPaninvestTbk.Jun-20Dec
2.192.2341.68673289
0.740.400.170.241.240.220.220.3113031326575190360.2217VINSVictoriaInsuranceTbk.Jun-20Dec
1.102.250.080.251.118.726.720.3413543817,43112,0615,3701,208(2.16)2BCAPMNCKapitalIndonesiaTbk.Jun-20Dec
5.091.354.129.6914.6969415.9164524,5462,6141,9311,2811021APICPacificStrategicFinancialTbk.Jun-20Dec
2.28
6(14.1)401(5.31)0.190.00
5(6.82)203(16)0.54
2.772.750.351.402.5790541.9714119830,56421,0597,6634,1761054CASACapitalFinancialIndonesiaTbk.Jun-20Dec
4.470.933.276.3117.85040141.12,238712,4241,1661,258447693BPIIBataviaProsperindoInternasionalTbk.Jun-20Dec
GSMFEquityDevelopmentInvestmentTbk.Jun-20Dec4,9573,4451,513477(14)(25)(25)(1.03)
5.123.621.205.55904.1611593186.33,3579298,71177,33621,3751316268SMMASinarMasMultiarthaTbk.Jun-20Dec
0.230.155.356.1773.788179749.88063.7229,8083,97225,8222,1648827PNLFPaninFinancialTbk.Jun-20Dec
1.690.372.421,8924.049.
0.206.75(0.019)(0.145)(1.19)1.78(2.39)(0.522)360(140)25,51622,2233,2934011.729VICOVictoriaInvestamaTbk.Jun-20Dec
4.500.711.953.342.611.851.853.69111135189791111412.511AGARAsiaSejahteraMinaTbk.[S]Jun-20Dec
1.021.2983.38609.1791
1.130.814.658.438.63452432215.02,5491318,5548,31810,23510,0015653AKRAAKRCorporindoTbk.[S]Jun-20Dec
2.960.43(2.81)(4.01)(34.9)(0.268)(0.268)(2.44)61(74)195.71131.53(0.253)2AIMSAkbarIndoMakmurStimecTbk.Jun-20Dec
1.370.910.781.491.180.460.460.543792592831390.645AYLSAgroYasaLestariTbk.[S]Dec-19Dec
0.790.605.669.0923.0141426.62938.71506191315125184APIIAritaPrimaIndonesiaTbk.[S]Jun-20Dec
0.422.92(3.89)(15.2)(1.87)(11)(11)(19.4)127(2.74)5774301471,202(14)7BMSRBintangMitraSemestarayaTbk.[S]Jun-20Dec
2.610.1033.036.2111.67.467.4671.41977.21908.0082277.466BLUEBerkahPrimaPerkasaTbk.[S]Mar-20Dec
0.433.09(1.56)(6.39)(4.93)(57)(55)(7.38)116(6.77)7,0855,3511,7342,248(56)9CARSIndustridanPerdaganganBintracoDharmaTbk.Jun-20Dec
12.40.380.781.081.842.322.321.221131,1505921624302523.358BOGABintangOtoGlobalTbk.[S]Jun-20Dec
(0.727)(3.67)(24.7)N/A(251.6)(103)(102)(45.4)(69)(1.10)1,6442,260(616)162(103)11CNKOExploitasiEnergiIndonesiaTbk.Mar-20Dec
0.450.484.025.947.15141494.11,5847.547182324854032110CLPIColorpakIndonesiaTbk.[S]Jun-20Dec](https://image.slidesharecdn.com/7idxmonthlystatisticsjuli2020-201227101938/85/7-idx-monthly-statistics-juli-2020-60-320.jpg)
![57IDX MONTHLY STATISTICS, JULY 2020
DATA SERVICES | INDONESIA STOCK EXCHANGE
Liabi-
lities
Annual
Profit
for
the
period
Profit
attr.
to
owner's
entity
FinancialData&Ratios
billionIDR
P/E
Ratio,
x
Price
toBV,
x
D/E
Ratio,
x
ROA,
%
ROE,
%
NPM,
%ListedStocks
FS
Date
Fiscal
Year
EndEBT
EPS,
IDR
Book
Value,
IDRSalesAssetsEquity
DPUM
DWGL
EPMT
FISH
GREN
HADE
HDIT
HEXA
HKMU
INPS
INTA
INTD
IRRA
KAYU
KOBX
KONI
LTLS
MDRN
MICE
MPMX
OKAS
OPMS
PMJS
SDPC
SPTO
SQMI
SUGI
TFAS
TGKA
TIRA
TRIL
TURI
UNTR
WAPO
WICO
ZBRA
RETAILTRADE
ACES
AMRT
CSAP
DAYA
DIVA
ECII
ERAA
GLOB
HERO
KIOS
KOIN
LPPF
TURITunasRideanTbk.[S]Jun-20Dec5,7491,6884,0614,4571411071073.725.264.80
(39.3)(16.6)7.99N/A8.3531317.19(5.76)31784834(50)7503913DWGLDwiGunaLaksanaTbk.[S]Jun-20Dec
0.270.71(6.54)(11.2)(614.6)(29)(29)(28.0)250(2.39)1,7887441,04419(38)12DPUMDuaPutraUtamaMakmurTbk.[S]Mar-20Dec
0.802.093.7011.43.0398100415.33,6326.965,3953,6521,7436,57514415FISHFKSMultiAgroTbk.[S]Jun-20Dec
0.790.347.7110.45.60322322237.82,2977.598,3542,1326,22211,50242514EPMTEnsevalPuteraMegatradingTbk.[S]Jun-20Dec
7.120.15(7.38)(8.50)(68.5)(0.751)(0.632)(0.597)7.02(84)172.25151.85(0.746)17HADEHimalayaEnergiPerkasaTbk.[S]Jun-20Dec
3.300.050.150.160.690.550.550.16992,101488224671061016GRENEvergreenInvescoTbk.Sep-16Dec
1.060.3612.416.978.0112112534.33,1706.313,6169532,66357514419HEXAHexindoAdiperkasaTbk.[S]Jun-20Mar
2.110.142.352.680.364.854.846.3523779412513612,6784.8918HDITHenselDavestIndonesiaTbk.[S]Jun-20Dec
8.682.54(3.42)(12.1)(12.9)(7.97)(8.04)(24.7)205(72)470337133125(7.97)21INPSIndahPrakasaSentosaTbk.[S]Jun-20Dec
0.381.52(2.76)(6.97)(10.5)(24)(24)(15.0)215(5.40)1,7511,057694461(23)20HKMUHKMetalsUtamaTbk.[S]Jun-20Dec
2.080.25(7.70)(9.62)(16.1)(1.92)(1.92)(6.48)67(22)509.944024(1.95)23INTDInterDeltaTbk.[S]Jun-20Dec
(2.89)(12.3)(4.95)N/A(47.8)(104)(97)(57.9)(104)(5.18)3,9124,259(347)405(112)22INTAIntracoPentaTbk.Jun-20Dec
0.440.51(1.07)(1.62)(4.29)(0.629)(0.629)(1.89)116(27)117407729(0.844)25KAYUDarmiBersaudaraTbk.[S]Jun-20Dec
5.100.607.1611.424.49.699.6912.110645271101169791124IRRAItamaRanorayaTbk.[S]Jun-20Dec
34.951.6(51.6)(2,716.4)(194.5)(14)(14)(376.5)14(1.29)1111092.1129(14)27KONIPerdanaBangunPusakaTbk.Mar-20Dec
0.523.31(6.71)(29.0)(34.9)(58)(58)(50.9)176(1.79)1,7241,324400332(53)26KOBXKobexindoTractorsTbk.[S]Jun-20Dec
(1.08)(2.71)(7.59)N/A(98.7)(23)(23)(6.01)(46)(8.33)604957(353)46(23)29MDRNModernInternasionalTbk.Jun-20Dec
0.321.790.210.590.44326.408.201,383546,0303,8722,1582,8815328LTLSLautanLuasTbk.[S]Jun-20Dec
0.340.37(2.06)(2.82)(3.25)(74)(90)(40.3)1,429(12)8,7142,3376,3775,526(36)31MPMXMitraPinasthikaMustikaTbk.[S]Jun-20Dec
0.270.510.831.262.511.504.2414.11,126211,0223466763374.3330MICEMultiIndocitraTbk.[S]Jun-20Dec
1.150.023.093.1447.40.870.873.48111371131.761117.340.9733OPMSOptimaPrimaMetalSinergiTbk.[S]Mar-20Dec
0.5911.07.8093.449.08857129.61390.632,9342,68924546811832OKASAncoraIndonesiaResourcesTbk.Mar-20Dec
0.634.060.633.190.573.853.856.05190201,2239812421,3505.4235SDPCMillenniumPharmaconInternationalTbk.Jun-20Dec
0.780.322.262.992.2342344.93165262,9937262,2673,0365834PMJSPutraMandiriJembarTbk.[S]Jun-20Dec
(18.1)(3.39)(9.33)N/A(1,502.5)(19)(19)(2.42)(11)(81)402571(169)2.50(19)37SQMIWiltonMakmurIndonesiaTbk.Jun-20Mar
0.730.815.219.4630.3444160.86437.703,1501,4141,7365425536SPTOSuryaPertiwiTbk.[S]Mar-20Dec
1.760.356.618.914.657.027.088.509520214551593058.9939TFASTelefastIndonesiaTbk.[S]Jun-20Dec
0.542.13(0.379)(1.19)(221.1)(20)(20)(1.10)93(45)7,2014,9032,29712(23)38SUGISugihEnergyTbk.Sep-18Dec
0.951.040.370.750.451.251.252.132831273401731672813.0841TIRATiraAusteniteTbk.[S]Dec-19Dec
4.431.4113.231.814.2120120521.91,644143,6432,1331,5103,38315340TGKATigaraksaSatriaTbk.[S]Mar-20Dec
1.290.697.7913.224.5
0.42
44UNTRUnitedTractorsTbk.[S]Jun-20Dec104,22142,63861,58333,1924,9954,0954,0612,177.416,5109.81
4338.3728371.92
0.490.04(1.99)(2.06)(966.6)(2.53)(2.53)(2.11)102(24)1274.671230.26(2.53)42TRILTriwiraInsanlestariTbk.[S]Dec-19Dec
2.931.431.192.880.463.623.625.711981026103592511,5883.6246WICOWicaksanaOverseasInternationalTbk.[S]Jun-20Dec
1.030.08(2.77)(3.00)(1.81)(1.15)(1.15)(1.86)62(34)836.1677128(1.15)45WAPOWahanaPronaturalTbk.[S]Jun-20Dec
1.952.06(19.1)5739.8393
(4.70)(1.75)(1.33)N/A(2.71)(0.023)(0.023)(0.106)(11)(472)6.8416(9.11)3.34(0.059)47ZBRAZebraNusantaraTbk.[S]Mar-20Dec
4.502.424.2214.42.5950849323.81653123,37916,5456,83438,0856112AMRTSumberAlfariaTrijayaTbk.Jun-20Dec
6.010.4210.214.419.735436042.0291427,0952,0994,9963,6524321ACESAceHardwareIndonesiaTbk.[S]Jun-20Dec
10.24.09(9.92)(50.5)(14.9)(34)(34)(28.3)56(20)690554135459(30)4DAYADutaIntidayaTbk.[S]Jun-20Dec
0.732.340.943.131.14363114.1450236,7104,7022,0085,527493CSAPCaturSentosaAdipranaTbk.[S]Jun-20Dec
0.730.28(3.48)(4.44)(8.26)(29)(29)(42.8)963(16)1,6403541,285691(29)6ECIIElectronicCityIndonesiaTbk.[S]Jun-20Dec
1.730.293.164.071.90161747.41,165431,0702388321,781195DIVADistribusiVoucherNusantaraTbk.[S]Jun-20Dec
(0.189)(1.01)(479.9)N/A(16.6)(40)(40)(35.8)(670)(3.55)8.28753(745)239(37)8GLOBGlobalTeleshopTbk.Dec-19Dec
0.910.762.504.401.5712411371.11,616219,0633,9085,15514,4631897ERAAErajayaSwasembadaTbk.[S]Jun-20Dec
1.341.61(8.43)(22.0)(2.44)(10)(10)(28.9)131(6.07)24515194848(14)10KIOSKiosonKomersialIndonesiaTbk.[S]Jun-20Dec
1.100.93(6.31)(12.2)(8.16)(202)(202)(96.6)793(9.06)6,4013,0843,3174,956(229)9HEROHeroSupermarketTbk.[S]Jun-20Dec
3.487.25(8.25)(68.0)(31.8)(358)(358)(255.2)375(5.11)8,6817,6291,0522,253(355)12LPPFMatahariDepartmentStoreTbk.[S]Jun-20Dec
1.134.210.211.110.180.480.480.9888102451364875321.5911KOINKokohIntiArebamaTbk.[S]Jun-20Dec](https://image.slidesharecdn.com/7idxmonthlystatisticsjuli2020-201227101938/85/7-idx-monthly-statistics-juli-2020-61-320.jpg)
![58
DATA SERVICES | INDONESIA STOCK EXCHANGE
IDX MONTHLY STATISTICS, JULY 2020
Liabi-
lities
Annual
Profit
for
the
period
Profit
attr.
to
owner's
entity
FinancialData&Ratios
billionIDR
P/E
Ratio,
x
Price
toBV,
x
D/E
Ratio,
x
ROA,
%
ROE,
%
NPM,
%ListedStocks
FS
Date
Fiscal
Year
EndEBT
EPS,
IDR
Book
Value,
IDRSalesAssetsEquity
MAPA
MAPI
MCAS
MIDI
MKNT
MPPA
NFCX
RALS
RANC
SKYB
SONA
TELE
TRIO
TOURISM,RESTAURANTANDHOTEL
AKKU
ARTA
BAYU
BUVA
CLAY
CSMI
DFAM
DUCK
EAST
ESTA
FAST
FITT
HOME
HOTL
HRME
ICON
JGLE
JIHD
JSPT
KPIG
MAMI
MAMIP
MAPB
MINA
NASA
NATO
NUSA
PANR
PDES
PGJO
PGLI
PJAA
PNSE
PSKT
RANCSupraBogaLestariTbk.[S]Jun-20Dec1,3017295721,6046653538.0818.46.56
1.721.84(4.35)(12.4)(12.0)(456)(408)(49.1)397(14)18,74612,1526,5956,792(599)14MAPIMitraAdiperkasaTbk.[S]Jun-20Dec
2.160.85(2.79)(5.18)(7.11)(75)(75)(52.8)1,020(42)5,3902,4842,9062,117(108)13MAPAMapAktifAdiperkasaTbk.[S]Jun-20Dec
3.293.423.7016.33.1810310371.6438205,5784,3151,2636,48112616MIDIMidiUtamaIndonesiaTbk.[S]Jun-20Dec
1.320.465.217.621.738553122.71,611172,0456471,3986,1409715MCASMCashIntegrasiTbk.[S]Jun-20Dec
2.6614.0(9.39)(140.8)(11.9)(219)(219)(58.2)41(1.89)4,6724,3603113,673(229)18MPPAMatahariPutraPrimaTbk.[S]Jun-20Dec
1.804.76(1.57)(9.03)(0.588)(5.06)(6.29)(2.52)28(20)8036631392,139(3.46)17MKNTMitraKomunikasiNusantaraTbk.Jun-20Dec
0.960.310.200.260.735.365.361.515883745,4651,2964,1691,4743.8420RALSRamayanaLestariSentosaTbk.[S]Jun-20Dec
1.200.331.451.940.48301030.81,586621,4113541,0574,2373719NFCXNFCIndonesiaTbk.[S]Jun-20Dec
2.590.33(12.6)(16.8)(57.5)(65)(64)(389.1)2,321(15)1,020251769224(83)23SONASonaTopasTourismIndustryTbk.[S]Jun-20Dec
0.990.26(0.094)(0.119)(0.983)
1.27
22SKYBNorthcliffCitranusaIndonesiaTbk.[S]Sep-19Dec387.94303.66(0.543)(0.024)(0.027)(0.061)52(830)
2167.23666.791.25
(3.06)(1.05)(25.3)N/A(5.85)(40)(37)(1.89)(139)(225)1943,820(3,625)840(40)25TRIOTrikomselOkeTbk.Sep-19Dec
0.211.155.5211.92.5538338269.85871.739,2264,9424,28419,94851424TELETiphoneMobileIndonesiaTbk.[S]Sep-19Dec
0.560.62(2.40)(3.89)(1,904.1)(11)(11)(3.47)89(14)9343585761.18(11)1AKKUAnugerahKagumKaryaUtamaTbk.[S]Jun-20Dec
2.420.82(32.1)5,972(8.37)94
0.890.81(1.90)(3.44)(3.45)(7.23)(7.04)(39.9)1,161(26)741331410409(7.23)3BAYUBayuBuanaTbk.[S]Jun-20Dec
0.370.161.591.8546.63.451.7015.28252042960368154.242ARTAArthavestTbk.Mar-20Dec
33.83.02(11.6)(46.6)(224.8)(37)(37)(28.7)62(72)63647815833(48)5CLAYCitraPutraRealtyTbk.Jun-20Dec
0.200.92(3.49)(6.69)(268.1)(65)(64)(18.8)281(2.98)3,6741,7581,91648(65)4BUVABukitUluwatuVillaTbk.[S]Jun-20Dec
7.952.90(7.14)(27.8)(64.0)(12)(12)(12.1)44(29)3222398336(11)7DFAMDafamPropertyIndonesiaTbk.Jun-20Dec
3.332.15(25.3)(79.7)(96.3)(20)(20)(49.7)62(4.18)1601095142(20)6CSMICiptaSeleraMurniTbk.[S]Jun-20Dec
0.950.190.921.1519.80.690.690.67588329844240140.609EASTEastparcHotelTbk.[S]Mar-20Dec
0.510.463.945.7635.1272741.77248.771,359430929153378DUCKJayaBersamaIndoTbk.[S]Jun-20Dec
2.181.150.601.291.435.415.415.434221703,6201,9371,6841,5184.2311FASTFastFoodIndonesiaTbk.[S]Mar-20Dec
1.120.33(0.103)(0.137)(1.90)(0.039)(0.039)(0.124)90(815)7619574.10(0.039)10ESTAEstaMultiUsahaTbk.[S]Jun-20Dec
0.520.16(0.615)(0.713)(205.5)(7.57)(7.57)(0.681)96(73)2,4593362,1237.37(7.72)13HOMEHotelMandarineRegencyTbk.Jun-20Dec
1.230.94(16.5)(32.0)(504.1)(5.21)(5.21)(17.4)54(3.86)6331332.07(5.22)12FITTHotelFitraInternationalTbkJun-20Dec
0.460.34(3.38)(4.52)(123.0)(16)(16)(5.27)117(10)93023569526(21)15HRMEMentengHeritageRealtyTbk.[S]Jun-20Dec
0.512.89(3.03)(11.8)(123.9)(21)(21)(11.7)99(4.29)1,3671,01635133(21)14HOTLSaraswatiGriyaLestariTbk.Jun-20Dec
0.770.50(7.69)(11.5)(355.7)(55)(50)(7.48)65(6.69)1,29443286228(58)17IKAIIntikeramikAlamasriIndustriTbk.[S]Jun-20Dec
0.260.500.771.164.331.851.402.5722123362121241652.2716ICONIslandConceptsIndonesiaTbk.[S]Jun-20Dec
0.240.39(1.88)(2.61)(25.8)(80)(64)(55.0)2,108(9.06)6,8271,9184,909496(65)19JIHDJakartaInternationalHotels&DevelopmentTbk.[S]Jun-20Dec
0.520.57(3.34)(5.25)(61.2)(86)(86)(5.08)97(9.84)3,4341,2482,186188(86)18JGLEGrahaAndrasentraPropertindoTbk.[S]Sep-19Dec
0.370.250.630.7849.370912.252874828,8825,74923,1333687121KPIGMNCLandTbk.[S]Jun-20Dec
0.740.72(3.32)(5.72)(56.5)(149)(89)(77.0)1,346(13)5,3812,2603,122316(133)20JSPTJakartaSetiabudiInternasionalTbk.[S]Jun-20Dec
0.000.250.040.050.646.560.55123.3224,7044.871,6863381,3481167.5323MAMIPMasMurniTbk.(PreferredStock)Sep-19Dec
0.460.250.040.050.646.560.550.061108321,6863381,3481167.5322MAMIMasMurniIndonesiaTbk.Sep-19Dec
2.820.03(5.90)(6.08)(304.9)(3.41)(3.55)(1.08)18(46)1203.691172.33(3.41)25MINASanurhastaMitraTbk.[S]Jun-20Dec
2.721.48(8.64)(21.4)(23.9)(115)(115)(105.7)494(13)2,6561,5831,073960(148)24MAPBMAPBogaAdiperkasaTbk.[S]Jun-20Dec
2.680.00(0.479)(0.481)(301.4)(1.93)(1.93)(0.484)101(558)8082.858051.28(1.93)27NATONusantaraPropertiInternasionalTbk.Jun-20Dec
1.060.05(0.565)(0.594)(1,507.7)(3.21)(3.21)(0.583)98(178)1,136561,0800.43(3.21)26NASAAyanaLandInternationalTbk.Jun-20Dec
0.121.37(7.51)(17.8)(35.2)(95)(76)(126.7)712(0.663)2,0241,169855432(115)29PANRPanoramaSentrawisataTbk.[S]Jun-20Dec
0.510.09(1.84)(2.00)(171.6)(11)(11)(1.96)98(26)818657538.78(11)28NUSASinergiMegahInternusaTbk.Sep-19Dec
1.350.03(93.2)(95.8)(40,637.3)(3.60)(3.60)(47.0)49(1.41)150.42150.04(3.60)31PGJOTourindoGuideIndonesiaTbk.Mar-20Dec
2.301.66(26.5)(70.5)(141.5)(53)(51)(144.1)204(3.26)38824214673(68)30PDESDestinasiTirtaNusantaraTbk.[S]Jun-20Dec
0.421.25(6.50)(14.6)(115.2)(147)(146)(183.0)1,252(2.87)4,5042,5002,004254(130)33PJAAPembangunanJayaAncolTbk.[S]Jun-20Dec
1.570.44(3.01)(4.35)(37.3)(1.38)(1.35)(5.55)128(36)9028627.26(1.19)32PGLIPembangunanGrahaLestariIndahTbk.[S]Jun-20Dec
1.340.17(4.98)(5.80)(111.4)(11)(11)(2.17)37(23)4516438720(11)35PSKTRedPlanetIndonesiaTbk.[S]Jun-20Dec
3.040.79(11.8)(21.1)(125.9)(27)(25)(63.3)301(14)42918924040(28)34PNSEPudjiadi&SonsTbk.[S]Jun-20Dec](https://image.slidesharecdn.com/7idxmonthlystatisticsjuli2020-201227101938/85/7-idx-monthly-statistics-juli-2020-62-320.jpg)
![59IDX MONTHLY STATISTICS, JULY 2020
DATA SERVICES | INDONESIA STOCK EXCHANGE
Liabi-
lities
Annual
Profit
for
the
period
Profit
attr.
to
owner's
entity
FinancialData&Ratios
billionIDR
P/E
Ratio,
x
Price
toBV,
x
D/E
Ratio,
x
ROA,
%
ROE,
%
NPM,
%ListedStocks
FS
Date
Fiscal
Year
EndEBT
EPS,
IDR
Book
Value,
IDRSalesAssetsEquity
PTSP
PZZA
SHID
SOTS
UANG
ADVERTISING,PRINTINGANDMEDIA
ABBA
BLTZ
DMMX
EMTK
FILM
FORU
IPTV
JTPE
KBLV
LINK
LPLI
MARI
MDIA
MNCN
MSIN
MSKY
SCMA
TMPO
VIVA
HEALTHCARE
CARE
HEAL
MIKA
PRDA
PRIM
SAME
SILO
SRAJ
COMPUTERANDSERVICES
ASGR
ATIC
CASH
DIGI
DNET
ENVY
GLVA
LMAS
LUCK
MLPT
MTDL
TECH
INVESTMENTCOMPANY
ABMM
MLPTMultipolarTechnologyTbk.[S]Jun-20Dec2,3371,5447921,1569874806.8720.213.9
LUCKSentralMitraInformatikaTbk.[S]Jun-20Dec16329134635.424.234.235.196.3113.5
4.900.58(3.09)(4.88)(143.7)
0.88
38SHIDHotelSahidJayaInternationalTbk.[S]Jun-20Dec1,44353091331(22)(22)(22)(39.8)815(101)
376.93415901.51
7.921.38(26.4)(62.7)(45.1)(44)(45)(411.7)656(13)345200145202(43)36PTSPPioneerindoGourmetInternationalTbk.[S]Jun-20Dec
PZZASarimelatiKencanaTbk.[S]Jun-20Dec2,3621,1081,2551,8181610100.891.671.15
3.861.890.090.2710.60.030.030.25921,4123202101112.870.0240UANGPakuanTbk.Jan-20Dec
0.660.45(4.35)(6.31)(384.8)(15)(9.23)(18.5)292(11)4241322924.80(15)39SOTSSatriaMegaKencanaTbk.[S]Jun-20Dec
(2.78)(7.64)(14.2)N/A(66.6)(30)(23)(17.0)(18)(2.95)329378(50)70(33)1ABBAMahakaMediaTbk.Jun-20Dec
1.150.76(12.9)5406.1795
2.640.164.635.3816.418184.698749781110671220213DMMXDigitalMediatamaMaximaTbk.Jun-20Dec
2.971.61(13.4)(35.0)(158.6)(185)(185)(424.4)1,211(8.48)2,7661,7081,058234(186)2BLTZGrahaLayarPrimaTbk.[S]Jun-20Dec
1.140.01(4.90)(4.96)(118.4)(34)(34)(7.07)143(23)1,372151,35757(34)5FILMMDPicturesTbk.[S]Jun-20Dec
2.280.56(2.43)(3.78)(7.87)(395)(210)(74.6)1,975(60)17,3366,19311,1445,348(147)4EMTKElangMahkotaTeknologiTbk.[S]Jun-20Dec
1.990.612.083.3412.11261055.501656010,1453,8336,3121,734587IPTVMNCVisionNetworksTbk.[S]Jun-20Dec
0.720.40(16.7)(23.4)(52.8)(6.66)(6.66)(28.6)122(3.07)80235725(6.64)6FORUFortuneIndonesiaTbk.Jun-20Dec
0.626.580.070.515.330.402.482.845571227,3536,38397093269KBLVFirstMediaTbk.[S]Jun-20Dec
1.760.66(1.98)(3.28)(8.47)(12)(12)(14.1)431(54)1,223484739286(15)8JTPEJasuindoTigaPerkasaTbk.[S]Jun-20Dec
0.130.28(6.42)(8.23)(386.4)(29)(29)(49.2)597(1.55)89719869915(29)11LPLIStarPacificTbk.[S]Jun-20Dec
1.200.5211.417.482.5198198276.21,5896.906,9122,3634,54995926410LINKLinkNetTbk.[S]Mar-20Dec
0.791.441.072.604.3269651.6563306,0623,5752,4871,49710513MDIAIntermediaCapitalTbk.Dec-19Dec
1.140.48(7.66)(11.3)(70.9)(15)(13)(4.98)44(10)34211123137(15)12MARIMahakaRadioIntegraTbk.Jun-20Dec
0.950.586.5910.421.1787629.12799.142,2968461,45071610015MSINMNCStudiosInternationalTbk.[S]Jun-20Dec
0.870.3610.414.248.21,008956134.09466.1218,3944,88613,5083,9671,24714MNCNMediaNusantaraCitraTbk.[S]Jun-20Dec
0.620.67(11.4)(19.0)(50.1)(24)(23)(42.6)224(3.24)39515823790(28)18TMPOTempoIntiMediaTbk.[S]Jun-20Dec
3.370.2017.721.350.9
0.53
17SCMASuryaCitraMediaTbk.[S]Jun-20Dec6,7891,1555,6342,36181960360181.338116
16(83.9)1,384(14)0.82MSKYMNCSkyVisionTbk.[S]Jun-20Dec4,2171,4572,7601,016(93)(84)(84)(3.97)(6.06)(16.5)
2.470.57(12.5)897(11)96
0.726.46(6.43)(48.0)(26.0)(541)(551)(33.5)70(1.49)8,5687,4201,1482,118(506)19VIVAVisiMediaAsiaTbk.[S]Dec-19Dec
3.130.744.147.2112.013410470.1973435,0402,1472,8931,7321932HEALMedikalokaHerminaTbk.[S]Jun-20Dec
3.440.050.370.3812.06.276.270.38999013,4321493,2831047.631CAREMetroHealthcareIndonesiaTbk.[S]Jun-20Dec
1.890.25(1.26)(1.58)(3.68)(12)(12)(25.8)1,636(120)1,9203861,534657(17)4PRDAProdiaWidyahusadaTbk.[S]Jun-20Dec
7.120.229.8612.040.131828940.5337595,8591,0594,7991,4413943MIKAMitraKeluargaKaryasehatTbk.[S]Jun-20Dec
1.310.48(3.01)(4.46)(8.17)
1.33
7SILOSiloamInternationalHospitalsTbk.[S]Jun-20Dec8,6282,8065,8233,176(77)(129)(130)(159.6)3,582(29)
6(16.1)158(5.35)0.55
1.080.050.510.545.532.252.291.3525120289743853833.735PRIMRoyalPrimaTbk.[S]Jun-20Dec
SAMESaranaMeditamaMetropolitanTbk.[S]Jun-20Dec2,1651,235930216(47)(47)(47)(4.38)(10.2)(44.0)
3.461.3213.3401(5.87)97
1.191.45(3.00)(7.34)(26.5)(63)(63)(10.5)143(16)4,1932,4781,715476(64)8SRAJSejahterarayaAnugrahjayaTbk.[S]Jun-20Dec
1.514.05(1.47)(7.41)(4.79)(6.70)(17)(30.2)408(20)4,7673,8239441,4609.592ATICAnabaticTechnologiesTbk.Mar-20Dec
0.560.651.612.652.88212131.01,170212,5971,0191,5781,452261ASGRAstraGraphiaTbk.[S]Jun-20Dec
16.80.11(18.7)(20.8)(44.9)(3.58)(3.58)(22.0)106(81)383.883416(3.63)4DIGIArkadiaDigitalMediaTbk.[S]Jun-20Dec
7.110.55(4.43)(6.85)(52.7)(4.71)(3.89)(5.44)79(104)1766211315(5.74)3CASHCashlezWorldwideIndonesiaTbk.Jun-20Dec
0.600.26(7.15)(9.02)(308.2)(15)(14)(15.1)168(6.68)381793028.83(15)6ENVYEnvyTechnologiesIndonesiaTbk.[S]Jun-20Dec
5.090.640.410.6731.831324.5667875615,7546,1389,615203385DNETIndoritelMakmurInternasionalTbk.Jun-20Dec
0.362.50(8.55)(29.9)(90.2)(20)(8.10)(41.1)137(1.22)37927110836(20)8LMASLimasIndonesiaMakmurTbk.[S]Mar-20Dec
2.623.932.039.991.898.768.7611.711726865689175926127GLVAGalvaTechnologiesTbk.Jun-20Dec
1.110.755.619.825.03217156127.11,295115,5602,3813,1796,20827811MTDLMetrodataElectronicsTbk.[S]Jun-20Dec
1.381.95
0.22
1085.64236.84
911.8187251.60
0.420.84(130.2)849(11)98
2.790.194.114.8824.41.531.312.084357641054111.5612TECHIndosterlingTechnomediaTbk.[S]Jun-20Dec
0.882.66(0.798)(2.92)(2.36)(63)(49)(35.6)1,217(30)12,2658,9163,3494,149(26)1ABMMABMInvestamaTbk.Jun-20Dec](https://image.slidesharecdn.com/7idxmonthlystatisticsjuli2020-201227101938/85/7-idx-monthly-statistics-juli-2020-63-320.jpg)
![60
DATA SERVICES | INDONESIA STOCK EXCHANGE
IDX MONTHLY STATISTICS, JULY 2020
Liabi-
lities
Annual
Profit
for
the
period
Profit
attr.
to
owner's
entity
FinancialData&Ratios
billionIDR
P/E
Ratio,
x
Price
toBV,
x
D/E
Ratio,
x
ROA,
%
ROE,
%
NPM,
%ListedStocks
FS
Date
Fiscal
Year
EndEBT
EPS,
IDR
Book
Value,
IDRSalesAssetsEquity
BHIT
BMTR
BNBR
KREN
MGNA
MLPL
NICK
OCAP
PEGE
PLAS
POOL
SRTG
OTHERS
BOLA
DYAN
GEMA
INDX
ITMA
MFMI
RONY
SFAN
SIMA
SOSS
YELO
Note:*)ThesecompaniesareexcludedfromtheaveragePERcomputation
**)ThesecompanieswithnegativeequitiesarenotcomputedforROE
***)ThevalueofsectorandsubsectorexcludeAccelerationBoard
10SOSSShieldonServiceTbk.[S]Jun-20Dec3031661377468.525.415.4116.5209251.961.213.577.891.45
11YELOYeloooIntegraDatanetTbk.[S]Jun-20Dec764.93712.15(11)(11)(11)(56.8)187(0.881)0.270.07(28.4)(30.4)(1,004.0)
8SFANSuryaFajarCapitalTbkJun-20Dec260452154.273.583.584.336.371581546.200.213.334.03202.9
9SIMASiwaniMakmurTbk.Sep-19Dec260262(2.00)3.28(17)(17)(17)(51.8)(4.53)(0.964)(11.0)(130.5)(8.83)N/A(699.7)
OCAPOnixCapitalTbk.Jun-20Dec35209(174)4.43(5.85)(5.85)(5.85)(33.8)N/A(264.4)
7RONYAeslerGrupInternasionalTbk.[S]Sep-19Dec182.14169.785.234.644.644.95132810.80.1334.339.063.2
NICKCharnicCapitalTbk.Jun-20Dec1002.3398(2.90)(2.88)(2.88)(2.88)(5.74)(5.88)N/A
6MFMIMultifilingMitraIndonesiaTbk.[S]Mar-20Dec484239245359.598.178.1743.2324121.610.976.7613.393.4
WeightedAveragePBV1.59
AveragePER10.35
WeightedAveragePER27.53
AveragePBV1.77
0.110.89(1.70)(3.21)(13.4)284(480)(14.2)441(3.53)56,50026,61229,8887,1485262BHITMNCInvestamaTbk.Jun-20Dec
0.485.90(1.66)(11.4)(19.0)(122)(125)(12.0)105(4.16)15,12812,9362,1921,318(121)4BNBRBakrie&BrothersTbk.Jun-20Dec
0.170.603.575.7118.81,01755271.91,2592.9730,90111,58819,3135,8621,1663BMTRGlobalMediacomTbk.[S]Jun-20Dec
(0.567)(1.09)375.6N/AN/A171631.2(88)1.608.3497(89)0.00176MGNAMagnaInvestamaMandiriTbk.Jun-20Dec
0.670.28(1.32)(1.69)(0.800)53(25)(2.74)162(39)3,7698142,9546,240615KRENKresnaGrahaInvestamaTbk.[S]Jun-20Dec
(0.273)(1.20)
0.02
9(42.8)(637)(4.06)
8(8.84)150(35)2.05
0.152.44(6.61)(22.7)(21.5)(692)(564)(77.1)339(0.675)17,07312,1084,9665,253(584)7MLPLMultipolarTbk.[S]Jun-20Dec
0.380.20(1.61)(1.94)(150.5)(1.49)(1.49)(2.52)130(20)185311541.98(1.44)11PLASPolarisInvestamaTbk.[S]Jun-20Dec
0.750.02(8.37)(8.51)N/A(21)(21)(15.0)176(8.81)5078.11499(21)(22)10PEGEPancaGlobalKapitalTbk.Jun-20Dec
0.360.18(17.3)(20.4)(681.4)(2,091)(2,089)(1,539.7)7,564(1.79)24,1273,60720,520613(2,484)13SRTGSaratogaInvestamaSedayaTbk.Jun-20Dec
0.230.04(20.3)(21.0)N/A(54)(53)(45.2)215(1.11)52218504(17)(53)12POOLPoolAdvistaIndonesiaTbk.Jun-20Dec
2.060.105.345.8666.77.156.994.66793552447477427.151BOLABaliBintangSejahteraTbk.[S]Mar-20Dec
1.30(11.4)13.53884599
1.561.260.390.870.781.861.662.08238179863481381428113GEMAGemaGrahasaranaTbk.[S]Jun-20Dec
0.300.53(17.1)(26.2)(141.3)(107)(94)(44.0)168(1.14)1,098381717133(106)2DYANDyandraMediaInternationalTbk.[S]Jun-20Dec
0.150.007.998.0098,426.1193193222.02,7751.852,4204.282,4160.201935ITMASumberEnergiAndalanTbk.[S]Mar-20Mar
0.450.120.620.7015.90.190.190.8712564616.31552.400.194INDXTanahLautTbk.Jun-20Dec](https://image.slidesharecdn.com/7idxmonthlystatisticsjuli2020-201227101938/85/7-idx-monthly-statistics-juli-2020-64-320.jpg)
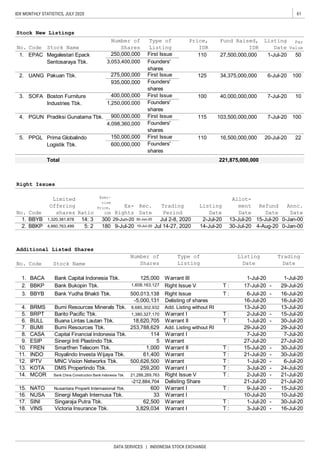
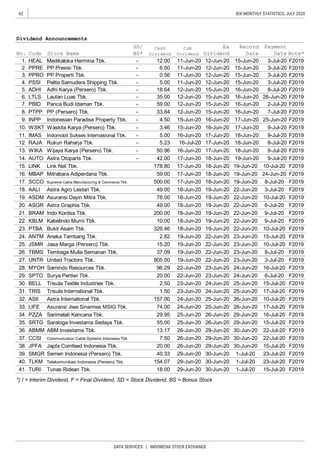
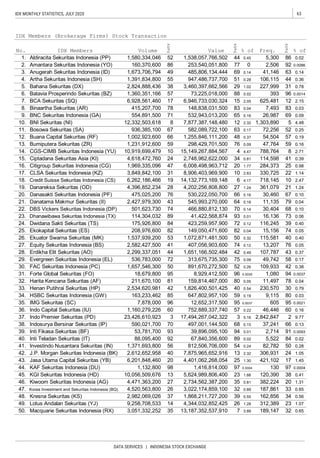
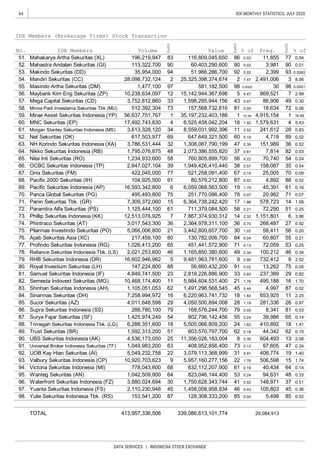
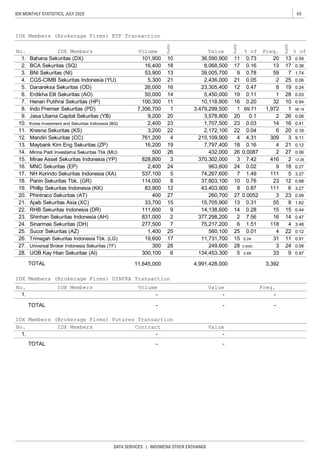
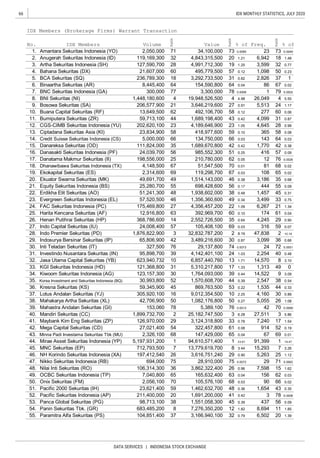
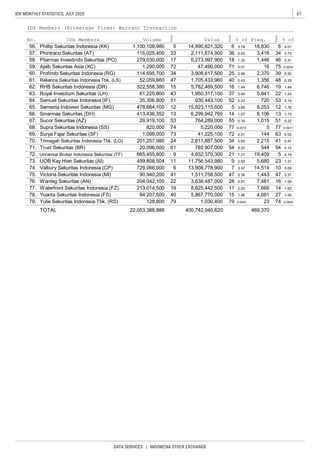
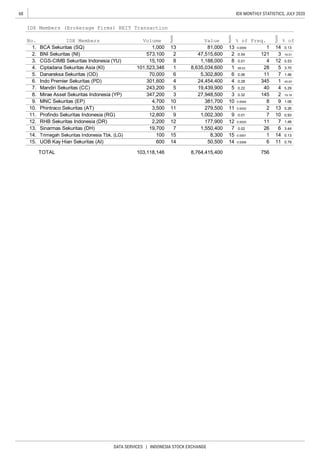
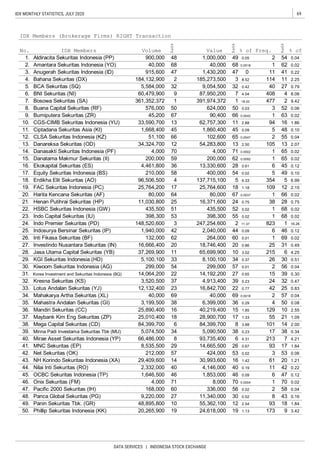
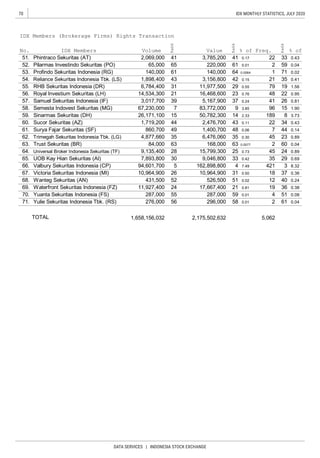
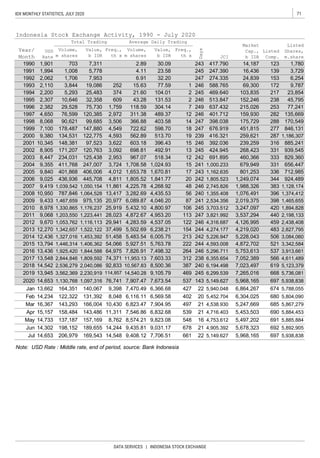
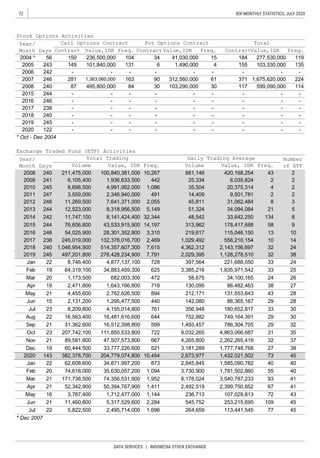
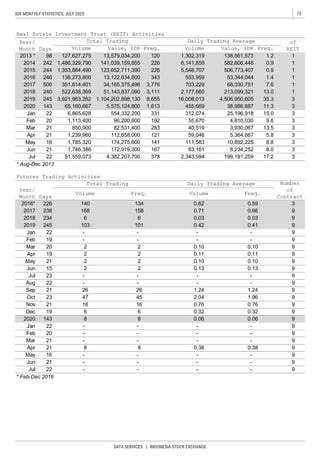
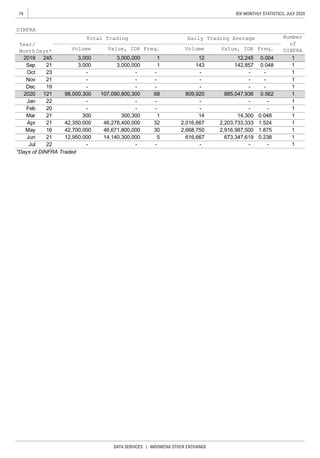
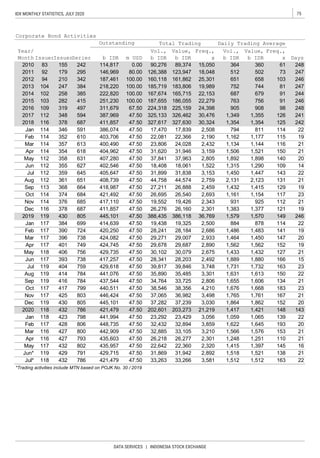
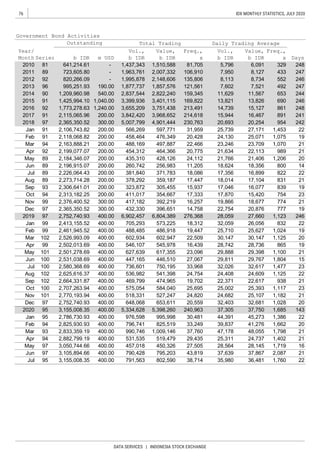
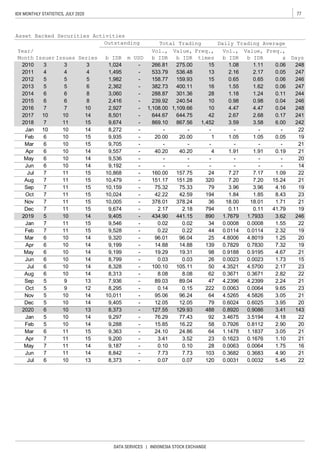
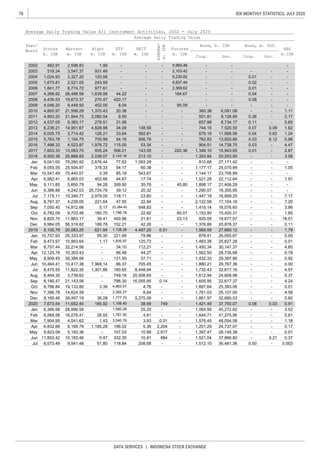
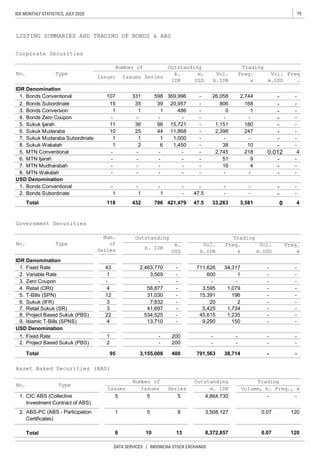
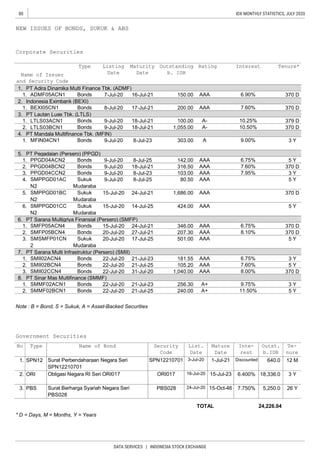
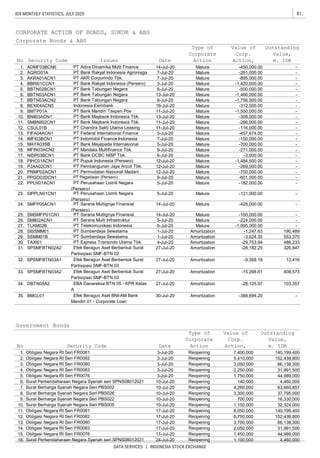
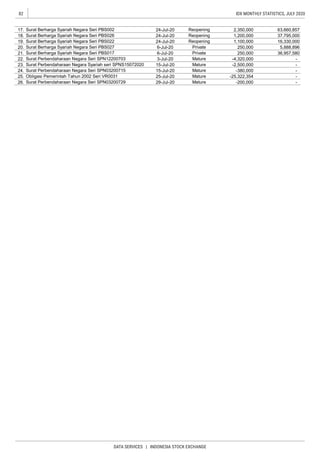
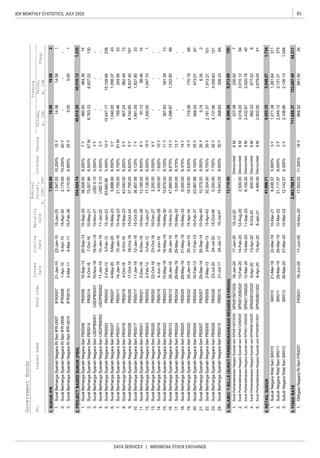
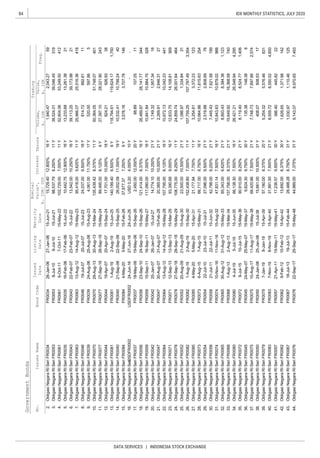
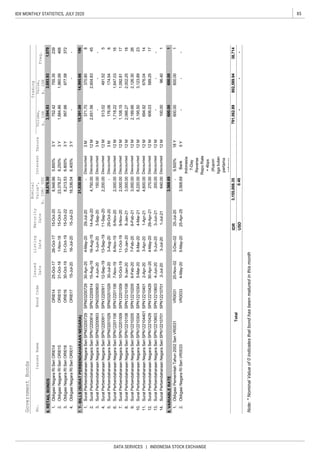
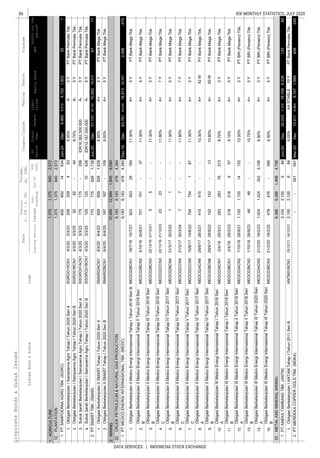
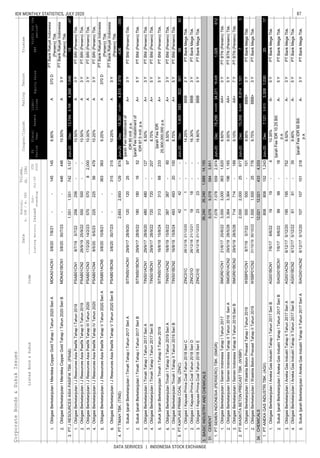
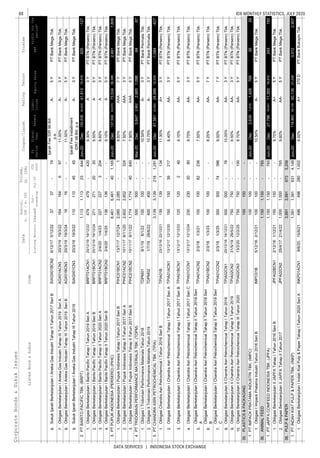
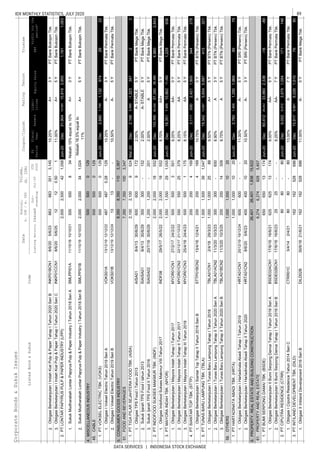
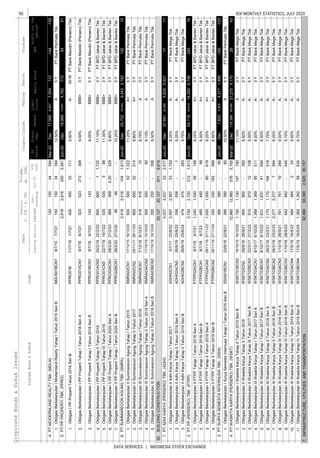
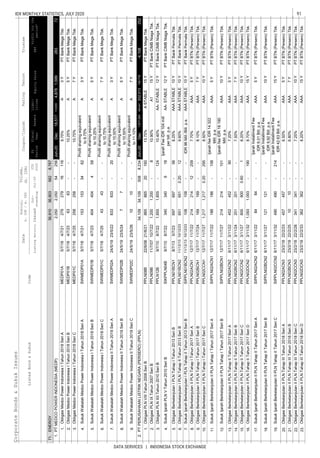
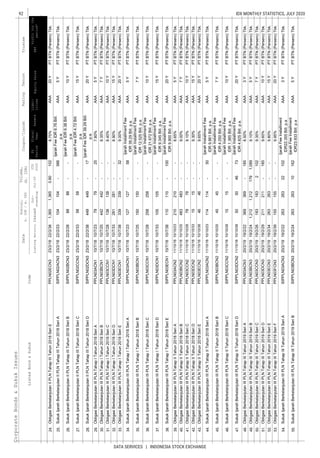
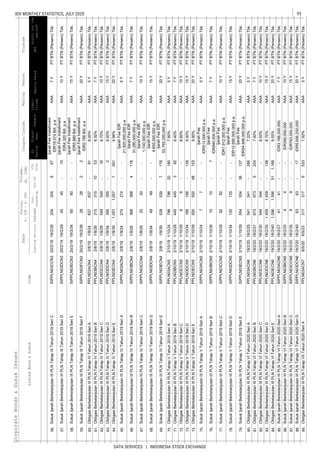
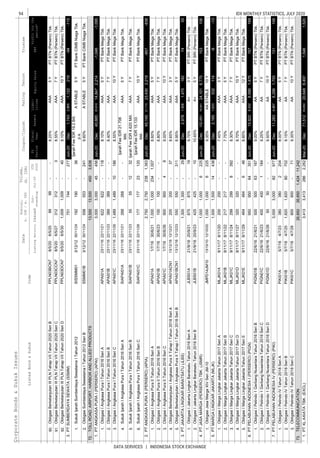
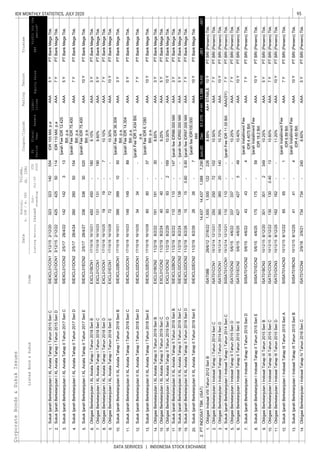
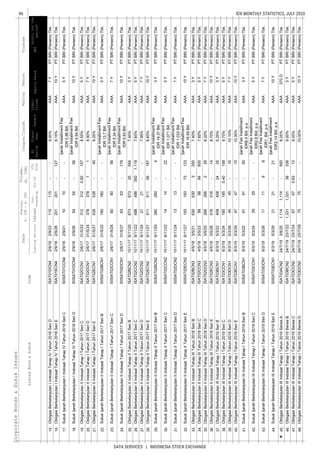
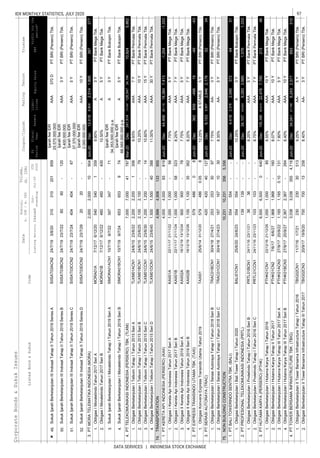
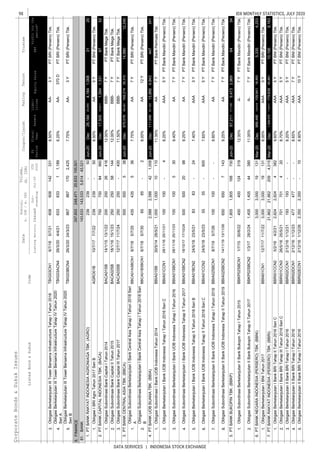
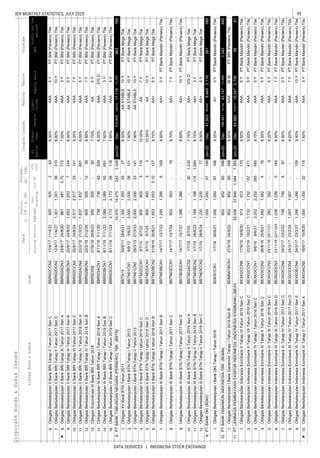
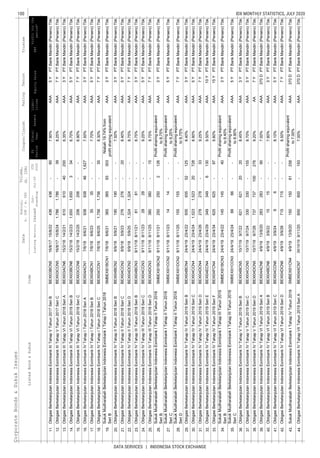
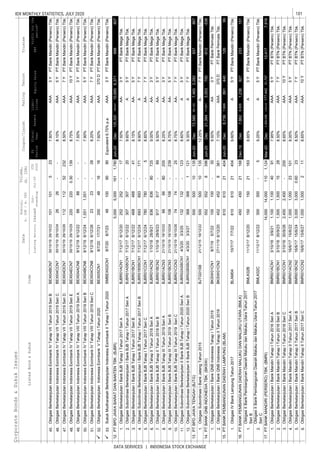
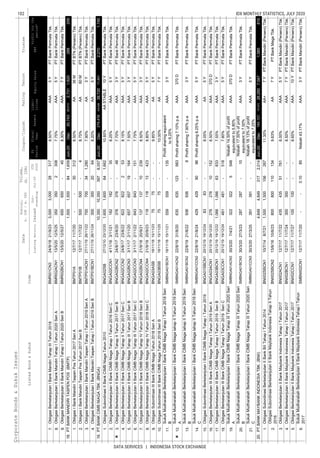
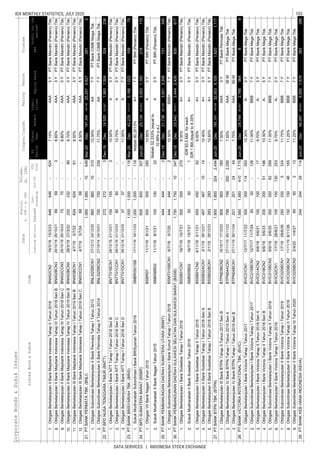
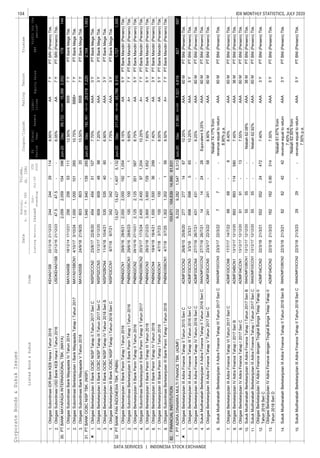
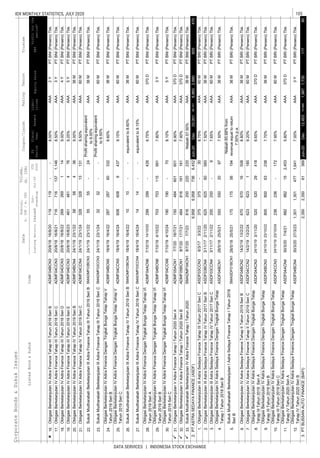
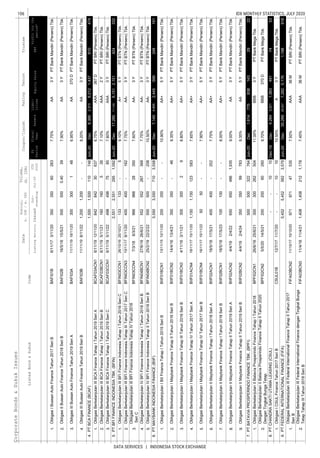
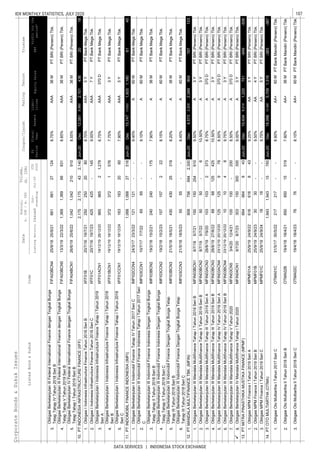
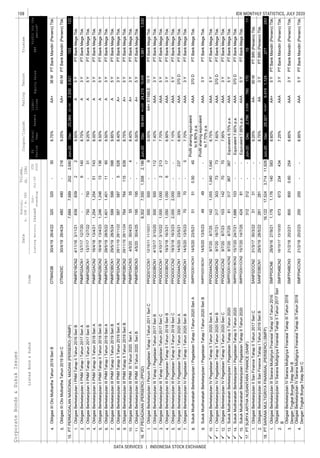
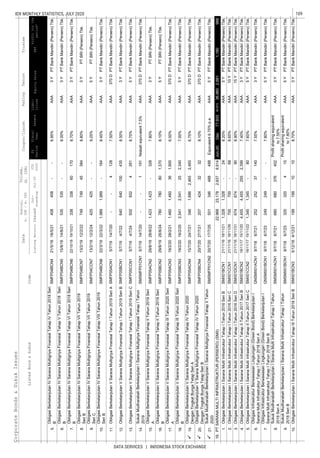
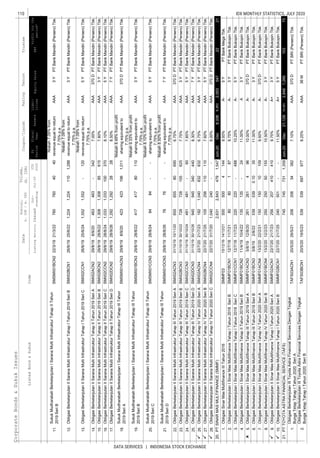
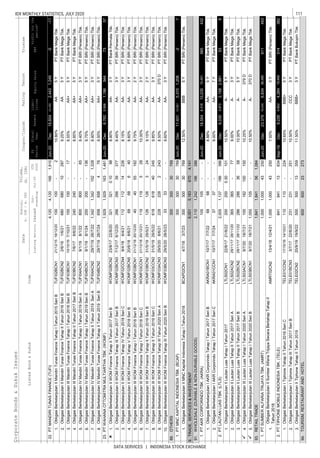
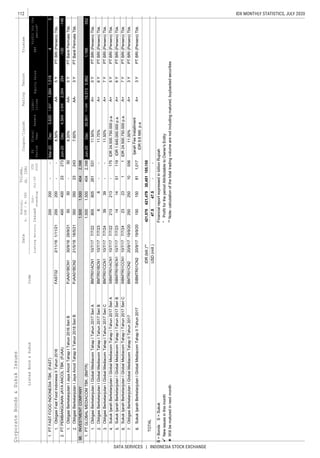
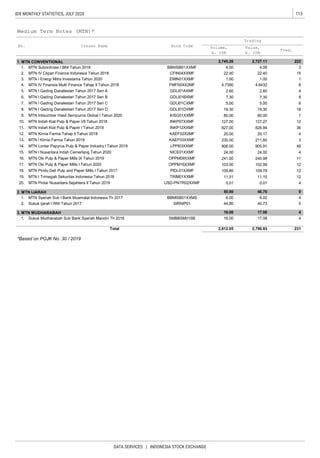
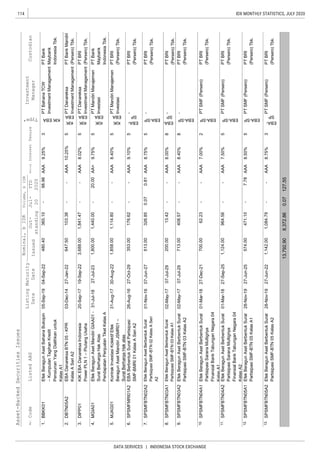
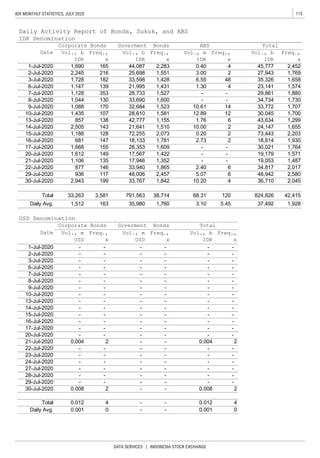
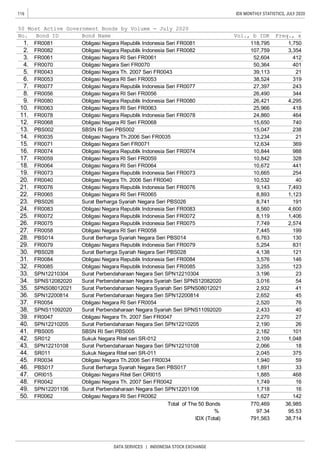
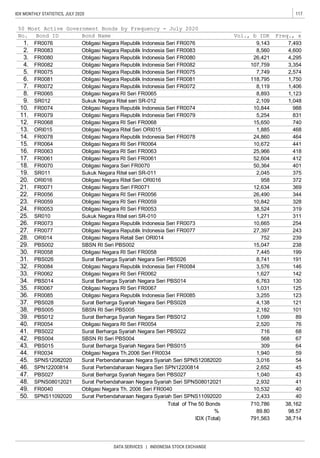
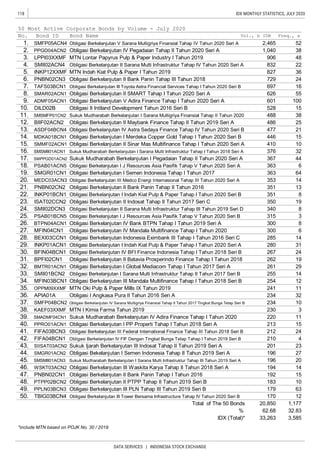
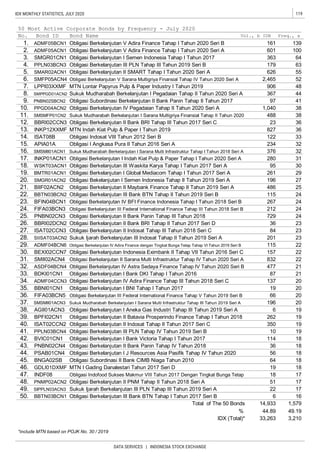
![120
DATA SERVICES | INDONESIA STOCK EXCHANGE
IDX MONTHLY STATISTICS, JULY 2020
NNootteess
1. TTrraaddiinngg VVoolluummee,, VVaalluuee aanndd FFrreeqquueennccyy:: Figures of trading volume, value and Frequency are calculated
once, except on the IDX’ members trading data. Trading Frequency refers to number of transaction.
2. NNuummbbeerr ooff sshhaarreess ((nnuummbbeerr ooff iissssuueedd sshhaarreess)):: This figures is number of listed shares after adjustment
when bonus and rights issues, share splits and consolidations are made.
3. NNuummbbeerr ooff lliisstteedd sshhaarreess:: This figures refers to the total number of shares that is already listed and can
be traded at the exchange.
4. MMaarrkkeett CCaappiittaalliizzaattiioonn:: This figures indicates the aggregate number of shares multiplied by regular
market closing price.
5. JJaakkaarrttaa CCoommppoossiittee IInnddeexx 100X
ValueBase
Shares)ofNumber*PriceClosing(Regular
Shares)ofNumber*Price(BaseValueBase
6. IInnddiivviidduuaall IInnddeexx 100X
PriceBase
PriceClosingRegular
7. To calculate the Jakarta Composite Index and Stock Individual Index, Base Price and Base Value are
adjusted when bonus and rights issues, share splits and consolidations are made. Base price for new
listed companies is IPO price.
8. To calculate Financial Ratio, the latest financial reports are used.
EEaarrnniinngg PPeerr SShhaarree ((EEPPSS)):: The figure of EPS is derived by dividing Profit for the period
attribute to owner’s entity by number of issued shares. We annualized the EPS when
interim reports are used (see the Financial statement dates and Financial Year Ends).
PPrriiccee EEaarrnniinnggss RRaattiioo ((PPEERR))
EPS
PriceClosingRegular
BBooookk VVaalluuee ppeerr SShhaarree ((BBVV)):: The figure of BV is derived by dividing the Total
Shareholders’ Equity by number of issued shares.
PPrriiccee ttoo BBooookk VVaalluuee ((PPBBVV))
BV
PriceClosingRegular
DDeebbtt EEqquuiittyy RRaattiioo ((DDEERR))
Equity
sLiabilitieTotal
RReettuurrnn OOnn AAsssseett ((RROOAA)) 100X
AssetsTotal
periodtheforProfit
RReettuurrnn OOnn EEqquuiittyy ((RROOEE)) 100X
Equity
periodtheforProfit
NNeett PPrrooffiitt MMaarrggiinn ((NNPPMM)) 100X
SalesTotal
periodtheforProfit
9. [S] Sharia Compliant Stock
10. LLHHSS:: Left Hand Side
11. RRHHSS:: Right Hand Side](https://image.slidesharecdn.com/7idxmonthlystatisticsjuli2020-201227101938/85/7-idx-monthly-statistics-juli-2020-124-320.jpg)

The document is the Indonesia Stock Exchange's (IDX) Monthly Statistics report for July 2020. It provides statistical highlights and indices performance summaries for the month. The IDX Composite Index rose 6.56% in July while trading volume increased 13.26% from the previous month. Most sectoral indices also increased except for the Infrastructure, Utility & Transportation Index which fell 15.26%. The report also includes rankings of the top 20 most active stocks and brokerage houses for the month by various trading metrics.


