1) Psychology research aims to understand human behavior scientifically. It relies on empirical research methods to test hypotheses and establish causal relationships.
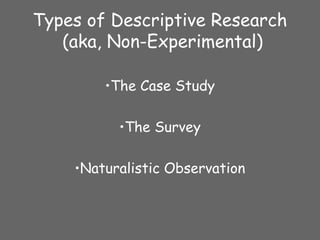
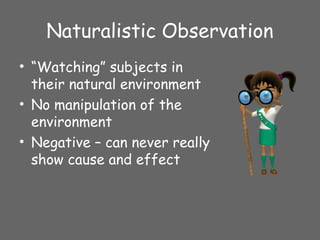
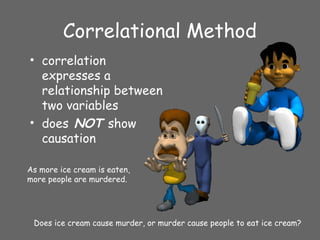
2) There are several types of descriptive research methods, including case studies, surveys, and naturalistic observation. However, these are limited because they cannot prove causation.
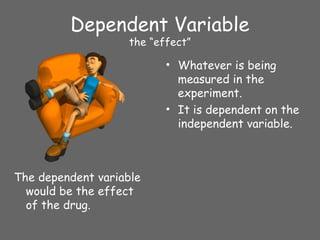
3) Experimental methods allow researchers to test hypotheses about cause-and-effect relationships by manipulating the independent variable and measuring its impact on the dependent variable. Control groups help rule out alternative explanations.