Download to read offline
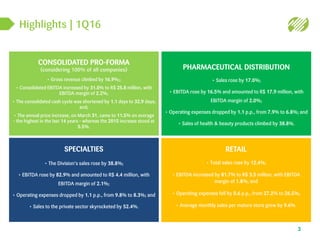
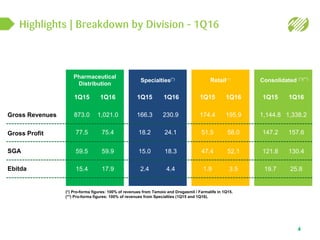

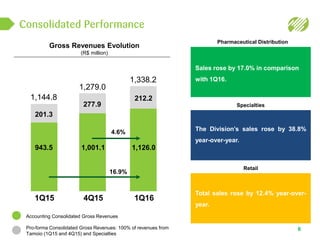
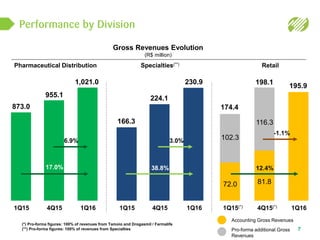
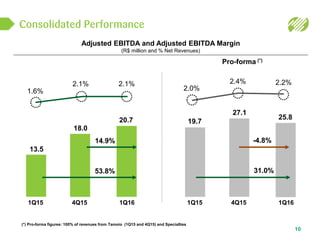


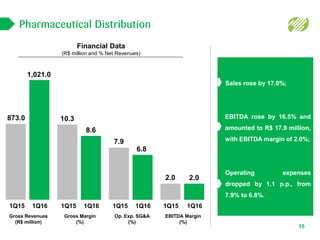

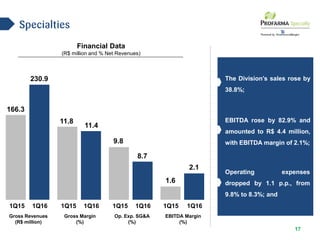

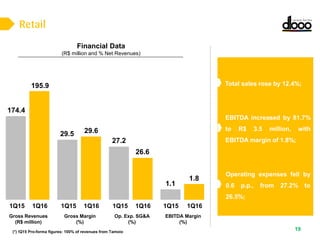


The document provides an earnings release and financial highlights for Profarma's 1Q16 results. Some key points include: - Gross revenue increased 16.9% to R$1.338 billion driven by growth across all divisions. - Consolidated EBITDA rose 31.0% to R$25.8 million with an EBITDA margin of 2.2%. - The pharmaceutical distribution division saw a 17.0% revenue increase and 16.5% EBITDA growth. - Specialties revenue grew 38.8% and EBITDA rose 82.9%. - Retail sales increased 12.4% while EBITDA grew 81.7% to R$3.5


