Download to read offline
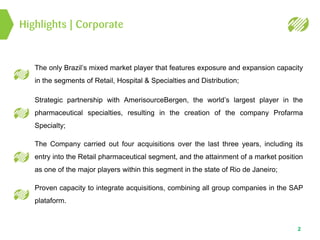
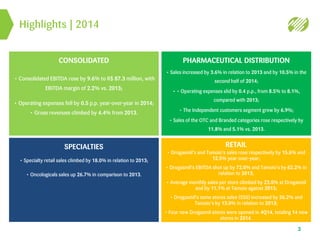
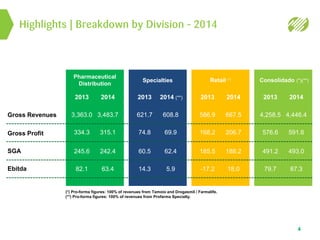

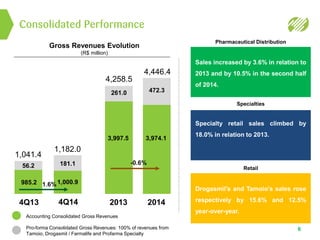
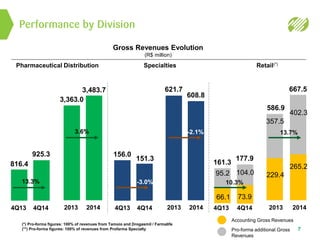
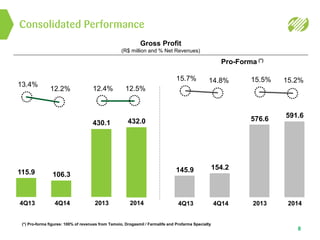
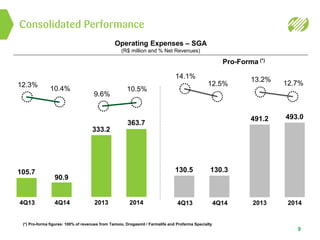
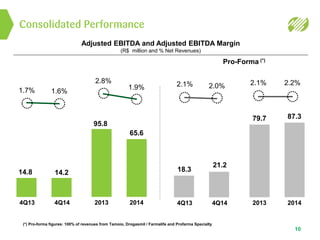
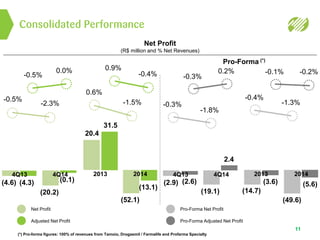
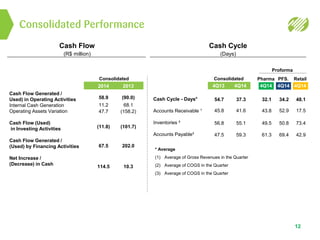
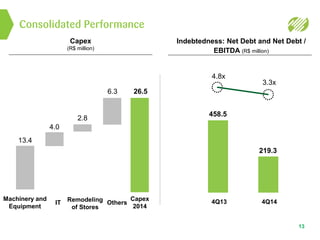

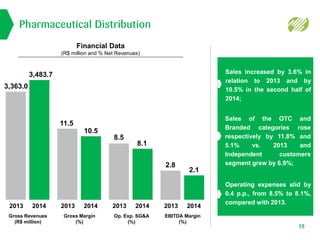

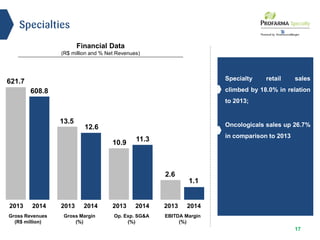
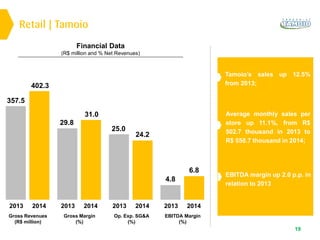
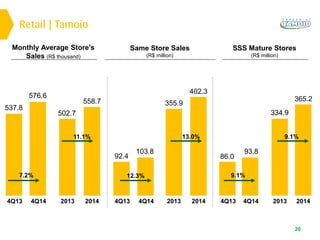
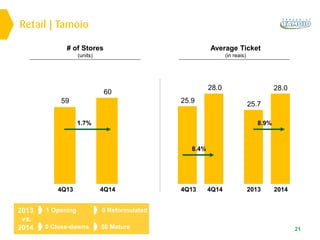
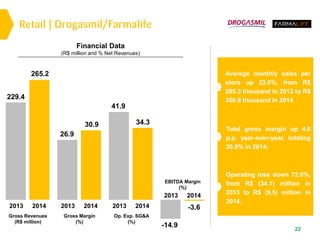
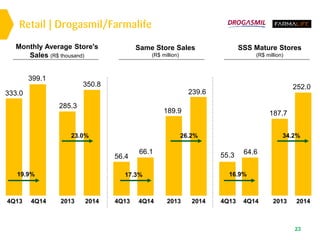
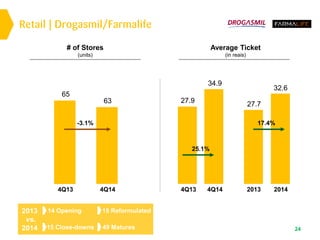

This document provides an earnings release and financial highlights for a Brazilian pharmaceutical company for the fourth quarter and full year 2014. Key points include: - Consolidated EBITDA rose 9.6% to R$87.3 million in 2014, with an EBITDA margin of 2.2% versus 2013. - Sales increased in the pharmaceutical distribution, specialties, and retail divisions. The retail division benefited from sales growth and store expansion at Drogasmil and Tamoio pharmacies. - Net losses widened in 2014 due to higher financial expenses, though operating results improved across divisions. - The company remains focused on acquisitions and integrating companies onto its SAP platform to drive synergies.


