Download to read offline

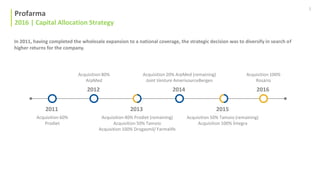
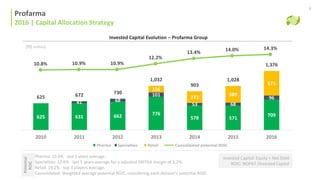
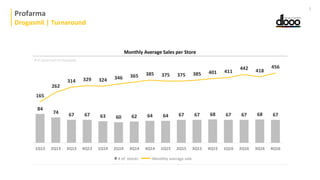


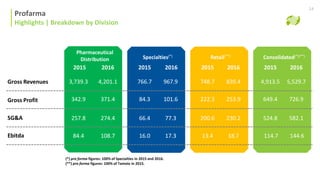

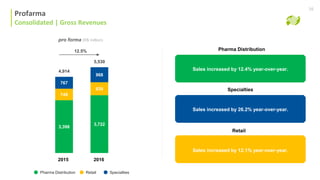
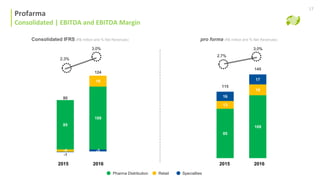
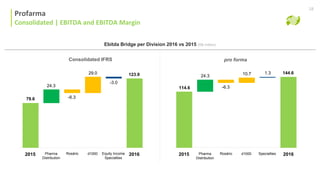
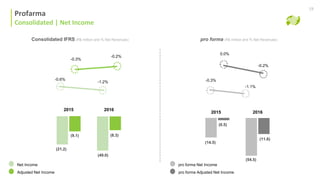
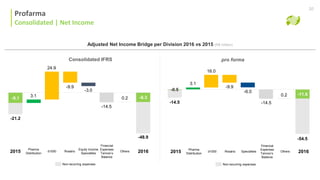
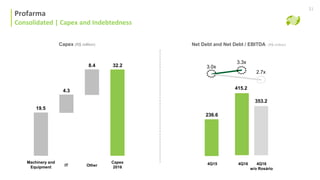

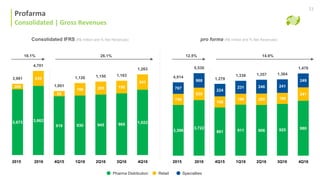
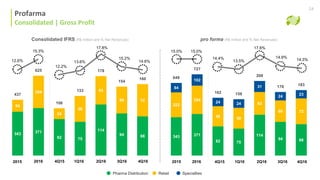
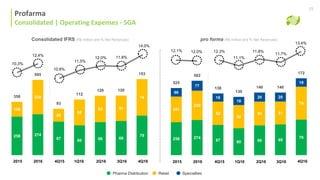
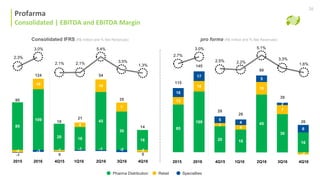
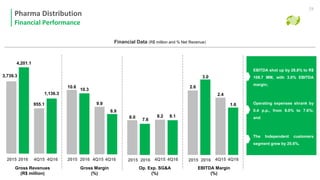
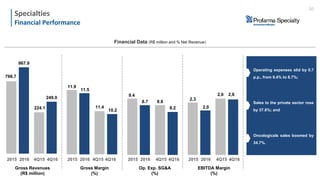
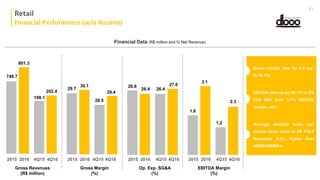
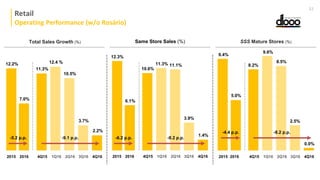
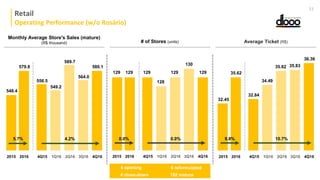


The document summarizes Profarma's capital allocation strategy and performance in 2016. In 2016, Profarma achieved gross revenues of R$5.5 billion, up 12.5% year-over-year. EBITDA was R$144.6 million with a margin of 2.6%. Acquisitions of Rosário and remaining stakes in other companies contributed to growth. The company's diversified business model across pharmaceutical distribution, retail drugstores, and specialty products enhances competitiveness and synergies.


