Download to read offline
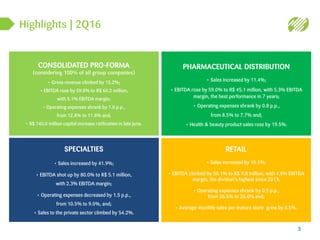
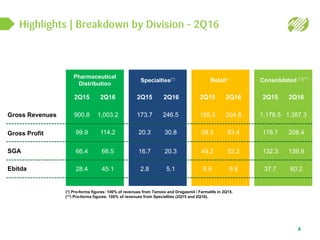

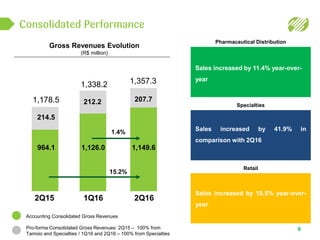
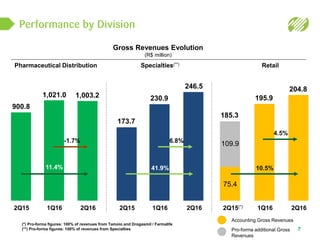
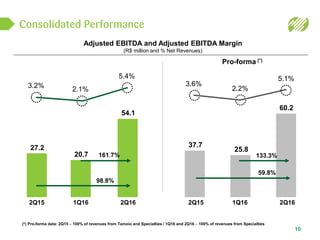
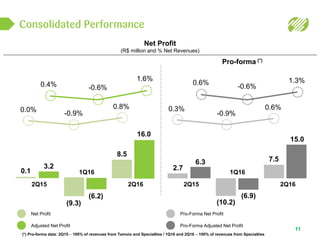

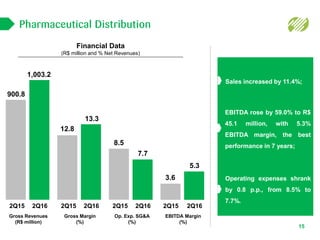

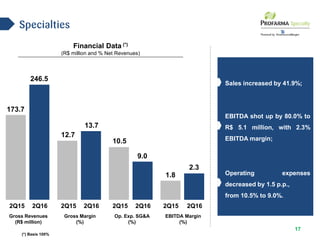

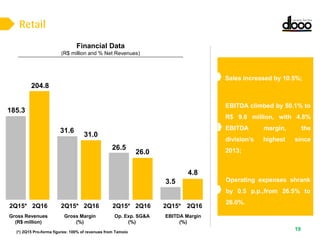
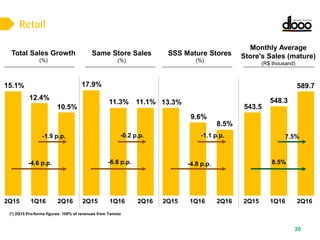
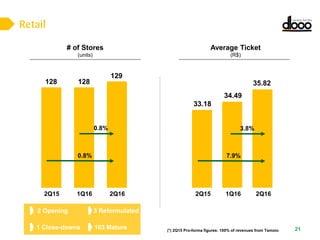


The document summarizes Profarma's 2Q16 earnings release. Key highlights include: - Consolidated pro-forma gross revenue increased 15.2% and EBITDA rose 59.8% to R$60.2 million. - Retail sales grew 10.5% and EBITDA increased 50.1% to R$9.8 million. Specialties sales rose 41.9% and EBITDA grew 80% to R$5.1 million. - Pharmaceutical distribution sales grew 11.4% and EBITDA increased 59% to R$45.1 million, the best performance in 7 years.


