Download to read offline

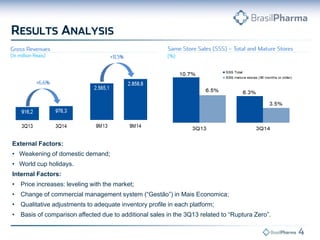
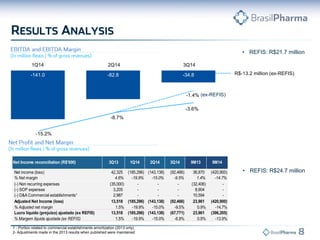

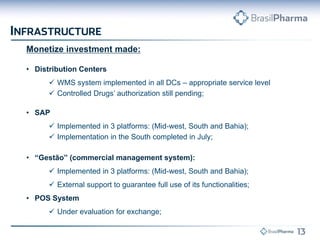
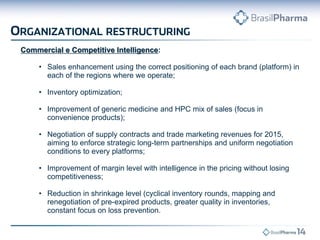
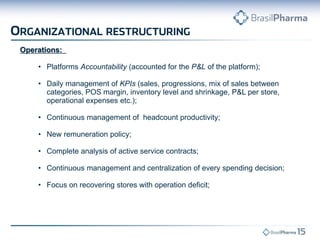


- Gross revenues increased 6.6% year-over-year to R$976.3 million in 3Q14, with same-store sales growth of 6.3%. However, EBITDA was negative at R$34.8 million. - Key factors negatively impacting financial results included weak domestic demand, world cup holidays, and price increases to level with the market. The company also underwent changes to its commercial management system. - Looking ahead, the company plans to focus on commercial initiatives, optimize inventory and generic drug mix, intensify supplier partnerships, and monetize prior investments to improve financial performance.


