Downloaded 220 times
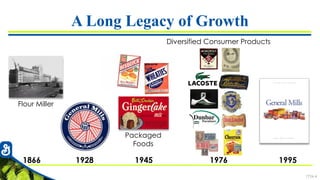
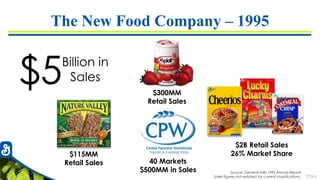
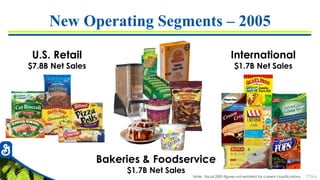
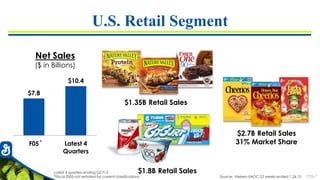
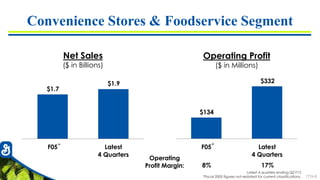
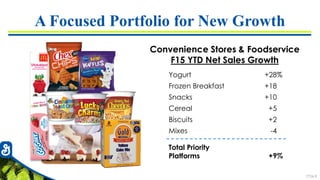
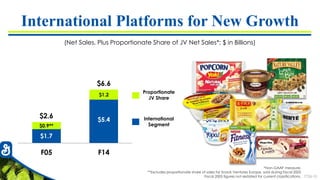
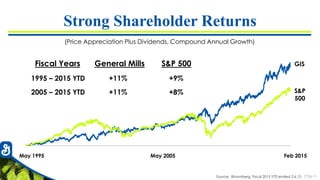
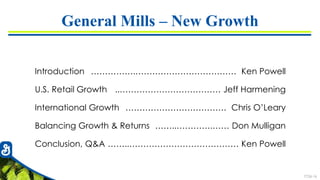
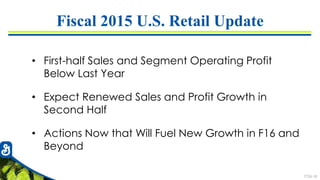
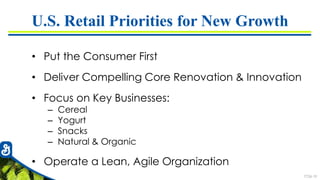

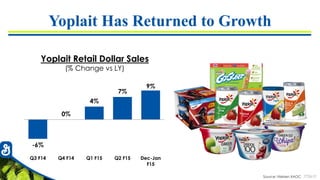
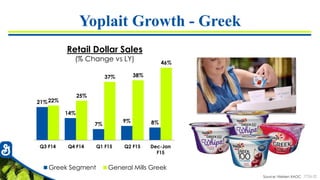
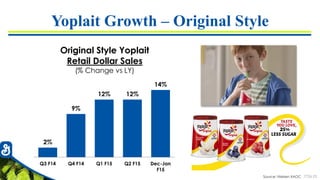
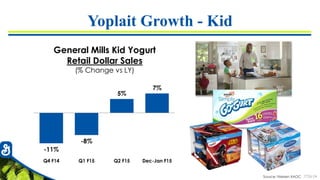
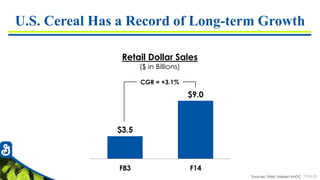
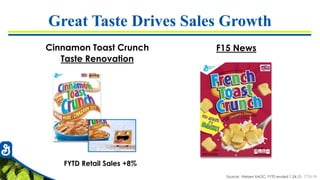
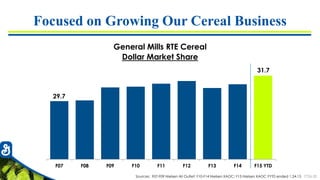
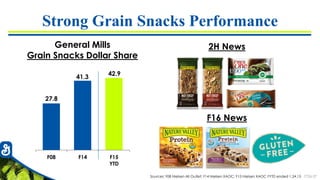
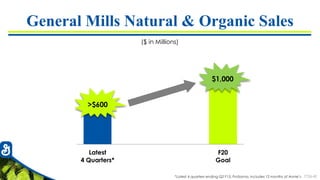
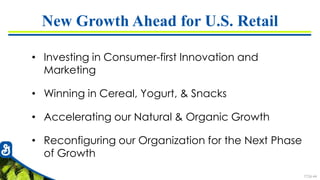
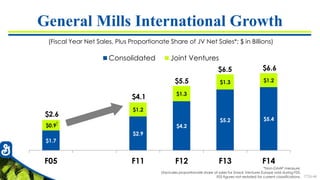
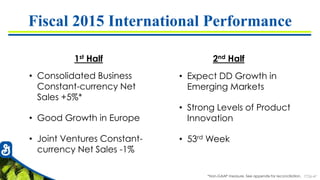
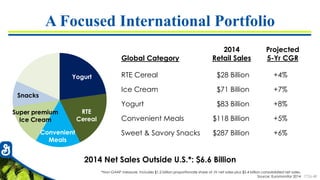
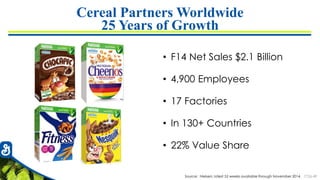
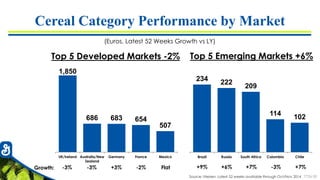
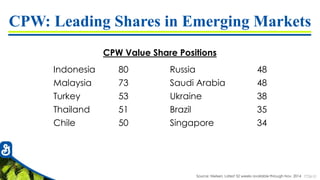
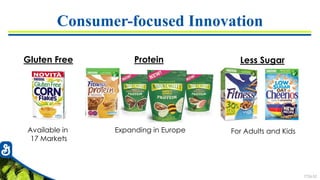
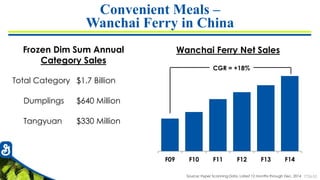
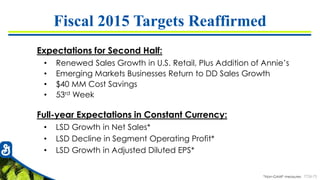

General Mills held its annual CAGNY conference to discuss new growth opportunities. Ken Powell, Chairman and CEO, kicked off the conference by highlighting the company's long history of growth since 1866 and its transition to becoming a global food company by 1995. Jeff Harmening then provided an update on the U.S. Retail segment, noting challenges in the first half of fiscal year 2015 but expectations for renewed sales and profit growth in the second half through actions like focusing on key businesses like cereal, yogurt, and snacks. Chris O'Leary followed with details on the company's strategies for continued international growth.


![2022 Beverage Forum Non-Alcoholic Workshop[87].pdf](https://cdn.slidesharecdn.com/ss_thumbnails/2022beverageforumnon-alcoholicworkshop87-230227152104-daa6433a-thumbnail.jpg?width=640&height=640&fit=bounds)


