Download to read offline
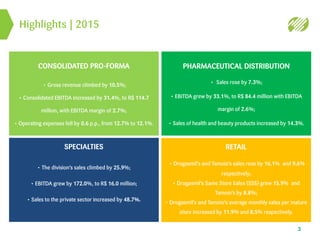
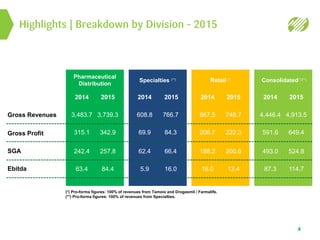

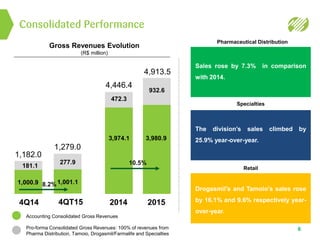
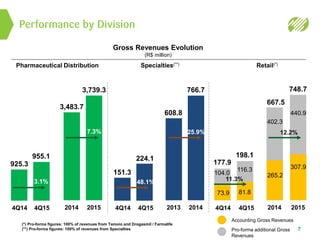
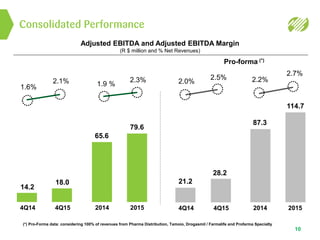

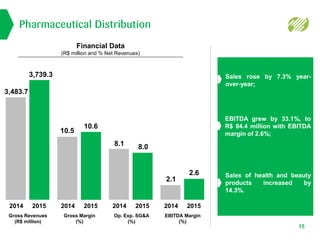

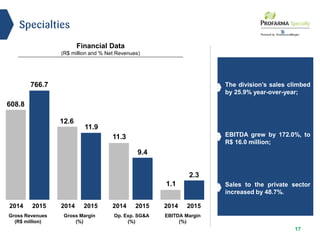
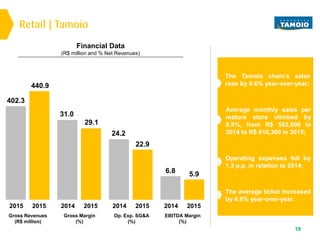
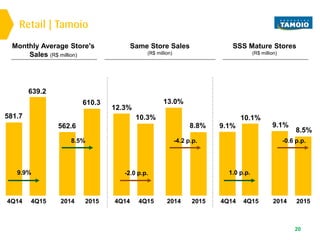
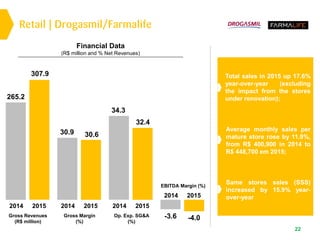
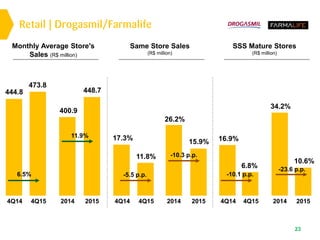


This document provides an earnings release and financial highlights for Profarma Group for the 4th quarter and full year of 2015. Key points include: - Gross revenues increased 10.5% in 2015 driven by growth across all business divisions. - Consolidated EBITDA grew 31.4% in 2015 with an EBITDA margin of 2.7%. - The retail division saw same-store sales growth of 15.9% for Drogasmil and 8.8% for Tamoio. - The specialties division achieved sales growth of 25.9% and an EBITDA increase of 172%. - Pharmaceutical distribution sales rose 7.3% while EBITDA grew 33


