Download to read offline


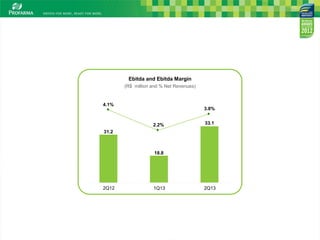
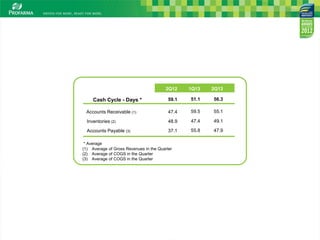


In 3 sentences: - The document summarizes the 2Q13 earnings results of a Brazilian pharmaceutical distribution company, which saw consolidated revenues increase 10.6% year-over-year to R$1.0 billion and EBITDA rise 6.3% to R$33.1 million. Key divisions like pharmaceutical distribution and hospitals & specialties grew sharply by 10.3% and 12.2% respectively. The company also implemented a new SAP system and decreased its cash cycle by 2.8 days.


