Download to read offline
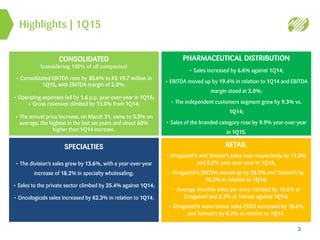
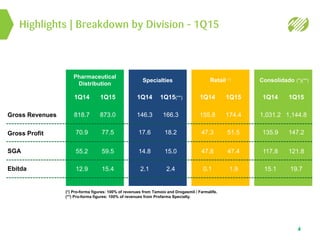

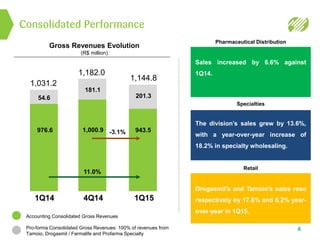
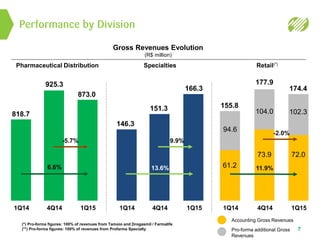
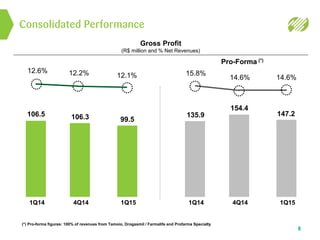
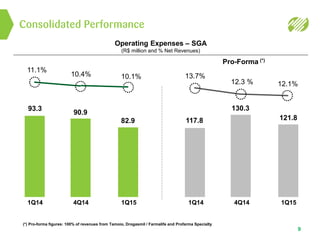
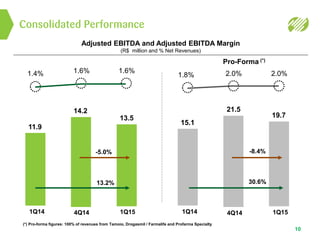
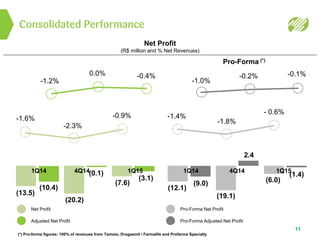
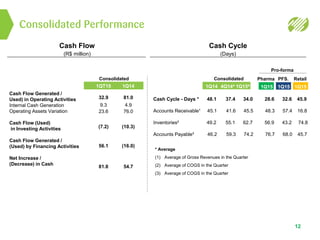
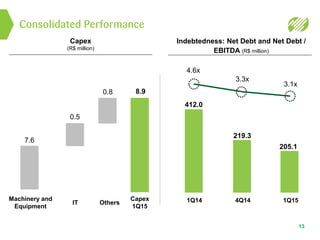

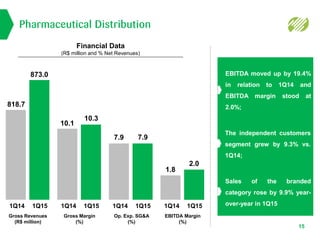
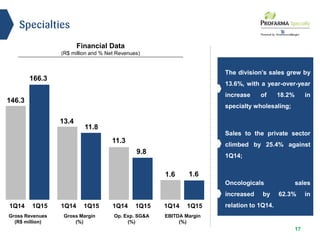
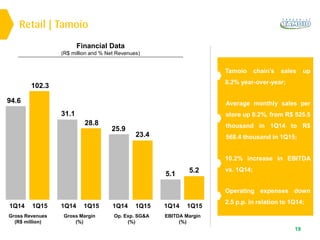
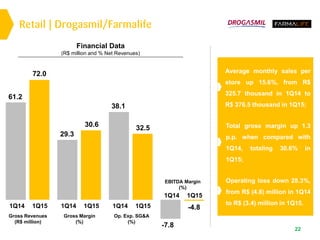
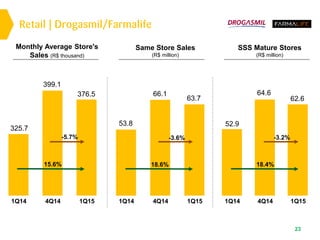
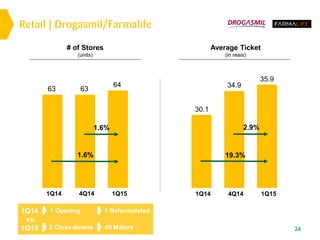

The document reports on the company's financial results for the first quarter of 2015, highlighting an 11% increase in consolidated gross revenues and a 31% rise in consolidated EBITDA. Retail sales increased by 18% at Drogasmil and 8% at Tamoio, while specialties sales grew by 14% and pharmaceutical distribution sales rose by 7%. The company continued integrating recent acquisitions and expanding its market presence across multiple business segments.


