Download to read offline
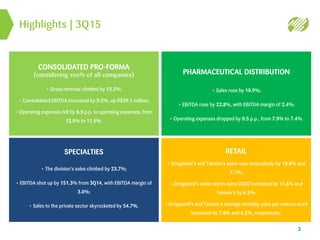
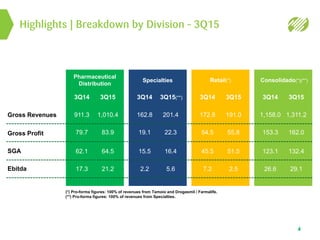

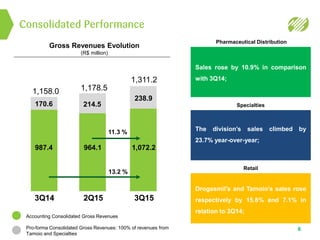
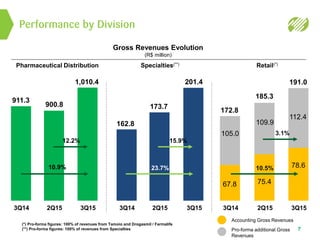
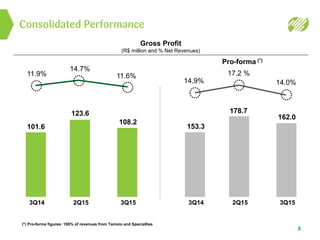
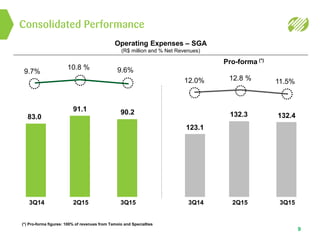
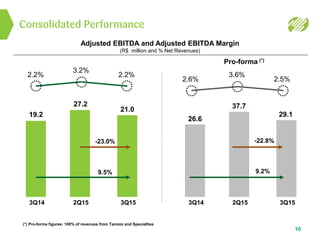
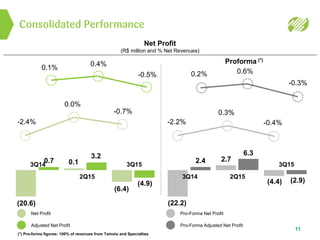
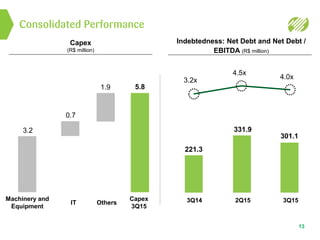

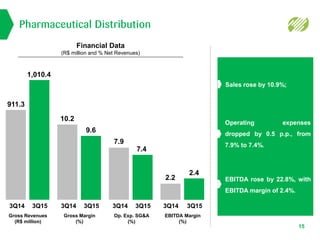

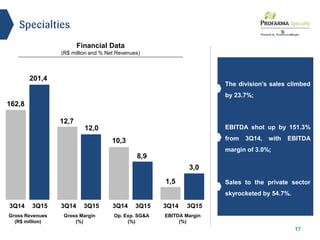
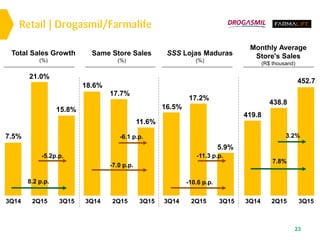


The document provides highlights and financial results for Profarma's 3Q15 earnings release. Some key points: - Gross revenue increased 13.2% year-over-year on a consolidated pro-forma basis. - Consolidated EBITDA rose 9.2% to R$29.1 million with operating expenses falling 0.5 percentage points. - The Retail division saw sales increases of 15.8% at Drogasmil and 7.1% at Tamoio, with same-store sales up 11.6% and 6.3% respectively. - Specialties division sales increased 23.7% and EBITDA rose 151.3% to R$5.


