Download to read offline


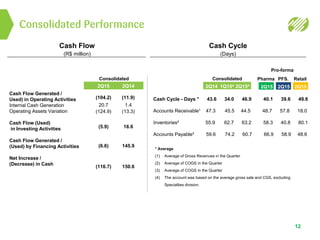


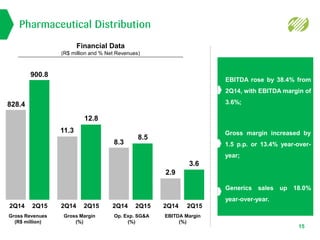


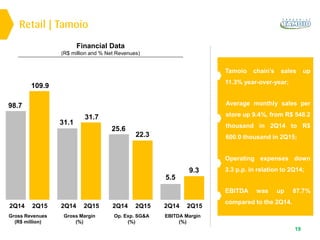
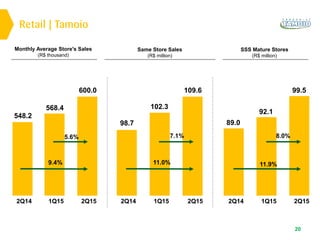
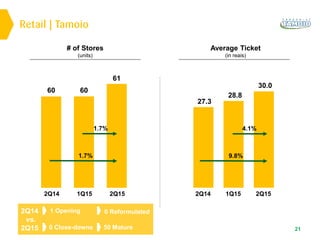
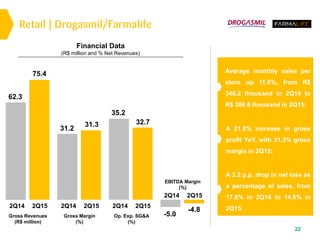


The document provides highlights from Profarma's 2Q15 earnings release. It discusses the company's consolidated performance, including a 9.6% increase in gross revenues. It also summarizes key metrics and growth for each of Profarma's divisions: Pharmaceutical Distribution, Specialties, and Retail. The Retail section specifically calls out sales increases and improvements in margins for the Tamoio and Drogasmil/Farmalife chains. The document concludes with an analyst coverage section listing analysts that follow Profarma.


