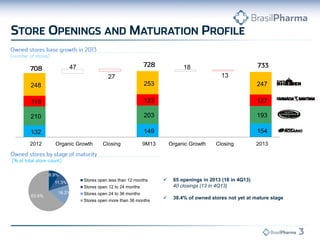
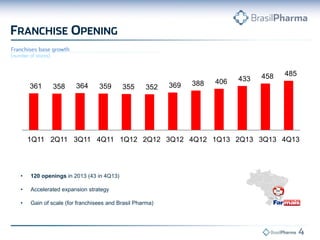
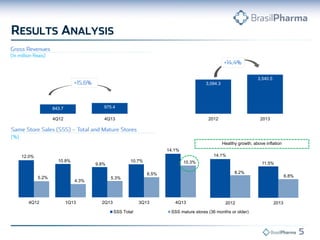
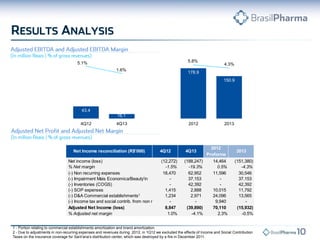
- Brasil Pharma reported gross revenues of R$3.5 billion for full year 2013, an increase of 14.4% over 2012. Gross margin was 27.9% and total same-store sales growth was 11.5%.
- Adjusted EBITDA was R$150.9 million with a margin of 4.3%. The company reported an adjusted net loss of R$15.9 million after excluding various one-time expenses.
- The company opened 65 new owned stores and 120 franchise stores in 2013, ending the year with a total of 1,218 stores across Brazil.
2. • Gross revenues of R$3.5 billion, an increase of 14.4% over 2012.
• Gross Margin of 27.9%, over gross revenues
• Total SSS of 11.5%, with 6.8% for mature stores
• Adjusted EBITDA of R$150.9 million, with adjusted EBITDA margin of 4.3%
• Adjusted net loss of R$15.9 million.
• With the opening of 65 new owned stores and 120 franchises, we ended 2013 with 1,218 stores.
Operational & Financial
4. 65 openings in 2013 (18 in 4Q13)
40 closings (13 in 4Q13)
38.4% of owned stores not yet at mature stage
132 149 154
210 203 193
118 123 127
248 253 247
47 18
27 13
2012 Organic Growth Closing 9M13 Organic Growth Closing 2013
8.9%
11.3%
16.2%
63.6%
Stores open less than 12 months
Stores open 12 to 24 months
Stores open 24 to 36 months
Stores open more than 36 months
5. • 120 openings in 2013 (43 in 4Q13)
• Accelerated expansion strategy
• Gain of scale (for franchisees and Brasil Pharma)
361 358 364 359 355 352 369 388 406 433 458 485
1Q11 2Q11 3Q11 4Q11 1Q12 2Q12 3Q12 4Q12 1Q13 2Q13 3Q13 4Q13
11. 1 - Portion relating to commercial establishments amortization and brand amortization.
2 - Due to adjustments in non-recurring expenses and revenues during 2012, in 1Q12 we excluded the effects of Income and Social Contribution
Taxes on the insurance coverage for Sant’ana’s distribution center, which was destroyed by a fire in December 2011.
43.4
16.1
178.9
150.9
5.1%
1.6%
5.8%
4.3%
4Q12 4Q13 2012 2013
2012
Proforma
Net income (loss) (12,272) (188,247) 14,464 (151,380)
% Net margin -1.5% -19.3% 0.5% -4.3%
(-) Non recurring expenses 18,470 62,952 11,596 30,546
(-) Impairment Mais Economica/Beauty'in - 37,153 - 37,153
(-) Inventories (COGS) - 42,392 - 42,392
(-) SOP expenses 1,415 2,888 10,015 11,792
(-) D&A Commercial establishments¹ 1,234 2,971 24,096 13,565
(-) Income tax and social contrib. from non recurring expenses²- - 9,940 -
Adjusted Net Income (loss) 8,847 (39,890) 70,110 (15,932)
% Adjusted net margin 1.0% -4.1% 2.3% -0.5%
Net Income reconciliation (R$'000) 4Q12 4Q13 2013
12. Cash position and indebtedness (R$'000) 3Q12 4Q12 1Q13 2Q13 3Q13 4Q13
(+) Loans and financing 149,124 177,049 169,079 160,228 247,170 209,490
Short term 43,953 83,229 44,864 41,694 150,963 124,507
Long term 105,171 93,820 124,215 118,534 96,207 84,983
(+) Debentures 260,759 253,642 258,937 253,964 260,704 549,809
Short term 12,461 5,237 10,427 5,348 11,982 15,249
Long term 248,298 248,405 248,510 248,616 248,722 534,560
(+) Accounts payable for investment acquisition 333,591 345,333 264,430 232,581 179,652 147,837
Short term 97,971 99,711 82,833 81,986 82,681 70,300
Long term 235,620 245,622 181,597 150,595 96,971 77,537
(=) Total Indebtedness 743,474 776,024 692,446 646,773 687,526 907,136
Short term (%) 20.8% 24.2% 19.9% 19.9% 35.7% 23.2%
Long term (%) 79.2% 75.8% 80.1% 80.1% 64.3% 76.8%
(-) Cash and cash equivalents (404,783) (368,751) (183,870) (162,205) (213,132) (405,914)
(=) Net Debt 338,691 407,273 508,576 484,568 474,394 501,222
Net debt/Adjusted EBITDA (LTM) 1.9 X 2.1 X 2.7 X 2.5 X 2.5 X 3.3 X
14. 1- The variation in working capital includes the change in accounts receivable, inventories and suppliers.
Cash flow Statement (R$'000) 4Q12 4Q13 2012 2013
EBT (13,330) (174,859) 13,359 (123,822)
(+) Depreciation and amortization 20,815 19,872 62,542 72,120
(+/-) Others (22,016) 72,173 32,267 58,008
Operating cash generation (14,531) (82,814) 108,168 6,306
(+/-) Change in working capital¹ 5,770 114,272 (208,285) 150,687
(+/-) Change in other assets and liabilities (26,678) (25,344) (52,139) (132,936)
Cash consumption (20,909) 88,928 (260,424) 17,751
Income Tax & Social Contribution payed 4,119 2,511 (12,406) (3,587)
Net cash generated by operating activities (31,321) 8,625 (164,662) 20,470
(-) Capex from operations (38,849) (50,405) (135,224) (155,637)
(-) Acquisitions (7,693) (15,311) (356,051) (129,604)
Net Cash from investing activities (46,542) (65,716) (491,275) (285,241)
(+/-) Loans and financing 41,344 249,873 279,957 300,964
(+/-) Equity funding / Dividends 487 - 481,176 970
Net Cash from financing activities 41,831 249,873 761,133 301,934
Change in cash and cash equivalents (36,031) 192,782 105,196 37,163
Cash and cash equivalents - opening balance 404,783 213,132 263,555 368,751
Cash and cash equivalents - closing balance 368,751 405,914 368,751 405,914
15. 5 Big acquisitions:
• Rosario Distrital
• Guararapes
• Mais Economica
• Sant’Ana
• Big Benn
Strong organic growth/market consolidation
Leadership position in 4 out 5 regions in Brazil
Financing: IPO/ 1st Debenture/ F-ON
Accelerated expansion
Centralized BackOffice (2012)
Centralized Procurement (2013)
Logistics optimization : 4 New
Distribution Centers
Systems Standardization : Start
of SAP Implementation
Brand repositioning
Stores renovation/Mix optimization
Big Ben as a separated business
unit
Focus on processes
Focus in Cash generation
WC Management
Slowdown in organic growth
Reduced investments
Optimized corporate structure
Processes’ redesign
Stores’ profitability
Mais Economica Repositioning
Harvest the benefits of
integrations done in 2012 and
2013
16. José Ricardo is our Chief Executive Officer and our
Investor Relations Officer. From December 2013 to
March 2014 he served as our Vice President of Strategy
and Finance. Before joining Brasil Pharma, José Ricardo
worked for 11 years at Aché, one of the leading
industries in the Brazilian pharmaceutical market, where
he held the position of Chief Executive Officer from 2006
to 2013
André has served as our Chief Executive Officer from
November 2009, date of the foundation of the Company,
until March 2014. He is also a partner at BTG Pactual.
Previously, he served as Chief Financial Officer of Grupo
Los Grobo and was one of the founders of PDG Realty
S.A. Empreendimentos e Participações, where he
served as a private equity officer
17. Still a separated business unit
Separated Administration
Duplicated structures/expenses
Managed by the former owner
Commercial BackOffice Operations
Integration in course:
Continuous improvement.
Synergies to be captured in
the years to come
18. BackOffice Integration (SAP schedule)
“Go live” Rosário
“Go live” Santana
“Go live” Farmais
“Go live” Mais Economica
“Go live” Big Ben/SSC Integration
Commercial/Logistics Integration
• System standardization in Rosario, Santana and Mais
Economica: logistics efficiency and better management
control
Benefits from an Integrated System
• Integrated Financing/Accounting management
• Process standardization
• Better integration capacity
• Faster and more precise information
• Higher quality information to shareholders
SIG6 Gestao Procfit Proteus