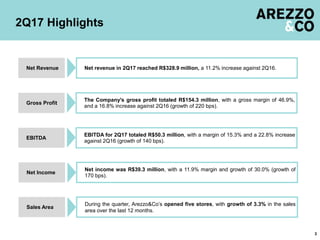
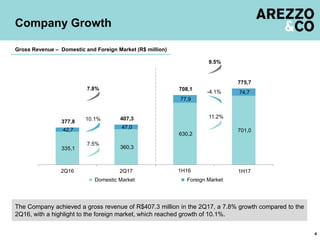
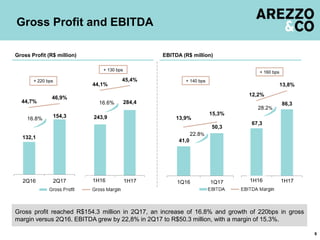
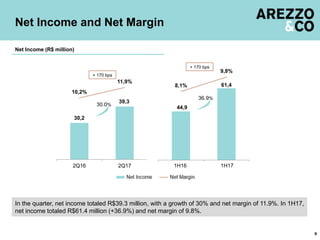
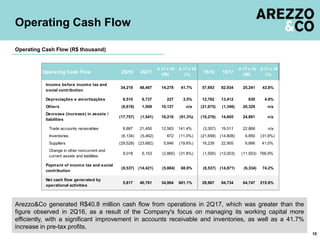
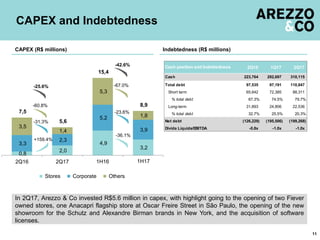
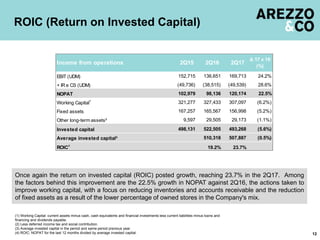
| Apresentação do Roadshow
1
Conference Call
2Q17
Important Disclaimer
Information contained in this document may include forward-looking statements and reflect Management’s
current view and estimates of the evolution of the macroeconomic environment, industry conditions, Company’s
performance and financial results. Any statements, expectations, capabilities, plans and assumptions contained
in this document, which do not describe historical facts, such as information about declaration of dividend
payment, future direction of operations, implementation of relevant operating and financial strategies,
investment program and factors or trends affecting the financial condition, liquidity or results of operations, are
forward-looking statements, as set forth in the “U.S. Private Securities Litigation Reform Act of 1995”, and
involve several risks and uncertainties. There is no guarantee that these results will occur. Forward-looking
statements are based on several factors and expectations, including economic and market conditions, industry
competitiveness and operational factors. Any changes in such expectations and factors may cause actual
results to differ from current expectations.
2
2Q17 Highlights
3
Net income was R$39.3 million, with a 11.9% margin and growth of 30.0% (growth of
170 bps).
Net Income
The Company's gross profit totaled R$154.3 million, with a gross margin of 46.9%,
and a 16.8% increase against 2Q16 (growth of 220 bps).
Gross Profit
EBITDA for 2Q17 totaled R$50.3 million, with a margin of 15.3% and a 22.8% increase
against 2Q16 (growth of 140 bps).
EBITDA
During the quarter, Arezzo&Co’s opened five stores, with growth of 3.3% in the sales
area over the last 12 months.
Sales Area
Net revenue in 2Q17 reached R$328.9 million, a 11.2% increase against 2Q16.Net Revenue
335,1 360,3
630,2
701,042,7
47,0
77,9
74,7
377,8
407,3
708,1
775,7
2Q16 2Q17 1S16 1S17
Domestic Market Foreign Market
The Company achieved a gross revenue of R$407.3 million in the 2Q17, a 7.8% growth compared to the
2Q16, with a highlight to the foreign market, which reached growth of 10.1%.
Company Growth
4
Gross Revenue – Domestic and Foreign Market (R$ million)
7.5%
10.1%
7.8%
11.2%
-4.1%
9.5%
1H16 H1H17
189,2 199,8
364,9 399,2
118,4 119,7
212,6
218,1
23,6 31,9
46,2
65,6
335,1
360,3
630,2
701,0
2Q16 2Q17 1S16 1S17
Arezzo Schutz Anacapri Others¹
H
Gross Revenue Breakdown by Brand – Domestic Market (R$ million)
11.2%
5
Gross Revenue Breakdown by Brand –
Domestic Market
9.4%
2.6%
42.1%
In 2Q17 and 1H17, all brands experienced growth, highlighting Anacapri brand with growth of 34.9% and
42.1% respectively.
7.5%
5.6%
1.2%
34.9%
1) Others: Increase of 128.3% in 2Q17 and 180.2% in 1H17 (includes only domestic markets for Alexandre Birman and Fiever brands and other revenues).
H1H16 1H17
159,5 162,9
308,9 336,1
75,7 76,7
135,6
139,3
75,2 87,6
135,7
165,6
24,3 32,5
48,8
57,8
335,1
360,3
630,2
701,0
2Q16 2Q17 1S16 1S17
Franchise Owned Stores Multi-brands Web Commerce Others
In 2Q17, all channels experienced growth, highlighting an increase of 33.6% (18.4 in 1H17) in the Web
Commerce channel and a growth in Multi-brands channel of 16.6% (22% in 1H17).
Gross Revenue Breakdown by Channel –
Domestic Market
6
Gross Revenues by channel – Domestic Market (R$ million)
SSS Sell-out (Owned Stores +
franchises)
2.5%
1.9%SSS Sell-in (franchises)
5.3%
-0.8%
8.8%
2.7%
11.2%
22.0%
18.4%
SSS Sell-out (Owned Stores + web
+ franchises)
2.6% 6.8%
1) Others : Increase of 37.1% in 2Q17 and 104% in 1H17 (includes domestic market revenues that are not specific for distribution channels).
1
-0.6%
0.3%
-0.4%
4.1%
6.2%
4.9%
2.1%
1.3%
7.5%
16.6%
33.6%
H H1H16 1H17
During the quarter, Arezzo&Co’s opened five stores, with growth of 3.3% in the sales area over the last
12 months.
Distribution Channel Expansion
7
Owned Stores and Franchises Expansion1
1Includes eight outlet type stores with a total area of 1,809 m² and stores overseas.
Number of Stores – Domestic Market 2Q17
Franchises
Multibrand
Owned Stores
61
22
1,188
Multibrand
Owned Stores 3
17
Franchises 83
Multibrand
Owned Stores 4
1,139
Franchises
Multibrand
Owned Stores
369
14
1,120
Owned Stores 4
0,1%
+18
-3
3,0%
+3
0,8%
+3
Multibrand 248
-2
-1
-0,5%
+1
+4
494 497 515 514 518
50 47
50 48 49
37,7 37,7 38,8 38,6 38,6
-
100
200
300
400
500
600
700
2Q16 3Q16 4Q16 1Q17 2Q17
Franchises Owned Stores¹ Area (000 M²)
67,3
86,3
12,2%
13,8%
20,0
30,0
40,0
50,0
60,0
70,0
80,0
90,0
100,0
1S16 1S17
0,0%
2,0%
4,0%
6,0%
8,0%
10,0%
12,0%
41,0
50,3
13,9%
15,3%
20,0
25,0
30,0
35,0
40,0
45,0
50,0
55,0
60,0
65,0
1Q16 1Q17
0,0%
2,0%
4,0%
6,0%
8,0%
10,0%
12,0%
14,0%
16,0%
18,0%
243,9
284,4
44,1%
45,4%
100,0
150,0
200,0
250,0
300,0
350,0
1S16 1S17
5,0%
10,0%
15,0%
20,0%
25,0%
30,0%
35,0%
40,0%
45,0%
132,1
154,3
44,7%
46,9%
00,0
10,0
20,0
30,0
40,0
50,0
60,0
70,0
2Q16 2Q17
5,0%
10,0%
15,0%
20,0%
25,0%
30,0%
35,0%
40,0%
45,0%
Gross profit reached R$154.3 million in 2Q17, an increase of 16.8% and growth of 220bps in gross
margin versus 2Q16. EBITDA grew by 22,8% in 2Q17 to R$50.3 million, with a margin of 15.3%.
Gross Profit and EBITDA
8
Gross Profit (R$ million) EBITDA (R$ million)
16.6%
28.2%
+ 140 bps+ 220 bps
+ 130 bps
16.8%
22.8%
+ 160 bps
H H H H1H16 1H17 1H16 1H17
30,2
39,3
10,2%
11,9%
10,0
15,0
20,0
25,0
30,0
35,0
40,0
45,0
50,0
2Q16 2Q17
0,0%
2,0%
4,0%
6,0%
8,0%
10,0%
12,0%
44,9
61,48,1%
9,8%
10,0
20,0
30,0
40,0
50,0
60,0
70,0
1S16 1S17
0,0%
1,0%
2,0%
3,0%
4,0%
5,0%
6,0%
7,0%
8,0%
9,0%
In the quarter, net income totaled R$39.3 million, with a growth of 30% and net margin of 11.9%. In 1H17,
net income totaled R$61.4 million (+36.9%) and net margin of 9.8%.
Net Income and Net Margin
9
Net Income (R$ million)
30.0%
+ 170 bps
+ 170 bps
36.9%
H H1H16 1H17
Operating Cash Flow
10
Arezzo&Co generated R$40.8 million cash flow from operations in 2Q17, which was greater than the
figure observed in 2Q16, as a result of the Company's focus on managing its working capital more
efficiently, with a significant improvement in accounts receivable and inventories, as well as a 41.7%
increase in pre-tax profits.
Operating Cash Flow (R$ thousand)
Operating Cash Flow 2Q16 2Q17
Δ 17 x 16
(R$)
Δ 17 x 16
(%)
1S16 1S17
Δ 17 x 16
(R$)
Δ 17 x 16
(%)
34,219 48,497 14,278 41.7% 57,693 82,934 25,241 43.8%
6,510 6,737 227 3.5% 12,782 13,412 630 4.9%
(8,618) 1,509 10,127 n/a (21,675) (1,346) 20,329 n/a
(17,757) (1,541) 16,216 (91.3%) (10,276) 14,605 24,881 n/a
8,887 21,450 12,563 141.4% (3,357) 19,511 22,868 n/a
(6,134) (5,462) 672 (11.0%) (21,658) (14,808) 6,850 (31.6%)
(29,528) (23,682) 5,846 (19.8%) 16,239 22,905 6,666 41.0%
9,018 6,153 (2,865) (31.8%) (1,500) (13,003) (11,503) 766.9%
(8,537) (14,421) (5,884) 68.9% (8,537) (14,871) (6,334) 74.2%
5,817 40,781 34,964 601.1% 29,987 94,734 64,747 215.9%
Income before income tax and
social contribution
Depreciações e amortizações
Others
Payment of income tax and social
contribution
Net cash flow generated by
operational activities
Decrease (increase) in assets /
liabilities
Trade accounts receivables
Inventories
Suppliers
Change in other noncurrent and
current assets and liabilities
In 2Q17, Arezzo & Co invested R$5.6 million in capex, with highlight going to the opening of two Fiever
owned stores, one Anacapri flagship store at Oscar Freire Street in São Paulo, the opening of the new
showroom for the Schutz and Alexandre Birman brands in New York, and the acquisition of software
licenses.
CAPEX and Indebtedness
11
CAPEX (R$ millions) Indebtedness (R$ millions)
+159.4%
-31.3%
-25.6%
-60.8%
-36.1%
-23.6%
-42.6%
-67.0%
2Q16 1Q17 2Q17
223,764 292,697 310,115
Total debt 97,535 97,191 110,847
Short term 65,642 72,385 88,311
% total debt 67.3% 74.5% 79.7%
Long-term 31,893 24,806 22,536
% total debt 32.7% 25.5% 20.3%
Net debt (126,229) (195,506) (199,268)
Dívida Líquida/EBITDA -0.8x -1.0x -1.0x
Cash position and Indebtedness
Cash
0,8
2,0
4,9
3,2
3,3
2,3
5,2
3,9
3,5
1,4
5,3
1,8
7,5
5,6
15,4
8,9
2Q16 2Q17 1S16 1S17
Stores Corporate Others
H H1H16 1H17
Once again the return on invested capital (ROIC) posted growth, reaching 23.7% in the 2Q17. Among
the factors behind this improvement are the 22.5% growth in NOPAT against 2Q16, the actions taken to
improve working capital, with a focus on reducing inventories and accounts receivable and the reduction
of fixed assets as a result of the lower percentage of owned stores in the Company's mix.
ROIC (Return on Invested Capital)
12
(1) Working Capital: current assets minus cash, cash equivalents and financial investments less current liabilities minus loans and
financing and dividends payable.
(2) Less deferred income tax and social contribution.
(3) Average invested capital in the period and same period previous year.
(4) ROIC: NOPAT for the last 12 months divided by average invested capital.
2Q15 2Q16 2Q17
Δ 17 x 16
(%)
152,715 136,651 169,713 24.2%
(49,736) (38,515) (49,539) 28.6%
102,979 98,136 120,174 22.5%
321,277 327,433 307,097 (6.2%)
167,257 165,567 156,998 (5.2%)
9,597 29,505 29,173 (1.1%)
498,131 522,505 493,268 (5.6%)
510,318 507,887 (0.5%)
19.2% 23.7%
Invested capital
Average invested capital³
ROIC4
Working Capital1
Other long-term assets²
EBIT (UDM)
+ IR e CS (UDM)
NOPAT
Fixed assets
Income from operations
Contacts
Telephone: +55 11 2132-4300
ri@arezzoco.com.br
www.arezzoco.com.br
Daniel Levy
CFO and IR Officer
Aline Penna
IR Manager
Victoria Machado
IR Analyst
13
Guilherme de Biagi
IR Coordinator

2Q17

  • 1.
    | Apresentação doRoadshow 1 Conference Call 2Q17
  • 2.
    Important Disclaimer Information containedin this document may include forward-looking statements and reflect Management’s current view and estimates of the evolution of the macroeconomic environment, industry conditions, Company’s performance and financial results. Any statements, expectations, capabilities, plans and assumptions contained in this document, which do not describe historical facts, such as information about declaration of dividend payment, future direction of operations, implementation of relevant operating and financial strategies, investment program and factors or trends affecting the financial condition, liquidity or results of operations, are forward-looking statements, as set forth in the “U.S. Private Securities Litigation Reform Act of 1995”, and involve several risks and uncertainties. There is no guarantee that these results will occur. Forward-looking statements are based on several factors and expectations, including economic and market conditions, industry competitiveness and operational factors. Any changes in such expectations and factors may cause actual results to differ from current expectations. 2
  • 3.
    2Q17 Highlights 3 Net incomewas R$39.3 million, with a 11.9% margin and growth of 30.0% (growth of 170 bps). Net Income The Company's gross profit totaled R$154.3 million, with a gross margin of 46.9%, and a 16.8% increase against 2Q16 (growth of 220 bps). Gross Profit EBITDA for 2Q17 totaled R$50.3 million, with a margin of 15.3% and a 22.8% increase against 2Q16 (growth of 140 bps). EBITDA During the quarter, Arezzo&Co’s opened five stores, with growth of 3.3% in the sales area over the last 12 months. Sales Area Net revenue in 2Q17 reached R$328.9 million, a 11.2% increase against 2Q16.Net Revenue
  • 4.
    335,1 360,3 630,2 701,042,7 47,0 77,9 74,7 377,8 407,3 708,1 775,7 2Q16 2Q171S16 1S17 Domestic Market Foreign Market The Company achieved a gross revenue of R$407.3 million in the 2Q17, a 7.8% growth compared to the 2Q16, with a highlight to the foreign market, which reached growth of 10.1%. Company Growth 4 Gross Revenue – Domestic and Foreign Market (R$ million) 7.5% 10.1% 7.8% 11.2% -4.1% 9.5% 1H16 H1H17
  • 5.
    189,2 199,8 364,9 399,2 118,4119,7 212,6 218,1 23,6 31,9 46,2 65,6 335,1 360,3 630,2 701,0 2Q16 2Q17 1S16 1S17 Arezzo Schutz Anacapri Others¹ H Gross Revenue Breakdown by Brand – Domestic Market (R$ million) 11.2% 5 Gross Revenue Breakdown by Brand – Domestic Market 9.4% 2.6% 42.1% In 2Q17 and 1H17, all brands experienced growth, highlighting Anacapri brand with growth of 34.9% and 42.1% respectively. 7.5% 5.6% 1.2% 34.9% 1) Others: Increase of 128.3% in 2Q17 and 180.2% in 1H17 (includes only domestic markets for Alexandre Birman and Fiever brands and other revenues). H1H16 1H17
  • 6.
    159,5 162,9 308,9 336,1 75,776,7 135,6 139,3 75,2 87,6 135,7 165,6 24,3 32,5 48,8 57,8 335,1 360,3 630,2 701,0 2Q16 2Q17 1S16 1S17 Franchise Owned Stores Multi-brands Web Commerce Others In 2Q17, all channels experienced growth, highlighting an increase of 33.6% (18.4 in 1H17) in the Web Commerce channel and a growth in Multi-brands channel of 16.6% (22% in 1H17). Gross Revenue Breakdown by Channel – Domestic Market 6 Gross Revenues by channel – Domestic Market (R$ million) SSS Sell-out (Owned Stores + franchises) 2.5% 1.9%SSS Sell-in (franchises) 5.3% -0.8% 8.8% 2.7% 11.2% 22.0% 18.4% SSS Sell-out (Owned Stores + web + franchises) 2.6% 6.8% 1) Others : Increase of 37.1% in 2Q17 and 104% in 1H17 (includes domestic market revenues that are not specific for distribution channels). 1 -0.6% 0.3% -0.4% 4.1% 6.2% 4.9% 2.1% 1.3% 7.5% 16.6% 33.6% H H1H16 1H17
  • 7.
    During the quarter,Arezzo&Co’s opened five stores, with growth of 3.3% in the sales area over the last 12 months. Distribution Channel Expansion 7 Owned Stores and Franchises Expansion1 1Includes eight outlet type stores with a total area of 1,809 m² and stores overseas. Number of Stores – Domestic Market 2Q17 Franchises Multibrand Owned Stores 61 22 1,188 Multibrand Owned Stores 3 17 Franchises 83 Multibrand Owned Stores 4 1,139 Franchises Multibrand Owned Stores 369 14 1,120 Owned Stores 4 0,1% +18 -3 3,0% +3 0,8% +3 Multibrand 248 -2 -1 -0,5% +1 +4 494 497 515 514 518 50 47 50 48 49 37,7 37,7 38,8 38,6 38,6 - 100 200 300 400 500 600 700 2Q16 3Q16 4Q16 1Q17 2Q17 Franchises Owned Stores¹ Area (000 M²)
  • 8.
    67,3 86,3 12,2% 13,8% 20,0 30,0 40,0 50,0 60,0 70,0 80,0 90,0 100,0 1S16 1S17 0,0% 2,0% 4,0% 6,0% 8,0% 10,0% 12,0% 41,0 50,3 13,9% 15,3% 20,0 25,0 30,0 35,0 40,0 45,0 50,0 55,0 60,0 65,0 1Q16 1Q17 0,0% 2,0% 4,0% 6,0% 8,0% 10,0% 12,0% 14,0% 16,0% 18,0% 243,9 284,4 44,1% 45,4% 100,0 150,0 200,0 250,0 300,0 350,0 1S161S17 5,0% 10,0% 15,0% 20,0% 25,0% 30,0% 35,0% 40,0% 45,0% 132,1 154,3 44,7% 46,9% 00,0 10,0 20,0 30,0 40,0 50,0 60,0 70,0 2Q16 2Q17 5,0% 10,0% 15,0% 20,0% 25,0% 30,0% 35,0% 40,0% 45,0% Gross profit reached R$154.3 million in 2Q17, an increase of 16.8% and growth of 220bps in gross margin versus 2Q16. EBITDA grew by 22,8% in 2Q17 to R$50.3 million, with a margin of 15.3%. Gross Profit and EBITDA 8 Gross Profit (R$ million) EBITDA (R$ million) 16.6% 28.2% + 140 bps+ 220 bps + 130 bps 16.8% 22.8% + 160 bps H H H H1H16 1H17 1H16 1H17
  • 9.
    30,2 39,3 10,2% 11,9% 10,0 15,0 20,0 25,0 30,0 35,0 40,0 45,0 50,0 2Q16 2Q17 0,0% 2,0% 4,0% 6,0% 8,0% 10,0% 12,0% 44,9 61,48,1% 9,8% 10,0 20,0 30,0 40,0 50,0 60,0 70,0 1S16 1S17 0,0% 1,0% 2,0% 3,0% 4,0% 5,0% 6,0% 7,0% 8,0% 9,0% Inthe quarter, net income totaled R$39.3 million, with a growth of 30% and net margin of 11.9%. In 1H17, net income totaled R$61.4 million (+36.9%) and net margin of 9.8%. Net Income and Net Margin 9 Net Income (R$ million) 30.0% + 170 bps + 170 bps 36.9% H H1H16 1H17
  • 10.
    Operating Cash Flow 10 Arezzo&Cogenerated R$40.8 million cash flow from operations in 2Q17, which was greater than the figure observed in 2Q16, as a result of the Company's focus on managing its working capital more efficiently, with a significant improvement in accounts receivable and inventories, as well as a 41.7% increase in pre-tax profits. Operating Cash Flow (R$ thousand) Operating Cash Flow 2Q16 2Q17 Δ 17 x 16 (R$) Δ 17 x 16 (%) 1S16 1S17 Δ 17 x 16 (R$) Δ 17 x 16 (%) 34,219 48,497 14,278 41.7% 57,693 82,934 25,241 43.8% 6,510 6,737 227 3.5% 12,782 13,412 630 4.9% (8,618) 1,509 10,127 n/a (21,675) (1,346) 20,329 n/a (17,757) (1,541) 16,216 (91.3%) (10,276) 14,605 24,881 n/a 8,887 21,450 12,563 141.4% (3,357) 19,511 22,868 n/a (6,134) (5,462) 672 (11.0%) (21,658) (14,808) 6,850 (31.6%) (29,528) (23,682) 5,846 (19.8%) 16,239 22,905 6,666 41.0% 9,018 6,153 (2,865) (31.8%) (1,500) (13,003) (11,503) 766.9% (8,537) (14,421) (5,884) 68.9% (8,537) (14,871) (6,334) 74.2% 5,817 40,781 34,964 601.1% 29,987 94,734 64,747 215.9% Income before income tax and social contribution Depreciações e amortizações Others Payment of income tax and social contribution Net cash flow generated by operational activities Decrease (increase) in assets / liabilities Trade accounts receivables Inventories Suppliers Change in other noncurrent and current assets and liabilities
  • 11.
    In 2Q17, Arezzo& Co invested R$5.6 million in capex, with highlight going to the opening of two Fiever owned stores, one Anacapri flagship store at Oscar Freire Street in São Paulo, the opening of the new showroom for the Schutz and Alexandre Birman brands in New York, and the acquisition of software licenses. CAPEX and Indebtedness 11 CAPEX (R$ millions) Indebtedness (R$ millions) +159.4% -31.3% -25.6% -60.8% -36.1% -23.6% -42.6% -67.0% 2Q16 1Q17 2Q17 223,764 292,697 310,115 Total debt 97,535 97,191 110,847 Short term 65,642 72,385 88,311 % total debt 67.3% 74.5% 79.7% Long-term 31,893 24,806 22,536 % total debt 32.7% 25.5% 20.3% Net debt (126,229) (195,506) (199,268) Dívida Líquida/EBITDA -0.8x -1.0x -1.0x Cash position and Indebtedness Cash 0,8 2,0 4,9 3,2 3,3 2,3 5,2 3,9 3,5 1,4 5,3 1,8 7,5 5,6 15,4 8,9 2Q16 2Q17 1S16 1S17 Stores Corporate Others H H1H16 1H17
  • 12.
    Once again thereturn on invested capital (ROIC) posted growth, reaching 23.7% in the 2Q17. Among the factors behind this improvement are the 22.5% growth in NOPAT against 2Q16, the actions taken to improve working capital, with a focus on reducing inventories and accounts receivable and the reduction of fixed assets as a result of the lower percentage of owned stores in the Company's mix. ROIC (Return on Invested Capital) 12 (1) Working Capital: current assets minus cash, cash equivalents and financial investments less current liabilities minus loans and financing and dividends payable. (2) Less deferred income tax and social contribution. (3) Average invested capital in the period and same period previous year. (4) ROIC: NOPAT for the last 12 months divided by average invested capital. 2Q15 2Q16 2Q17 Δ 17 x 16 (%) 152,715 136,651 169,713 24.2% (49,736) (38,515) (49,539) 28.6% 102,979 98,136 120,174 22.5% 321,277 327,433 307,097 (6.2%) 167,257 165,567 156,998 (5.2%) 9,597 29,505 29,173 (1.1%) 498,131 522,505 493,268 (5.6%) 510,318 507,887 (0.5%) 19.2% 23.7% Invested capital Average invested capital³ ROIC4 Working Capital1 Other long-term assets² EBIT (UDM) + IR e CS (UDM) NOPAT Fixed assets Income from operations
  • 13.
    Contacts Telephone: +55 112132-4300 ri@arezzoco.com.br www.arezzoco.com.br Daniel Levy CFO and IR Officer Aline Penna IR Manager Victoria Machado IR Analyst 13 Guilherme de Biagi IR Coordinator