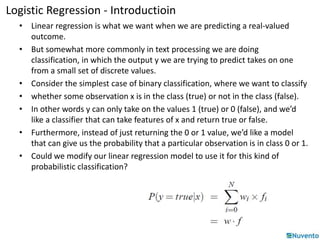
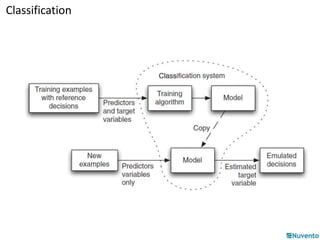
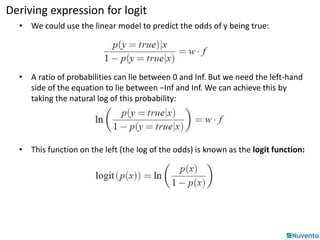
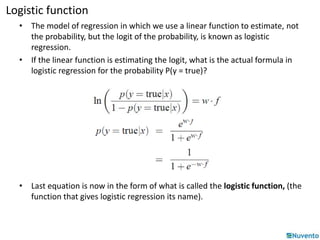
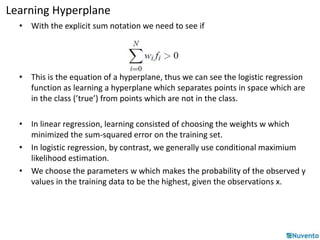
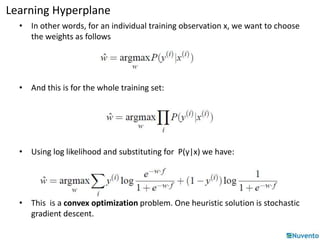
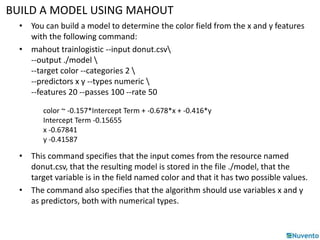
SlideShare a Scribd company logo
Logistic Regression using Stochastic Gradient Descent
Regression 
• In statistics we use two different names for tasks that map some 
input features into some output value; we use the word 
regression when the output is real-valued, and classification 
when the output is one of a discrete set of classes. 
• Example: 
– Levitt and Dubner (2005) showed that the words used in a real estate ad 
can be used as a good predictor of whether a house will sell for more or 
less than its asking price. 
– They showed, for example, that houses whose real estate ads had words 
like fantastic, cute, or charming, tended to sell for lower prices 
– while houses whose ads had words like maple and granite tended to sell 
for higher prices. 
– Their hypothesis was that real estate agents used vague positive words 
like fantastic to mask the lack of any specific positive qualities in the 
house.
Example 
• Following figure shows a graph, with the feature (# of 
adjectives) on the 
• REGRESSION LINE x-axis, and the price on the y-axis. 
• We have also plotted a regression line, which is the line that 
best fits the observed data. 
• The equation of any line is y = mx+b; 
• as we see on the graph, the slope of this line is m = −4900, while 
the intercept is 16550.
Example 
• We can think of these two parameters of this line (slope m and intercept b) 
as a set of weights that we use to map from our features (in this case x, 
numbers of adjectives) to our output value y (in this case price). 
• We can represent this linear function using w to refer to weights as follows: 
• price = w0 + w1 * (Num Adjectives) 
• This model then gives us a linear function that lets us estimate the sales 
price for any number of these adjectives. 
• For example, how much would we expect a house whose ad has 5 adjectives 
to sell for?
Linear Regression 
• The true power of linear models comes when we use more than one feature 
• (technically we call this multiple linear regression). 
• For example, the final house price probably depends on many factors such 
as the 
– average mortgage rate that month, 
– the number of unsold houses on the market, and many other such factors. 
• We could encode each of these as a variable, and the importance of each 
factor would be the weight on that variable, as follows: 
• price=w0 + w1 * (Num Adjectives) + w2 * (Mortgage Rate) + w3 * (Num 
Unsold Houses)
Example 
• We represent each observation (each house for sale) by a vector of these 
features. 
• Suppose a house has 1 adjective in its ad, and the mortgage rate was 6.5 and 
there were 10,000 unsold houses in the city. 
• The feature vector for the house would be f = (20000,6.5,10000). 
• Suppose the weight vector that we had previously learned for this task was 
w = (w0,w1,w2,w3) = (18000,−5000,−3000,−1.8). 
• Then the predicted value for this house would be computed by multiplying 
each feature by its weight:
Dot Product 
• Taking two vectors and creating a scalar by multiplying each element in a 
pair DOT PRODUCT wise fashion and summing the results is called the dot 
product. 
• Recall that the dot product a · b between two vectors a and b is defined as:
Learning in linear regression 
• How do we learn the weights for linear regression? 
• Intuitively we’d like to choose weights that make the estimated values y as 
close as possible to the actual values that we saw in the training set. 
• Consider a particular instance x(j) from the training set, with has an observed 
label in the training set y(j) 
obs. 
• Our linear regression model predicts a value for y(j) as follows: 
• We’d like to choose the whole set of weights W so as to minimize the 
difference between the predicted value y(j) 
pred and the observed value y(j) 
obs, 
and we want this difference minimized over all the M examples in our 
training set.
Sum-squared error 
• Actually we want to minimize the absolute value of the 
difference (since we don’t want a negative distance in 
one example to cancel out a positive difference in 
another example), so for simplicity (and 
differentiability) we minimize the square of the 
difference. 
• Thus the total value we want to minimize, which we 
call the sum-squared error, is this cost function of the 
current set of weights W:
Minimizing Sum-squared error 
• Briefly, it turns out that if we put the entire training set 
into a single matrix X with each row in the matrix 
consisting of the vector of features associated with 
each observation x(j) 
• And put all the observed y values in a vector y, that 
there is a closed-form formula for the optimal weight 
values W which will minimize cost(W):
Logistic Regression - Introductioin 
• Linear regression is what we want when we are predicting a real-valued 
outcome. 
• But somewhat more commonly in text processing we are doing 
classification, in which the output y we are trying to predict takes on one 
from a small set of discrete values. 
• Consider the simplest case of binary classification, where we want to classify 
• whether some observation x is in the class (true) or not in the class (false). 
• In other words y can only take on the values 1 (true) or 0 (false), and we’d 
like a classifier that can take features of x and return true or false. 
• Furthermore, instead of just returning the 0 or 1 value, we’d like a model 
that can give us the probability that a particular observation is in class 0 or 1. 
• Could we modify our linear regression model to use it for this kind of 
probabilistic classification?
Classification
Deriving expression for logit 
• We could train such a model by assigning each training 
observation the target value y = 1 if it was in the class (true) and 
the target value y = 0 if it was not (false). 
• Each observation x would have a feature vector f , and we 
would train the weight vector w to minimize the predictive 
error from 1 (for observations in the class) or 0 (for 
observations not in the class). 
• After training, we would compute the probability of a class 
given an observation by just taking the dot product of the 
weight vector with the features for that observation. 
• The problem with this model is that there is nothing to force the 
output to be a legal probability, i.e. to lie between zero and 1. 
• How can we fix this problem?
Deriving expression for logit 
• We could use the linear model to predict the odds of y being true: 
• A ratio of probabilities can lie between 0 and Inf. But we need the left-hand 
side of the equation to lie between −Inf and Inf. We can achieve this by 
taking the natural log of this probability: 
• This function on the left (the log of the odds) is known as the logit function:
Logistic function 
• The model of regression in which we use a linear function to estimate, not 
the probability, but the logit of the probability, is known as logistic 
regression. 
• If the linear function is estimating the logit, what is the actual formula in 
logistic regression for the probability P(y = true)? 
• Last equation is now in the form of what is called the logistic function, (the 
function that gives logistic regression its name).
Logistic regression 
• Given a particular observation, how do we decide which of the two classes 
(‘true’ or ‘false’) it belongs to? 
• Recall, 
• Using this 
• Thus in order to decide if an observation is a member of the class we just 
need to compute the linear function, and see if its value is positive
Learning Hyperplane 
• With the explicit sum notation we need to see if 
• This is the equation of a hyperplane, thus we can see the logistic regression 
function as learning a hyperplane which separates points in space which are 
in the class (’true’) from points which are not in the class. 
• In linear regression, learning consisted of choosing the weights w which 
minimized the sum-squared error on the training set. 
• In logistic regression, by contrast, we generally use conditional maximium 
likelihood estimation. 
• We choose the parameters w which makes the probability of the observed y 
values in the training data to be the highest, given the observations x.
Learning Hyperplane 
• In other words, for an individual training observation x, we want to choose 
the weights as follows 
• And this is for the whole training set: 
• Using log likelihood and substituting for P(y|x) we have: 
• This is a convex optimization problem. One heuristic solution is stochastic 
gradient descent.
Logistic regression using Mahout 
• Suppose you’re in search of filled shapes—color-fill is your target variable. 
• What features will best serve as predictor variables for this problem? 
• For a classification problem, 
you must select categories 
for your target variable, 
which in this case is color-fill. 
• Color-fill is clearly categorical 
with two possible values that 
you could label filled and unfilled. 
• Now you must select the features 
for use as predictor variables. 
• What features can you describe 
appropriately? 
• Color-fill is out (it’s the target 
variable) but you can use position 
or shape as variables. You could describe position by the x and y coordinates.
Choosing features 
• As you design your classification system, you’ll select those features that 
your experience suggests are most likely 
to be effective, and the accuracy of your 
model will tell you if you have chosen 
wisely.
Logistic regression using Mahout 
• $ mahout 
– cat : Print a file or resource as the logistic regression models would see it 
– runlogistic : Run a logistic regression model against CSV data 
– trainlogistic : Train a logistic regression using stochastic gradient descent 
• To help you get started with classification, Mahout includes several data sets 
as resources in the JAR file that contains the example programs. 
• $mahout cat donut.csv
$mahout cat donut.csv
BUILD A MODEL USING MAHOUT 
• You can build a model to determine the color field from the x and y features 
with the following command: 
• mahout trainlogistic --input donut.csv 
--output ./model  
--target color --categories 2  
--predictors x y --types numeric  
--features 20 --passes 100 --rate 50 
color ~ -0.157*Intercept Term + -0.678*x + -0.416*y 
Intercept Term -0.15655 
x -0.67841 
y -0.41587 
• This command specifies that the input comes from the resource named 
donut.csv, that the resulting model is stored in the file ./model, that the 
target variable is in the field named color and that it has two possible values. 
• The command also specifies that the algorithm should use variables x and y 
as predictors, both with numerical types.
Evaluating a model 
• Now that you have trained your first classification model, you need to 
determine how well it’s performing the task of estimating color-fill 
condition. 
• Remember that this problem has the filled points completely surrounded by 
unfilled points, which makes it impossible for a simple model, such as is 
produced by the SGD algorithm using only x and y coordinates, to classify 
points accurately. 
• Indeed, the linear equation underlying this model can only produce a 
negative value, which, in the context of logistic regression, is guaranteed to 
never produce a score greater than 0.5. 
• As we shall see, this first model isn’t very useful. 
• mahout runlogistic --input donut.csv --model ./model  
--auc --confusion
Evaluating a model 
• The output here contains two values of particular interest. First, the AUC 
value (an acronym for area under the curve—a widely used measure of 
model quality) has a value of 0.57. 
• AUC can range from 0 for a perfectly perverse model that’s always exactly 
wrong to 0.5 for a model that’s no better than random to 1.0 for a model 
that’s perfect. 
• The value here of 0.57 indicates a model that’s hardly better than random. 
• To understand why this model performs so poorly, you can look to a 
confusion matrix for a clue. 
• A confusion matrix is a table that compares actual results with desired 
results. 
• All examples at the default score threshold of 0.5 are classified as being 
unfilled. 
• This allows the classifier to be correct two-thirds of the time (27 out of 40 
times)
A better model 
• mahout trainlogistic --input donut.csv --output model  
--target color --categories 2  
--predictors x y a b c --types numeric  
--features 20 --passes 100 --rate 50 
• Evaluate: mahout runlogistic --input donut.csv --model ./model  
--auc –confusion 
• You can run this same model on additional data in the donut-test.csv 
resource: mahout runlogistic --input donut-test.csv --model ./model  
--auc –confusion 
• 2 unfilled points that were marked as filled by the model (false positives), 
and 3 filled points that were marked by the model as unfilled (false 
negatives). Clearly the use of the additional variables, notably the inclusion 
of c, has helped the model substantially, but there are still a few issues. 
• Try other models
End of session 
Day – 4: Logistic Regression using Stochastic Gradient Descent

More Related Content

What's hot

Machine learning
Machine learningMachine learning
Machine learning
Sukhwinder Singh
 
A Maximum Entropy Approach to the Loss Data Aggregation Problem
A Maximum Entropy Approach to the Loss Data Aggregation ProblemA Maximum Entropy Approach to the Loss Data Aggregation Problem
A Maximum Entropy Approach to the Loss Data Aggregation Problem
Erika G. G.
 
Beginners Guide to Non-Negative Matrix Factorization
Beginners Guide to Non-Negative Matrix FactorizationBeginners Guide to Non-Negative Matrix Factorization
Beginners Guide to Non-Negative Matrix Factorization
Benjamin Bengfort
 
Presentation on machine learning
Presentation on machine learningPresentation on machine learning
Logistic regression in Machine Learning
Logistic regression in Machine LearningLogistic regression in Machine Learning
Logistic regression in Machine Learning
Kuppusamy P
 
Semi-Supervised Regression using Cluster Ensemble
Semi-Supervised Regression using Cluster EnsembleSemi-Supervised Regression using Cluster Ensemble
Semi-Supervised Regression using Cluster Ensemble
Alexander Litvinenko
 
6 logistic regression classification algo
6 logistic regression   classification algo6 logistic regression   classification algo
6 logistic regression classification algo
TanmayVijay1
 
Probability And Random Variable Lecture(5)
Probability And Random Variable Lecture(5)Probability And Random Variable Lecture(5)
Probability And Random Variable Lecture(5)
University of Gujrat, Pakistan
 
MS CS - Selecting Machine Learning Algorithm
MS CS - Selecting Machine Learning AlgorithmMS CS - Selecting Machine Learning Algorithm
MS CS - Selecting Machine Learning Algorithm
Kaniska Mandal
 
Multiattribute Decision Making
Multiattribute Decision MakingMultiattribute Decision Making
Multiattribute Decision Making
Arthur Charpentier
 
Lecture2 xing
Lecture2 xingLecture2 xing
Lecture2 xing
Tianlu Wang
 
23 Machine Learning Feature Generation
23 Machine Learning Feature Generation23 Machine Learning Feature Generation
23 Machine Learning Feature Generation
Andres Mendez-Vazquez
 
t-tests in R - Lab slides for UGA course FANR 6750
t-tests in R - Lab slides for UGA course FANR 6750t-tests in R - Lab slides for UGA course FANR 6750
t-tests in R - Lab slides for UGA course FANR 6750
richardchandler
 
better together? statistical learning in models made of modules
better together? statistical learning in models made of modulesbetter together? statistical learning in models made of modules
better together? statistical learning in models made of modules
Christian Robert
 
Generalised conditional expectation on extended positive part of
Generalised conditional expectation on extended positive part ofGeneralised conditional expectation on extended positive part of
Generalised conditional expectation on extended positive part of
Alexander Decker
 
Stochastic Differentiation
Stochastic DifferentiationStochastic Differentiation
Stochastic Differentiation
SSA KPI
 
Considerate Approaches to ABC Model Selection
Considerate Approaches to ABC Model SelectionConsiderate Approaches to ABC Model Selection
Considerate Approaches to ABC Model Selection
Michael Stumpf
 
Recommender Systems
Recommender SystemsRecommender Systems

What's hot (18)

Machine learning
Machine learningMachine learning
Machine learning
 
A Maximum Entropy Approach to the Loss Data Aggregation Problem
A Maximum Entropy Approach to the Loss Data Aggregation ProblemA Maximum Entropy Approach to the Loss Data Aggregation Problem
A Maximum Entropy Approach to the Loss Data Aggregation Problem
 
Beginners Guide to Non-Negative Matrix Factorization
Beginners Guide to Non-Negative Matrix FactorizationBeginners Guide to Non-Negative Matrix Factorization
Beginners Guide to Non-Negative Matrix Factorization
 
Presentation on machine learning
Presentation on machine learningPresentation on machine learning
Presentation on machine learning
 
Logistic regression in Machine Learning
Logistic regression in Machine LearningLogistic regression in Machine Learning
Logistic regression in Machine Learning
 
Semi-Supervised Regression using Cluster Ensemble
Semi-Supervised Regression using Cluster EnsembleSemi-Supervised Regression using Cluster Ensemble
Semi-Supervised Regression using Cluster Ensemble
 
6 logistic regression classification algo
6 logistic regression   classification algo6 logistic regression   classification algo
6 logistic regression classification algo
 
Probability And Random Variable Lecture(5)
Probability And Random Variable Lecture(5)Probability And Random Variable Lecture(5)
Probability And Random Variable Lecture(5)
 
MS CS - Selecting Machine Learning Algorithm
MS CS - Selecting Machine Learning AlgorithmMS CS - Selecting Machine Learning Algorithm
MS CS - Selecting Machine Learning Algorithm
 
Multiattribute Decision Making
Multiattribute Decision MakingMultiattribute Decision Making
Multiattribute Decision Making
 
Lecture2 xing
Lecture2 xingLecture2 xing
Lecture2 xing
 
23 Machine Learning Feature Generation
23 Machine Learning Feature Generation23 Machine Learning Feature Generation
23 Machine Learning Feature Generation
 
t-tests in R - Lab slides for UGA course FANR 6750
t-tests in R - Lab slides for UGA course FANR 6750t-tests in R - Lab slides for UGA course FANR 6750
t-tests in R - Lab slides for UGA course FANR 6750
 
better together? statistical learning in models made of modules
better together? statistical learning in models made of modulesbetter together? statistical learning in models made of modules
better together? statistical learning in models made of modules
 
Generalised conditional expectation on extended positive part of
Generalised conditional expectation on extended positive part ofGeneralised conditional expectation on extended positive part of
Generalised conditional expectation on extended positive part of
 
Stochastic Differentiation
Stochastic DifferentiationStochastic Differentiation
Stochastic Differentiation
 
Considerate Approaches to ABC Model Selection
Considerate Approaches to ABC Model SelectionConsiderate Approaches to ABC Model Selection
Considerate Approaches to ABC Model Selection
 
Recommender Systems
Recommender SystemsRecommender Systems
Recommender Systems
 

Viewers also liked

Hadoop Scheduling - a 7 year perspective
Hadoop Scheduling - a 7 year perspectiveHadoop Scheduling - a 7 year perspective
Hadoop Scheduling - a 7 year perspective
Joydeep Sen Sarma
 
Hadoop scheduler
Hadoop schedulerHadoop scheduler
Hadoop scheduler
Subhas Kumar Ghosh
 
Using Gradient Descent for Optimization and Learning
Using Gradient Descent for Optimization and LearningUsing Gradient Descent for Optimization and Learning
Using Gradient Descent for Optimization and Learning
Dr. Volkan OBAN
 
Gradient descent method
Gradient descent methodGradient descent method
Gradient descent method
Sanghyuk Chun
 
Best Practices for the Hadoop Data Warehouse: EDW 101 for Hadoop Professionals
Best Practices for the Hadoop Data Warehouse: EDW 101 for Hadoop ProfessionalsBest Practices for the Hadoop Data Warehouse: EDW 101 for Hadoop Professionals
Best Practices for the Hadoop Data Warehouse: EDW 101 for Hadoop Professionals
Cloudera, Inc.
 
Stochastic gradient descent and its tuning
Stochastic gradient descent and its tuningStochastic gradient descent and its tuning
Stochastic gradient descent and its tuning
Arsalan Qadri
 
Apache hadoop yarn 勉強会 8. capacity scheduler in yarn
Apache hadoop yarn 勉強会 8. capacity scheduler in yarnApache hadoop yarn 勉強会 8. capacity scheduler in yarn
Apache hadoop yarn 勉強会 8. capacity scheduler in yarn
Shuya Tsukamoto
 
Machine learning with Apache Hama
Machine learning with Apache HamaMachine learning with Apache Hama
Machine learning with Apache Hama
Tommaso Teofili
 
Optimization/Gradient Descent
Optimization/Gradient DescentOptimization/Gradient Descent
Optimization/Gradient Descent
kandelin
 
Apache Hadoop YARN – Multi-Tenancy, Capacity Scheduler & Preemption - Stamped...
Apache Hadoop YARN – Multi-Tenancy, Capacity Scheduler & Preemption - Stamped...Apache Hadoop YARN – Multi-Tenancy, Capacity Scheduler & Preemption - Stamped...
Apache Hadoop YARN – Multi-Tenancy, Capacity Scheduler & Preemption - Stamped...
StampedeCon
 
Apache Hadoop YARN: best practices
Apache Hadoop YARN: best practicesApache Hadoop YARN: best practices
Apache Hadoop YARN: best practices
DataWorks Summit
 
Hadoop and Enterprise Data Warehouse
Hadoop and Enterprise Data WarehouseHadoop and Enterprise Data Warehouse
Hadoop and Enterprise Data Warehouse
DataWorks Summit
 

Viewers also liked (12)

Hadoop Scheduling - a 7 year perspective
Hadoop Scheduling - a 7 year perspectiveHadoop Scheduling - a 7 year perspective
Hadoop Scheduling - a 7 year perspective
 
Hadoop scheduler
Hadoop schedulerHadoop scheduler
Hadoop scheduler
 
Using Gradient Descent for Optimization and Learning
Using Gradient Descent for Optimization and LearningUsing Gradient Descent for Optimization and Learning
Using Gradient Descent for Optimization and Learning
 
Gradient descent method
Gradient descent methodGradient descent method
Gradient descent method
 
Best Practices for the Hadoop Data Warehouse: EDW 101 for Hadoop Professionals
Best Practices for the Hadoop Data Warehouse: EDW 101 for Hadoop ProfessionalsBest Practices for the Hadoop Data Warehouse: EDW 101 for Hadoop Professionals
Best Practices for the Hadoop Data Warehouse: EDW 101 for Hadoop Professionals
 
Stochastic gradient descent and its tuning
Stochastic gradient descent and its tuningStochastic gradient descent and its tuning
Stochastic gradient descent and its tuning
 
Apache hadoop yarn 勉強会 8. capacity scheduler in yarn
Apache hadoop yarn 勉強会 8. capacity scheduler in yarnApache hadoop yarn 勉強会 8. capacity scheduler in yarn
Apache hadoop yarn 勉強会 8. capacity scheduler in yarn
 
Machine learning with Apache Hama
Machine learning with Apache HamaMachine learning with Apache Hama
Machine learning with Apache Hama
 
Optimization/Gradient Descent
Optimization/Gradient DescentOptimization/Gradient Descent
Optimization/Gradient Descent
 
Apache Hadoop YARN – Multi-Tenancy, Capacity Scheduler & Preemption - Stamped...
Apache Hadoop YARN – Multi-Tenancy, Capacity Scheduler & Preemption - Stamped...Apache Hadoop YARN – Multi-Tenancy, Capacity Scheduler & Preemption - Stamped...
Apache Hadoop YARN – Multi-Tenancy, Capacity Scheduler & Preemption - Stamped...
 
Apache Hadoop YARN: best practices
Apache Hadoop YARN: best practicesApache Hadoop YARN: best practices
Apache Hadoop YARN: best practices
 
Hadoop and Enterprise Data Warehouse
Hadoop and Enterprise Data WarehouseHadoop and Enterprise Data Warehouse
Hadoop and Enterprise Data Warehouse
 

Similar to 07 logistic regression and stochastic gradient descent

Linear regression
Linear regressionLinear regression
Linear regression
MartinHogg9
 
Linear regression in machine learning
Linear regression in machine learningLinear regression in machine learning
Linear regression in machine learning
Shajun Nisha
 
Difference between logistic regression shallow neural network and deep neura...
Difference between logistic regression  shallow neural network and deep neura...Difference between logistic regression  shallow neural network and deep neura...
Difference between logistic regression shallow neural network and deep neura...
Chode Amarnath
 
Logistical Regression.pptx
Logistical Regression.pptxLogistical Regression.pptx
Logistical Regression.pptx
Ramakrishna Reddy Bijjam
 
working with python
working with pythonworking with python
working with python
bhavesh lande
 
Bootcamp of new world to taken seriously
Bootcamp of new world to taken seriouslyBootcamp of new world to taken seriously
Bootcamp of new world to taken seriously
khaled125087
 
3ml.pdf
3ml.pdf3ml.pdf
3ml.pdf
MianAdnan27
 
PRML Chapter 4
PRML Chapter 4PRML Chapter 4
PRML Chapter 4
Sunwoo Kim
 
Lecture 5 - Gradient Descent, a lecture in subject module Statistical & Machi...
Lecture 5 - Gradient Descent, a lecture in subject module Statistical & Machi...Lecture 5 - Gradient Descent, a lecture in subject module Statistical & Machi...
Lecture 5 - Gradient Descent, a lecture in subject module Statistical & Machi...
Maninda Edirisooriya
 
Lecture 4
Lecture 4Lecture 4
Lecture 4
Nika Gigashvili
 
REGRESSION METasdfghjklmjhgftrHODS1.pptx
REGRESSION METasdfghjklmjhgftrHODS1.pptxREGRESSION METasdfghjklmjhgftrHODS1.pptx
REGRESSION METasdfghjklmjhgftrHODS1.pptx
cajativ595
 
Lecture 3.1_ Logistic Regression.pptx
Lecture 3.1_ Logistic Regression.pptxLecture 3.1_ Logistic Regression.pptx
Lecture 3.1_ Logistic Regression.pptx
ajondaree
 
Linear Regression.pptx
Linear Regression.pptxLinear Regression.pptx
Linear Regression.pptx
Ramakrishna Reddy Bijjam
 
Calculus Application Problem #3 Name _________________________.docx
Calculus Application Problem #3 Name _________________________.docxCalculus Application Problem #3 Name _________________________.docx
Calculus Application Problem #3 Name _________________________.docx
humphrieskalyn
 
Lecture 4 - Linear Regression, a lecture in subject module Statistical & Mach...
Lecture 4 - Linear Regression, a lecture in subject module Statistical & Mach...Lecture 4 - Linear Regression, a lecture in subject module Statistical & Mach...
Lecture 4 - Linear Regression, a lecture in subject module Statistical & Mach...
Maninda Edirisooriya
 
CS229 Machine Learning Lecture Notes
CS229 Machine Learning Lecture NotesCS229 Machine Learning Lecture Notes
CS229 Machine Learning Lecture Notes
Eric Conner
 
[Paper reading] L-SHAPLEY AND C-SHAPLEY: EFFICIENT MODEL INTERPRETATION FOR S...
[Paper reading] L-SHAPLEY AND C-SHAPLEY: EFFICIENT MODEL INTERPRETATION FOR S...[Paper reading] L-SHAPLEY AND C-SHAPLEY: EFFICIENT MODEL INTERPRETATION FOR S...
[Paper reading] L-SHAPLEY AND C-SHAPLEY: EFFICIENT MODEL INTERPRETATION FOR S...
Daiki Tanaka
 
Extra Lecture - Support Vector Machines (SVM), a lecture in subject module St...
Extra Lecture - Support Vector Machines (SVM), a lecture in subject module St...Extra Lecture - Support Vector Machines (SVM), a lecture in subject module St...
Extra Lecture - Support Vector Machines (SVM), a lecture in subject module St...
Maninda Edirisooriya
 
Quantitative Analysis Homework Help
Quantitative Analysis Homework HelpQuantitative Analysis Homework Help
Quantitative Analysis Homework Help
Excel Homework Help
 
Model Selection and Validation
Model Selection and ValidationModel Selection and Validation
Model Selection and Validation
gmorishita
 

Similar to 07 logistic regression and stochastic gradient descent (20)

Linear regression
Linear regressionLinear regression
Linear regression
 
Linear regression in machine learning
Linear regression in machine learningLinear regression in machine learning
Linear regression in machine learning
 
Difference between logistic regression shallow neural network and deep neura...
Difference between logistic regression  shallow neural network and deep neura...Difference between logistic regression  shallow neural network and deep neura...
Difference between logistic regression shallow neural network and deep neura...
 
Logistical Regression.pptx
Logistical Regression.pptxLogistical Regression.pptx
Logistical Regression.pptx
 
working with python
working with pythonworking with python
working with python
 
Bootcamp of new world to taken seriously
Bootcamp of new world to taken seriouslyBootcamp of new world to taken seriously
Bootcamp of new world to taken seriously
 
3ml.pdf
3ml.pdf3ml.pdf
3ml.pdf
 
PRML Chapter 4
PRML Chapter 4PRML Chapter 4
PRML Chapter 4
 
Lecture 5 - Gradient Descent, a lecture in subject module Statistical & Machi...
Lecture 5 - Gradient Descent, a lecture in subject module Statistical & Machi...Lecture 5 - Gradient Descent, a lecture in subject module Statistical & Machi...
Lecture 5 - Gradient Descent, a lecture in subject module Statistical & Machi...
 
Lecture 4
Lecture 4Lecture 4
Lecture 4
 
REGRESSION METasdfghjklmjhgftrHODS1.pptx
REGRESSION METasdfghjklmjhgftrHODS1.pptxREGRESSION METasdfghjklmjhgftrHODS1.pptx
REGRESSION METasdfghjklmjhgftrHODS1.pptx
 
Lecture 3.1_ Logistic Regression.pptx
Lecture 3.1_ Logistic Regression.pptxLecture 3.1_ Logistic Regression.pptx
Lecture 3.1_ Logistic Regression.pptx
 
Linear Regression.pptx
Linear Regression.pptxLinear Regression.pptx
Linear Regression.pptx
 
Calculus Application Problem #3 Name _________________________.docx
Calculus Application Problem #3 Name _________________________.docxCalculus Application Problem #3 Name _________________________.docx
Calculus Application Problem #3 Name _________________________.docx
 
Lecture 4 - Linear Regression, a lecture in subject module Statistical & Mach...
Lecture 4 - Linear Regression, a lecture in subject module Statistical & Mach...Lecture 4 - Linear Regression, a lecture in subject module Statistical & Mach...
Lecture 4 - Linear Regression, a lecture in subject module Statistical & Mach...
 
CS229 Machine Learning Lecture Notes
CS229 Machine Learning Lecture NotesCS229 Machine Learning Lecture Notes
CS229 Machine Learning Lecture Notes
 
[Paper reading] L-SHAPLEY AND C-SHAPLEY: EFFICIENT MODEL INTERPRETATION FOR S...
[Paper reading] L-SHAPLEY AND C-SHAPLEY: EFFICIENT MODEL INTERPRETATION FOR S...[Paper reading] L-SHAPLEY AND C-SHAPLEY: EFFICIENT MODEL INTERPRETATION FOR S...
[Paper reading] L-SHAPLEY AND C-SHAPLEY: EFFICIENT MODEL INTERPRETATION FOR S...
 
Extra Lecture - Support Vector Machines (SVM), a lecture in subject module St...
Extra Lecture - Support Vector Machines (SVM), a lecture in subject module St...Extra Lecture - Support Vector Machines (SVM), a lecture in subject module St...
Extra Lecture - Support Vector Machines (SVM), a lecture in subject module St...
 
Quantitative Analysis Homework Help
Quantitative Analysis Homework HelpQuantitative Analysis Homework Help
Quantitative Analysis Homework Help
 
Model Selection and Validation
Model Selection and ValidationModel Selection and Validation
Model Selection and Validation
 

More from Subhas Kumar Ghosh

06 how to write a map reduce version of k-means clustering
06 how to write a map reduce version of k-means clustering06 how to write a map reduce version of k-means clustering
06 how to write a map reduce version of k-means clustering
Subhas Kumar Ghosh
 
05 k-means clustering
05 k-means clustering05 k-means clustering
05 k-means clustering
Subhas Kumar Ghosh
 
03 hive query language (hql)
03 hive query language (hql)03 hive query language (hql)
03 hive query language (hql)
Subhas Kumar Ghosh
 
02 data warehouse applications with hive
02 data warehouse applications with hive02 data warehouse applications with hive
02 data warehouse applications with hive
Subhas Kumar Ghosh
 
01 hbase
01 hbase01 hbase
06 pig etl features
06 pig etl features06 pig etl features
06 pig etl features
Subhas Kumar Ghosh
 
05 pig user defined functions (udfs)
05 pig user defined functions (udfs)05 pig user defined functions (udfs)
05 pig user defined functions (udfs)
Subhas Kumar Ghosh
 
04 pig data operations
04 pig data operations04 pig data operations
04 pig data operations
Subhas Kumar Ghosh
 
03 pig intro
03 pig intro03 pig intro
03 pig intro
Subhas Kumar Ghosh
 
02 naive bays classifier and sentiment analysis
02 naive bays classifier and sentiment analysis02 naive bays classifier and sentiment analysis
02 naive bays classifier and sentiment analysis
Subhas Kumar Ghosh
 
Hadoop performance optimization tips
Hadoop performance optimization tipsHadoop performance optimization tips
Hadoop performance optimization tips
Subhas Kumar Ghosh
 
Hadoop Day 3
Hadoop Day 3Hadoop Day 3
Hadoop Day 3
Subhas Kumar Ghosh
 
Hadoop exercise
Hadoop exerciseHadoop exercise
Hadoop exercise
Subhas Kumar Ghosh
 
Hadoop map reduce v2
Hadoop map reduce v2Hadoop map reduce v2
Hadoop map reduce v2
Subhas Kumar Ghosh
 
Hadoop job chaining
Hadoop job chainingHadoop job chaining
Hadoop job chaining
Subhas Kumar Ghosh
 
Hadoop secondary sort and a custom comparator
Hadoop secondary sort and a custom comparatorHadoop secondary sort and a custom comparator
Hadoop secondary sort and a custom comparator
Subhas Kumar Ghosh
 
Hadoop combiner and partitioner
Hadoop combiner and partitionerHadoop combiner and partitioner
Hadoop combiner and partitioner
Subhas Kumar Ghosh
 
Hadoop deconstructing map reduce job step by step
Hadoop deconstructing map reduce job step by stepHadoop deconstructing map reduce job step by step
Hadoop deconstructing map reduce job step by step
Subhas Kumar Ghosh
 
Hadoop map reduce in operation
Hadoop map reduce in operationHadoop map reduce in operation
Hadoop map reduce in operation
Subhas Kumar Ghosh
 
Hadoop map reduce concepts
Hadoop map reduce conceptsHadoop map reduce concepts
Hadoop map reduce concepts
Subhas Kumar Ghosh
 

More from Subhas Kumar Ghosh (20)

06 how to write a map reduce version of k-means clustering
06 how to write a map reduce version of k-means clustering06 how to write a map reduce version of k-means clustering
06 how to write a map reduce version of k-means clustering
 
05 k-means clustering
05 k-means clustering05 k-means clustering
05 k-means clustering
 
03 hive query language (hql)
03 hive query language (hql)03 hive query language (hql)
03 hive query language (hql)
 
02 data warehouse applications with hive
02 data warehouse applications with hive02 data warehouse applications with hive
02 data warehouse applications with hive
 
01 hbase
01 hbase01 hbase
01 hbase
 
06 pig etl features
06 pig etl features06 pig etl features
06 pig etl features
 
05 pig user defined functions (udfs)
05 pig user defined functions (udfs)05 pig user defined functions (udfs)
05 pig user defined functions (udfs)
 
04 pig data operations
04 pig data operations04 pig data operations
04 pig data operations
 
03 pig intro
03 pig intro03 pig intro
03 pig intro
 
02 naive bays classifier and sentiment analysis
02 naive bays classifier and sentiment analysis02 naive bays classifier and sentiment analysis
02 naive bays classifier and sentiment analysis
 
Hadoop performance optimization tips
Hadoop performance optimization tipsHadoop performance optimization tips
Hadoop performance optimization tips
 
Hadoop Day 3
Hadoop Day 3Hadoop Day 3
Hadoop Day 3
 
Hadoop exercise
Hadoop exerciseHadoop exercise
Hadoop exercise
 
Hadoop map reduce v2
Hadoop map reduce v2Hadoop map reduce v2
Hadoop map reduce v2
 
Hadoop job chaining
Hadoop job chainingHadoop job chaining
Hadoop job chaining
 
Hadoop secondary sort and a custom comparator
Hadoop secondary sort and a custom comparatorHadoop secondary sort and a custom comparator
Hadoop secondary sort and a custom comparator
 
Hadoop combiner and partitioner
Hadoop combiner and partitionerHadoop combiner and partitioner
Hadoop combiner and partitioner
 
Hadoop deconstructing map reduce job step by step
Hadoop deconstructing map reduce job step by stepHadoop deconstructing map reduce job step by step
Hadoop deconstructing map reduce job step by step
 
Hadoop map reduce in operation
Hadoop map reduce in operationHadoop map reduce in operation
Hadoop map reduce in operation
 
Hadoop map reduce concepts
Hadoop map reduce conceptsHadoop map reduce concepts
Hadoop map reduce concepts
 

Recently uploaded

Automated software refactoring with OpenRewrite and Generative AI.pptx.pdf
Automated software refactoring with OpenRewrite and Generative AI.pptx.pdfAutomated software refactoring with OpenRewrite and Generative AI.pptx.pdf
Automated software refactoring with OpenRewrite and Generative AI.pptx.pdf
timtebeek1
 
socradar-q1-2024-aviation-industry-report.pdf
socradar-q1-2024-aviation-industry-report.pdfsocradar-q1-2024-aviation-industry-report.pdf
socradar-q1-2024-aviation-industry-report.pdf
SOCRadar
 
Vitthal Shirke Java Microservices Resume.pdf
Vitthal Shirke Java Microservices Resume.pdfVitthal Shirke Java Microservices Resume.pdf
Vitthal Shirke Java Microservices Resume.pdf
Vitthal Shirke
 
Essentials of Automations: The Art of Triggers and Actions in FME
Essentials of Automations: The Art of Triggers and Actions in FMEEssentials of Automations: The Art of Triggers and Actions in FME
Essentials of Automations: The Art of Triggers and Actions in FME
Safe Software
 
Empowering Growth with Best Software Development Company in Noida - Deuglo
Empowering Growth with Best Software  Development Company in Noida - DeugloEmpowering Growth with Best Software  Development Company in Noida - Deuglo
Empowering Growth with Best Software Development Company in Noida - Deuglo
Deuglo Infosystem Pvt Ltd
 
Introducing Crescat - Event Management Software for Venues, Festivals and Eve...
Introducing Crescat - Event Management Software for Venues, Festivals and Eve...Introducing Crescat - Event Management Software for Venues, Festivals and Eve...
Introducing Crescat - Event Management Software for Venues, Festivals and Eve...
Crescat
 
GreenCode-A-VSCode-Plugin--Dario-Jurisic
GreenCode-A-VSCode-Plugin--Dario-JurisicGreenCode-A-VSCode-Plugin--Dario-Jurisic
GreenCode-A-VSCode-Plugin--Dario-Jurisic
Green Software Development
 
DDS-Security 1.2 - What's New? Stronger security for long-running systems
DDS-Security 1.2 - What's New? Stronger security for long-running systemsDDS-Security 1.2 - What's New? Stronger security for long-running systems
DDS-Security 1.2 - What's New? Stronger security for long-running systems
Gerardo Pardo-Castellote
 
Revolutionizing Visual Effects Mastering AI Face Swaps.pdf
Revolutionizing Visual Effects Mastering AI Face Swaps.pdfRevolutionizing Visual Effects Mastering AI Face Swaps.pdf
Revolutionizing Visual Effects Mastering AI Face Swaps.pdf
Undress Baby
 
E-Invoicing Implementation: A Step-by-Step Guide for Saudi Arabian Companies
E-Invoicing Implementation: A Step-by-Step Guide for Saudi Arabian CompaniesE-Invoicing Implementation: A Step-by-Step Guide for Saudi Arabian Companies
E-Invoicing Implementation: A Step-by-Step Guide for Saudi Arabian Companies
Quickdice ERP
 
LORRAINE ANDREI_LEQUIGAN_HOW TO USE WHATSAPP.pptx
LORRAINE ANDREI_LEQUIGAN_HOW TO USE WHATSAPP.pptxLORRAINE ANDREI_LEQUIGAN_HOW TO USE WHATSAPP.pptx
LORRAINE ANDREI_LEQUIGAN_HOW TO USE WHATSAPP.pptx
lorraineandreiamcidl
 
Oracle Database 19c New Features for DBAs and Developers.pptx
Oracle Database 19c New Features for DBAs and Developers.pptxOracle Database 19c New Features for DBAs and Developers.pptx
Oracle Database 19c New Features for DBAs and Developers.pptx
Remote DBA Services
 
Neo4j - Product Vision and Knowledge Graphs - GraphSummit Paris
Neo4j - Product Vision and Knowledge Graphs - GraphSummit ParisNeo4j - Product Vision and Knowledge Graphs - GraphSummit Paris
Neo4j - Product Vision and Knowledge Graphs - GraphSummit Paris
Neo4j
 
2024 eCommerceDays Toulouse - Sylius 2.0.pdf
2024 eCommerceDays Toulouse - Sylius 2.0.pdf2024 eCommerceDays Toulouse - Sylius 2.0.pdf
2024 eCommerceDays Toulouse - Sylius 2.0.pdf
Łukasz Chruściel
 
Using Xen Hypervisor for Functional Safety
Using Xen Hypervisor for Functional SafetyUsing Xen Hypervisor for Functional Safety
Using Xen Hypervisor for Functional Safety
Ayan Halder
 
Transform Your Communication with Cloud-Based IVR Solutions
Transform Your Communication with Cloud-Based IVR SolutionsTransform Your Communication with Cloud-Based IVR Solutions
Transform Your Communication with Cloud-Based IVR Solutions
TheSMSPoint
 
OpenMetadata Community Meeting - 5th June 2024
OpenMetadata Community Meeting - 5th June 2024OpenMetadata Community Meeting - 5th June 2024
OpenMetadata Community Meeting - 5th June 2024
OpenMetadata
 
ALGIT - Assembly Line for Green IT - Numbers, Data, Facts
ALGIT - Assembly Line for Green IT - Numbers, Data, FactsALGIT - Assembly Line for Green IT - Numbers, Data, Facts
ALGIT - Assembly Line for Green IT - Numbers, Data, Facts
Green Software Development
 
UI5con 2024 - Boost Your Development Experience with UI5 Tooling Extensions
UI5con 2024 - Boost Your Development Experience with UI5 Tooling ExtensionsUI5con 2024 - Boost Your Development Experience with UI5 Tooling Extensions
UI5con 2024 - Boost Your Development Experience with UI5 Tooling Extensions
Peter Muessig
 
Neo4j - Product Vision and Knowledge Graphs - GraphSummit Paris
Neo4j - Product Vision and Knowledge Graphs - GraphSummit ParisNeo4j - Product Vision and Knowledge Graphs - GraphSummit Paris
Neo4j - Product Vision and Knowledge Graphs - GraphSummit Paris
Neo4j
 

Recently uploaded (20)

Automated software refactoring with OpenRewrite and Generative AI.pptx.pdf
Automated software refactoring with OpenRewrite and Generative AI.pptx.pdfAutomated software refactoring with OpenRewrite and Generative AI.pptx.pdf
Automated software refactoring with OpenRewrite and Generative AI.pptx.pdf
 
socradar-q1-2024-aviation-industry-report.pdf
socradar-q1-2024-aviation-industry-report.pdfsocradar-q1-2024-aviation-industry-report.pdf
socradar-q1-2024-aviation-industry-report.pdf
 
Vitthal Shirke Java Microservices Resume.pdf
Vitthal Shirke Java Microservices Resume.pdfVitthal Shirke Java Microservices Resume.pdf
Vitthal Shirke Java Microservices Resume.pdf
 
Essentials of Automations: The Art of Triggers and Actions in FME
Essentials of Automations: The Art of Triggers and Actions in FMEEssentials of Automations: The Art of Triggers and Actions in FME
Essentials of Automations: The Art of Triggers and Actions in FME
 
Empowering Growth with Best Software Development Company in Noida - Deuglo
Empowering Growth with Best Software  Development Company in Noida - DeugloEmpowering Growth with Best Software  Development Company in Noida - Deuglo
Empowering Growth with Best Software Development Company in Noida - Deuglo
 
Introducing Crescat - Event Management Software for Venues, Festivals and Eve...
Introducing Crescat - Event Management Software for Venues, Festivals and Eve...Introducing Crescat - Event Management Software for Venues, Festivals and Eve...
Introducing Crescat - Event Management Software for Venues, Festivals and Eve...
 
GreenCode-A-VSCode-Plugin--Dario-Jurisic
GreenCode-A-VSCode-Plugin--Dario-JurisicGreenCode-A-VSCode-Plugin--Dario-Jurisic
GreenCode-A-VSCode-Plugin--Dario-Jurisic
 
DDS-Security 1.2 - What's New? Stronger security for long-running systems
DDS-Security 1.2 - What's New? Stronger security for long-running systemsDDS-Security 1.2 - What's New? Stronger security for long-running systems
DDS-Security 1.2 - What's New? Stronger security for long-running systems
 
Revolutionizing Visual Effects Mastering AI Face Swaps.pdf
Revolutionizing Visual Effects Mastering AI Face Swaps.pdfRevolutionizing Visual Effects Mastering AI Face Swaps.pdf
Revolutionizing Visual Effects Mastering AI Face Swaps.pdf
 
E-Invoicing Implementation: A Step-by-Step Guide for Saudi Arabian Companies
E-Invoicing Implementation: A Step-by-Step Guide for Saudi Arabian CompaniesE-Invoicing Implementation: A Step-by-Step Guide for Saudi Arabian Companies
E-Invoicing Implementation: A Step-by-Step Guide for Saudi Arabian Companies
 
LORRAINE ANDREI_LEQUIGAN_HOW TO USE WHATSAPP.pptx
LORRAINE ANDREI_LEQUIGAN_HOW TO USE WHATSAPP.pptxLORRAINE ANDREI_LEQUIGAN_HOW TO USE WHATSAPP.pptx
LORRAINE ANDREI_LEQUIGAN_HOW TO USE WHATSAPP.pptx
 
Oracle Database 19c New Features for DBAs and Developers.pptx
Oracle Database 19c New Features for DBAs and Developers.pptxOracle Database 19c New Features for DBAs and Developers.pptx
Oracle Database 19c New Features for DBAs and Developers.pptx
 
Neo4j - Product Vision and Knowledge Graphs - GraphSummit Paris
Neo4j - Product Vision and Knowledge Graphs - GraphSummit ParisNeo4j - Product Vision and Knowledge Graphs - GraphSummit Paris
Neo4j - Product Vision and Knowledge Graphs - GraphSummit Paris
 
2024 eCommerceDays Toulouse - Sylius 2.0.pdf
2024 eCommerceDays Toulouse - Sylius 2.0.pdf2024 eCommerceDays Toulouse - Sylius 2.0.pdf
2024 eCommerceDays Toulouse - Sylius 2.0.pdf
 
Using Xen Hypervisor for Functional Safety
Using Xen Hypervisor for Functional SafetyUsing Xen Hypervisor for Functional Safety
Using Xen Hypervisor for Functional Safety
 
Transform Your Communication with Cloud-Based IVR Solutions
Transform Your Communication with Cloud-Based IVR SolutionsTransform Your Communication with Cloud-Based IVR Solutions
Transform Your Communication with Cloud-Based IVR Solutions
 
OpenMetadata Community Meeting - 5th June 2024
OpenMetadata Community Meeting - 5th June 2024OpenMetadata Community Meeting - 5th June 2024
OpenMetadata Community Meeting - 5th June 2024
 
ALGIT - Assembly Line for Green IT - Numbers, Data, Facts
ALGIT - Assembly Line for Green IT - Numbers, Data, FactsALGIT - Assembly Line for Green IT - Numbers, Data, Facts
ALGIT - Assembly Line for Green IT - Numbers, Data, Facts
 
UI5con 2024 - Boost Your Development Experience with UI5 Tooling Extensions
UI5con 2024 - Boost Your Development Experience with UI5 Tooling ExtensionsUI5con 2024 - Boost Your Development Experience with UI5 Tooling Extensions
UI5con 2024 - Boost Your Development Experience with UI5 Tooling Extensions
 
Neo4j - Product Vision and Knowledge Graphs - GraphSummit Paris
Neo4j - Product Vision and Knowledge Graphs - GraphSummit ParisNeo4j - Product Vision and Knowledge Graphs - GraphSummit Paris
Neo4j - Product Vision and Knowledge Graphs - GraphSummit Paris
 

07 logistic regression and stochastic gradient descent

  • 1. Logistic Regression using Stochastic Gradient Descent
  • 2. Regression • In statistics we use two different names for tasks that map some input features into some output value; we use the word regression when the output is real-valued, and classification when the output is one of a discrete set of classes. • Example: – Levitt and Dubner (2005) showed that the words used in a real estate ad can be used as a good predictor of whether a house will sell for more or less than its asking price. – They showed, for example, that houses whose real estate ads had words like fantastic, cute, or charming, tended to sell for lower prices – while houses whose ads had words like maple and granite tended to sell for higher prices. – Their hypothesis was that real estate agents used vague positive words like fantastic to mask the lack of any specific positive qualities in the house.
  • 3. Example • Following figure shows a graph, with the feature (# of adjectives) on the • REGRESSION LINE x-axis, and the price on the y-axis. • We have also plotted a regression line, which is the line that best fits the observed data. • The equation of any line is y = mx+b; • as we see on the graph, the slope of this line is m = −4900, while the intercept is 16550.
  • 4. Example • We can think of these two parameters of this line (slope m and intercept b) as a set of weights that we use to map from our features (in this case x, numbers of adjectives) to our output value y (in this case price). • We can represent this linear function using w to refer to weights as follows: • price = w0 + w1 * (Num Adjectives) • This model then gives us a linear function that lets us estimate the sales price for any number of these adjectives. • For example, how much would we expect a house whose ad has 5 adjectives to sell for?
  • 5. Linear Regression • The true power of linear models comes when we use more than one feature • (technically we call this multiple linear regression). • For example, the final house price probably depends on many factors such as the – average mortgage rate that month, – the number of unsold houses on the market, and many other such factors. • We could encode each of these as a variable, and the importance of each factor would be the weight on that variable, as follows: • price=w0 + w1 * (Num Adjectives) + w2 * (Mortgage Rate) + w3 * (Num Unsold Houses)
  • 6. Example • We represent each observation (each house for sale) by a vector of these features. • Suppose a house has 1 adjective in its ad, and the mortgage rate was 6.5 and there were 10,000 unsold houses in the city. • The feature vector for the house would be f = (20000,6.5,10000). • Suppose the weight vector that we had previously learned for this task was w = (w0,w1,w2,w3) = (18000,−5000,−3000,−1.8). • Then the predicted value for this house would be computed by multiplying each feature by its weight:
  • 7. Dot Product • Taking two vectors and creating a scalar by multiplying each element in a pair DOT PRODUCT wise fashion and summing the results is called the dot product. • Recall that the dot product a · b between two vectors a and b is defined as:
  • 8. Learning in linear regression • How do we learn the weights for linear regression? • Intuitively we’d like to choose weights that make the estimated values y as close as possible to the actual values that we saw in the training set. • Consider a particular instance x(j) from the training set, with has an observed label in the training set y(j) obs. • Our linear regression model predicts a value for y(j) as follows: • We’d like to choose the whole set of weights W so as to minimize the difference between the predicted value y(j) pred and the observed value y(j) obs, and we want this difference minimized over all the M examples in our training set.
  • 9. Sum-squared error • Actually we want to minimize the absolute value of the difference (since we don’t want a negative distance in one example to cancel out a positive difference in another example), so for simplicity (and differentiability) we minimize the square of the difference. • Thus the total value we want to minimize, which we call the sum-squared error, is this cost function of the current set of weights W:
  • 10. Minimizing Sum-squared error • Briefly, it turns out that if we put the entire training set into a single matrix X with each row in the matrix consisting of the vector of features associated with each observation x(j) • And put all the observed y values in a vector y, that there is a closed-form formula for the optimal weight values W which will minimize cost(W):
  • 11. Logistic Regression - Introductioin • Linear regression is what we want when we are predicting a real-valued outcome. • But somewhat more commonly in text processing we are doing classification, in which the output y we are trying to predict takes on one from a small set of discrete values. • Consider the simplest case of binary classification, where we want to classify • whether some observation x is in the class (true) or not in the class (false). • In other words y can only take on the values 1 (true) or 0 (false), and we’d like a classifier that can take features of x and return true or false. • Furthermore, instead of just returning the 0 or 1 value, we’d like a model that can give us the probability that a particular observation is in class 0 or 1. • Could we modify our linear regression model to use it for this kind of probabilistic classification?
  • 13. Deriving expression for logit • We could train such a model by assigning each training observation the target value y = 1 if it was in the class (true) and the target value y = 0 if it was not (false). • Each observation x would have a feature vector f , and we would train the weight vector w to minimize the predictive error from 1 (for observations in the class) or 0 (for observations not in the class). • After training, we would compute the probability of a class given an observation by just taking the dot product of the weight vector with the features for that observation. • The problem with this model is that there is nothing to force the output to be a legal probability, i.e. to lie between zero and 1. • How can we fix this problem?
  • 14. Deriving expression for logit • We could use the linear model to predict the odds of y being true: • A ratio of probabilities can lie between 0 and Inf. But we need the left-hand side of the equation to lie between −Inf and Inf. We can achieve this by taking the natural log of this probability: • This function on the left (the log of the odds) is known as the logit function:
  • 15. Logistic function • The model of regression in which we use a linear function to estimate, not the probability, but the logit of the probability, is known as logistic regression. • If the linear function is estimating the logit, what is the actual formula in logistic regression for the probability P(y = true)? • Last equation is now in the form of what is called the logistic function, (the function that gives logistic regression its name).
  • 16. Logistic regression • Given a particular observation, how do we decide which of the two classes (‘true’ or ‘false’) it belongs to? • Recall, • Using this • Thus in order to decide if an observation is a member of the class we just need to compute the linear function, and see if its value is positive
  • 17. Learning Hyperplane • With the explicit sum notation we need to see if • This is the equation of a hyperplane, thus we can see the logistic regression function as learning a hyperplane which separates points in space which are in the class (’true’) from points which are not in the class. • In linear regression, learning consisted of choosing the weights w which minimized the sum-squared error on the training set. • In logistic regression, by contrast, we generally use conditional maximium likelihood estimation. • We choose the parameters w which makes the probability of the observed y values in the training data to be the highest, given the observations x.
  • 18. Learning Hyperplane • In other words, for an individual training observation x, we want to choose the weights as follows • And this is for the whole training set: • Using log likelihood and substituting for P(y|x) we have: • This is a convex optimization problem. One heuristic solution is stochastic gradient descent.
  • 19. Logistic regression using Mahout • Suppose you’re in search of filled shapes—color-fill is your target variable. • What features will best serve as predictor variables for this problem? • For a classification problem, you must select categories for your target variable, which in this case is color-fill. • Color-fill is clearly categorical with two possible values that you could label filled and unfilled. • Now you must select the features for use as predictor variables. • What features can you describe appropriately? • Color-fill is out (it’s the target variable) but you can use position or shape as variables. You could describe position by the x and y coordinates.
  • 20. Choosing features • As you design your classification system, you’ll select those features that your experience suggests are most likely to be effective, and the accuracy of your model will tell you if you have chosen wisely.
  • 21. Logistic regression using Mahout • $ mahout – cat : Print a file or resource as the logistic regression models would see it – runlogistic : Run a logistic regression model against CSV data – trainlogistic : Train a logistic regression using stochastic gradient descent • To help you get started with classification, Mahout includes several data sets as resources in the JAR file that contains the example programs. • $mahout cat donut.csv
  • 23. BUILD A MODEL USING MAHOUT • You can build a model to determine the color field from the x and y features with the following command: • mahout trainlogistic --input donut.csv --output ./model --target color --categories 2 --predictors x y --types numeric --features 20 --passes 100 --rate 50 color ~ -0.157*Intercept Term + -0.678*x + -0.416*y Intercept Term -0.15655 x -0.67841 y -0.41587 • This command specifies that the input comes from the resource named donut.csv, that the resulting model is stored in the file ./model, that the target variable is in the field named color and that it has two possible values. • The command also specifies that the algorithm should use variables x and y as predictors, both with numerical types.
  • 24. Evaluating a model • Now that you have trained your first classification model, you need to determine how well it’s performing the task of estimating color-fill condition. • Remember that this problem has the filled points completely surrounded by unfilled points, which makes it impossible for a simple model, such as is produced by the SGD algorithm using only x and y coordinates, to classify points accurately. • Indeed, the linear equation underlying this model can only produce a negative value, which, in the context of logistic regression, is guaranteed to never produce a score greater than 0.5. • As we shall see, this first model isn’t very useful. • mahout runlogistic --input donut.csv --model ./model --auc --confusion
  • 25. Evaluating a model • The output here contains two values of particular interest. First, the AUC value (an acronym for area under the curve—a widely used measure of model quality) has a value of 0.57. • AUC can range from 0 for a perfectly perverse model that’s always exactly wrong to 0.5 for a model that’s no better than random to 1.0 for a model that’s perfect. • The value here of 0.57 indicates a model that’s hardly better than random. • To understand why this model performs so poorly, you can look to a confusion matrix for a clue. • A confusion matrix is a table that compares actual results with desired results. • All examples at the default score threshold of 0.5 are classified as being unfilled. • This allows the classifier to be correct two-thirds of the time (27 out of 40 times)
  • 26. A better model • mahout trainlogistic --input donut.csv --output model --target color --categories 2 --predictors x y a b c --types numeric --features 20 --passes 100 --rate 50 • Evaluate: mahout runlogistic --input donut.csv --model ./model --auc –confusion • You can run this same model on additional data in the donut-test.csv resource: mahout runlogistic --input donut-test.csv --model ./model --auc –confusion • 2 unfilled points that were marked as filled by the model (false positives), and 3 filled points that were marked by the model as unfilled (false negatives). Clearly the use of the additional variables, notably the inclusion of c, has helped the model substantially, but there are still a few issues. • Try other models
  • 27. End of session Day – 4: Logistic Regression using Stochastic Gradient Descent