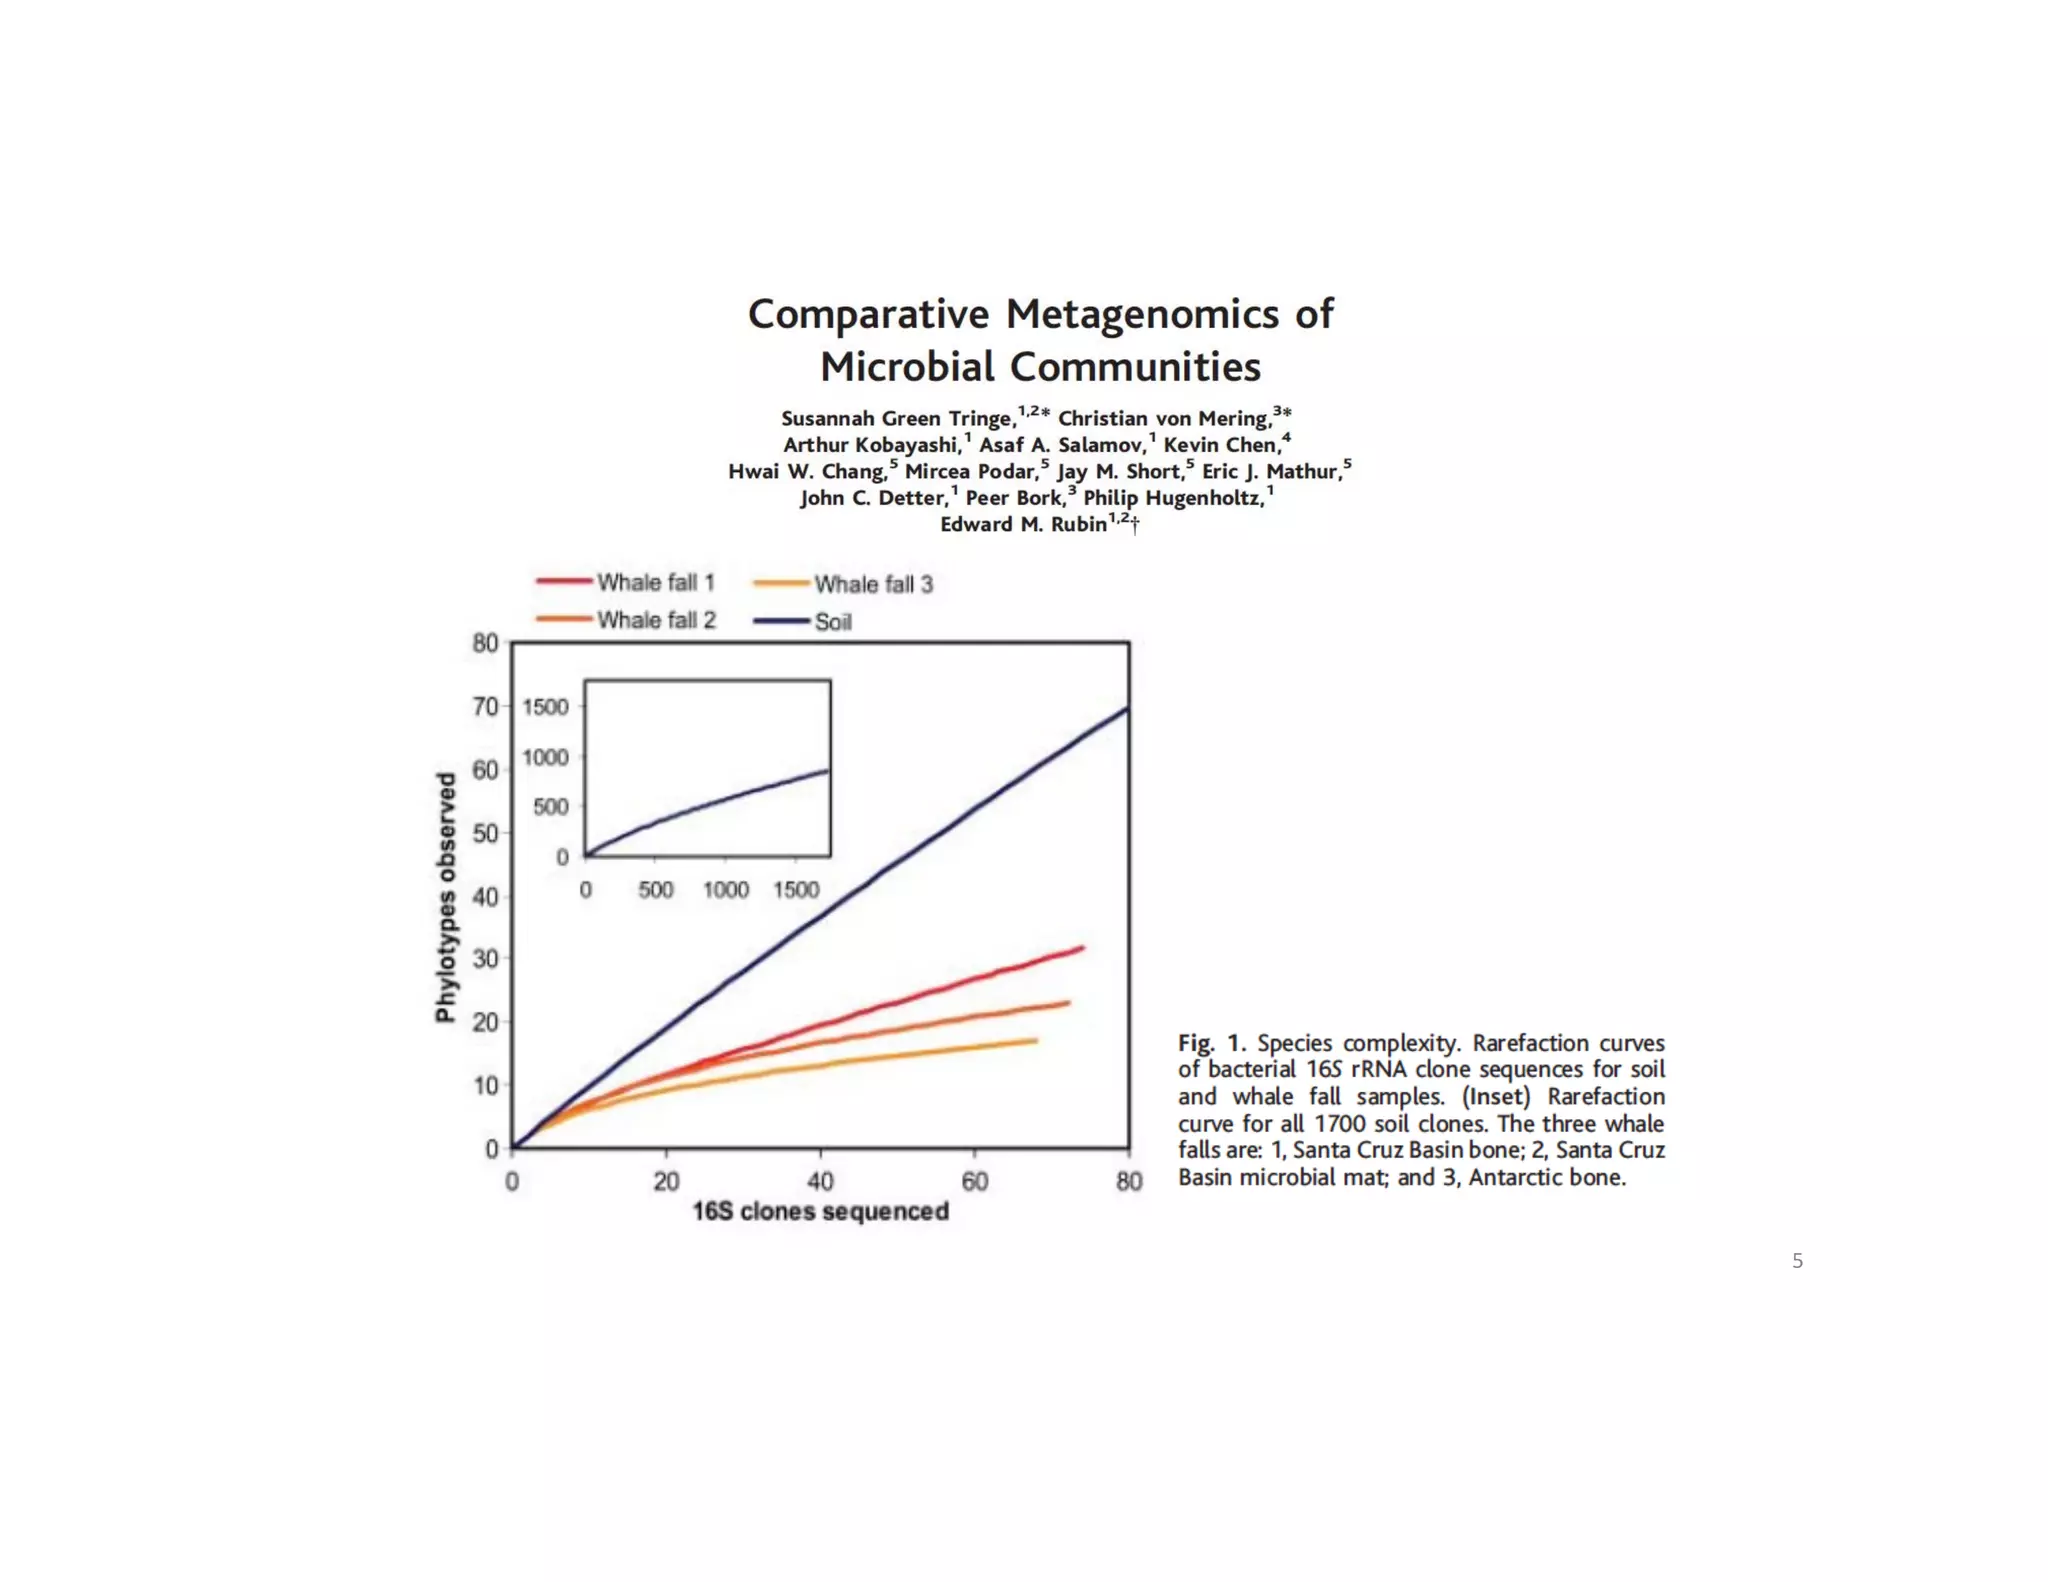
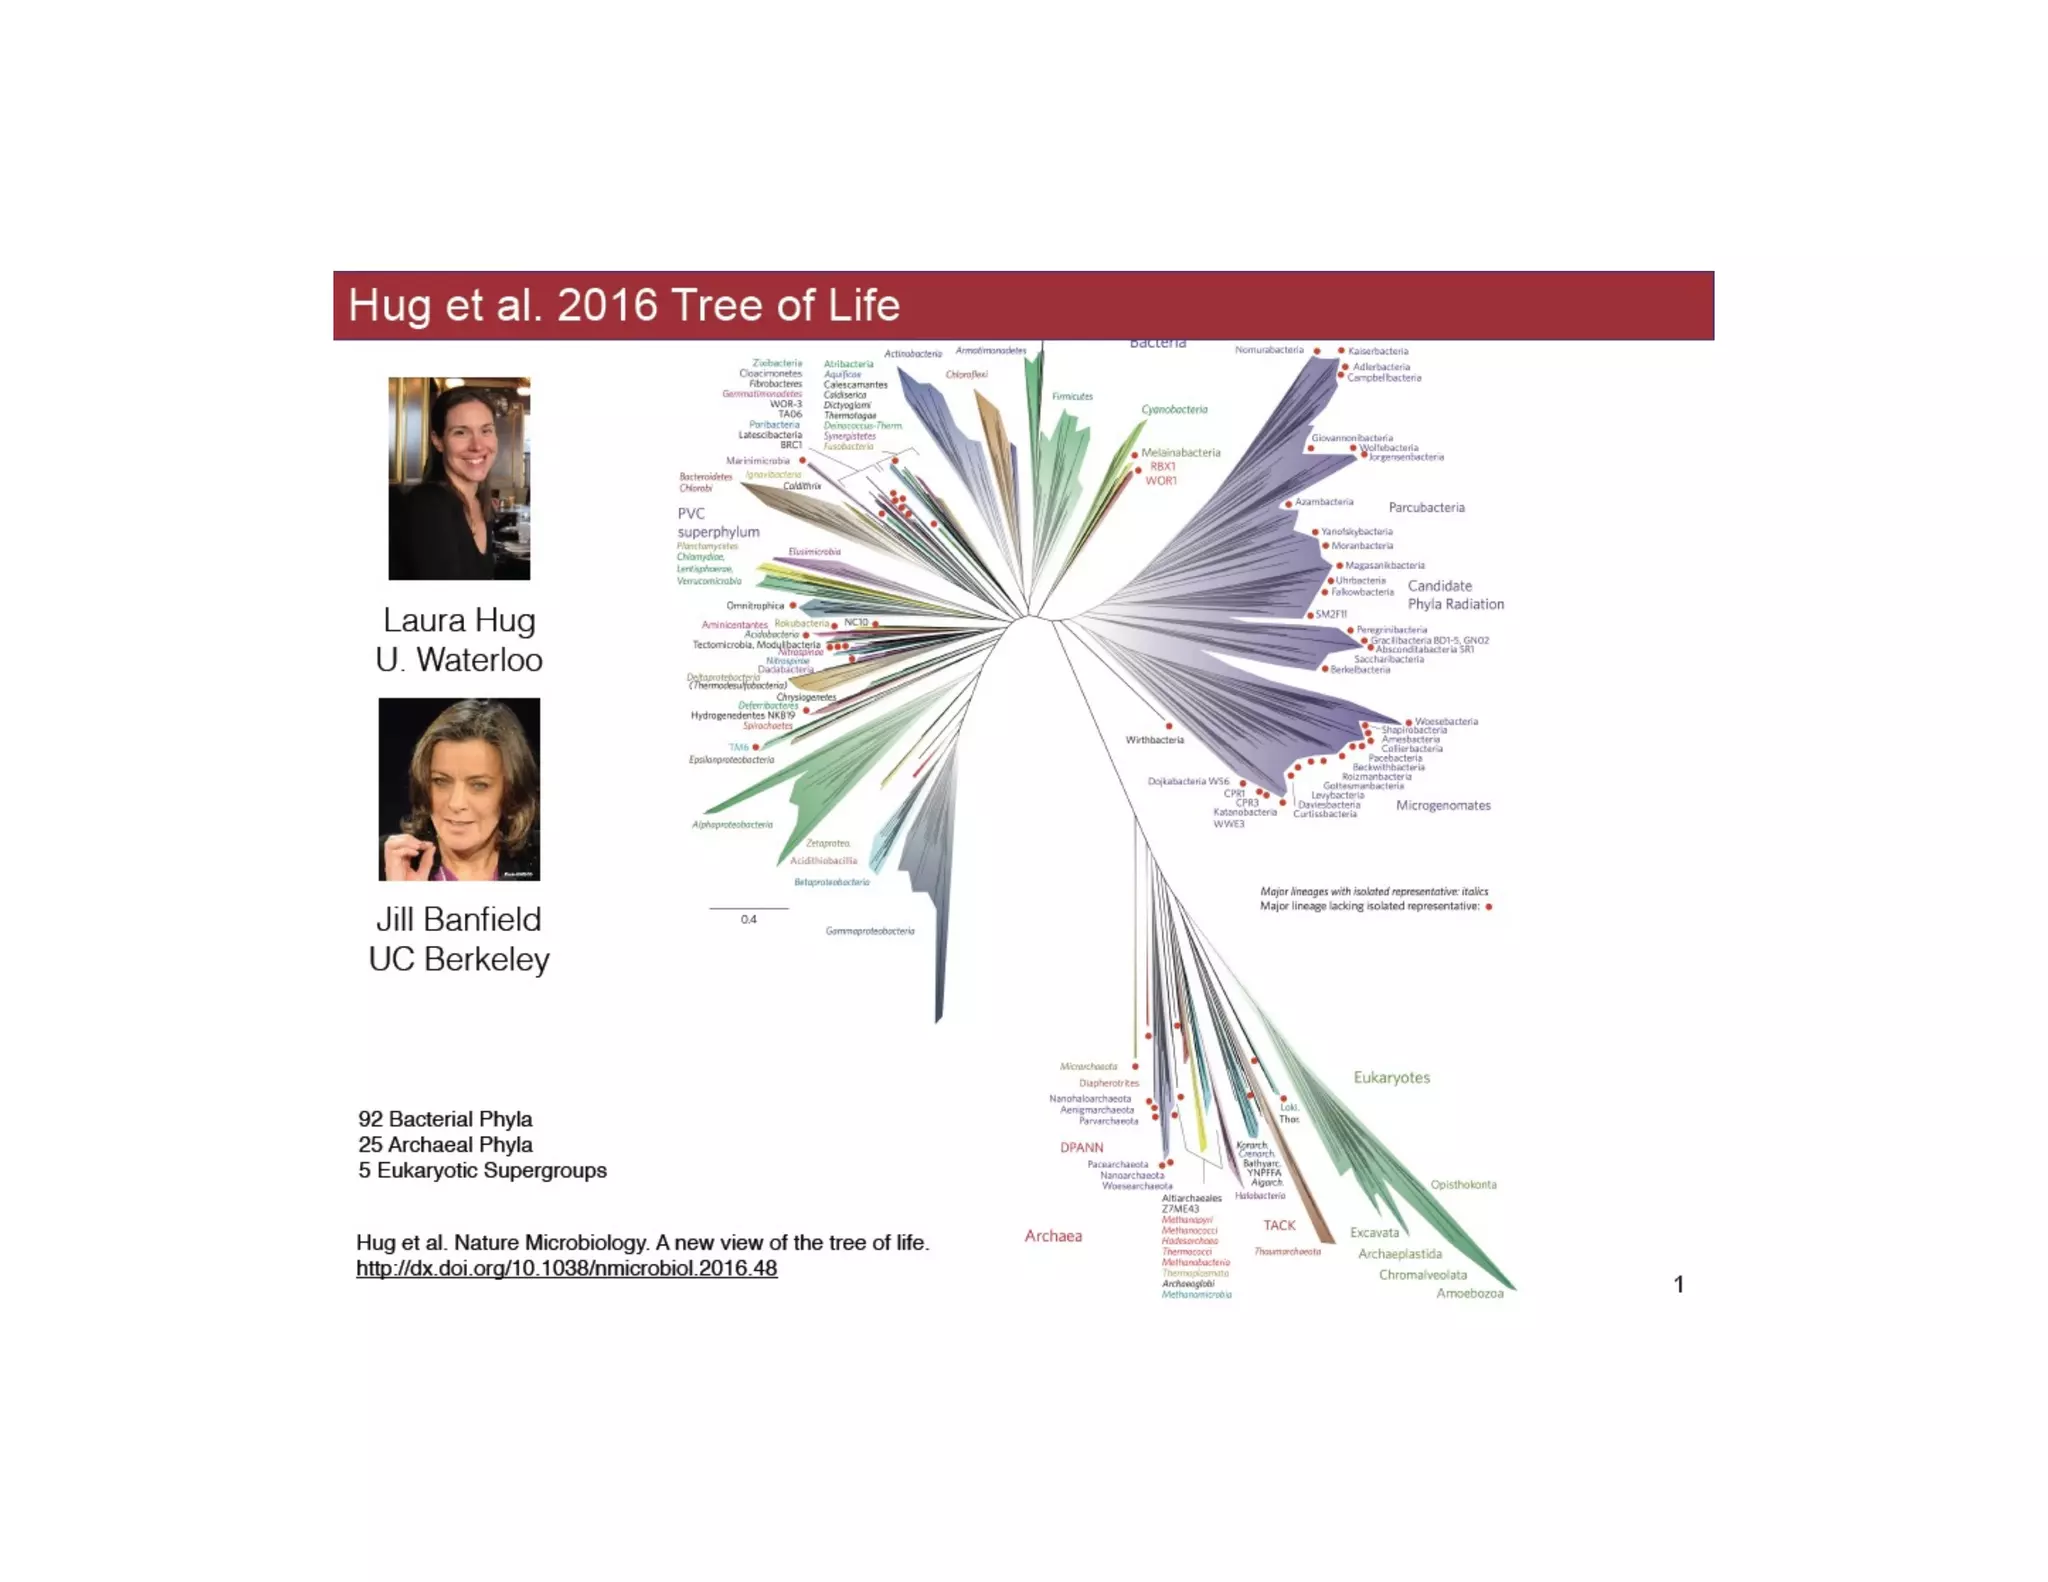
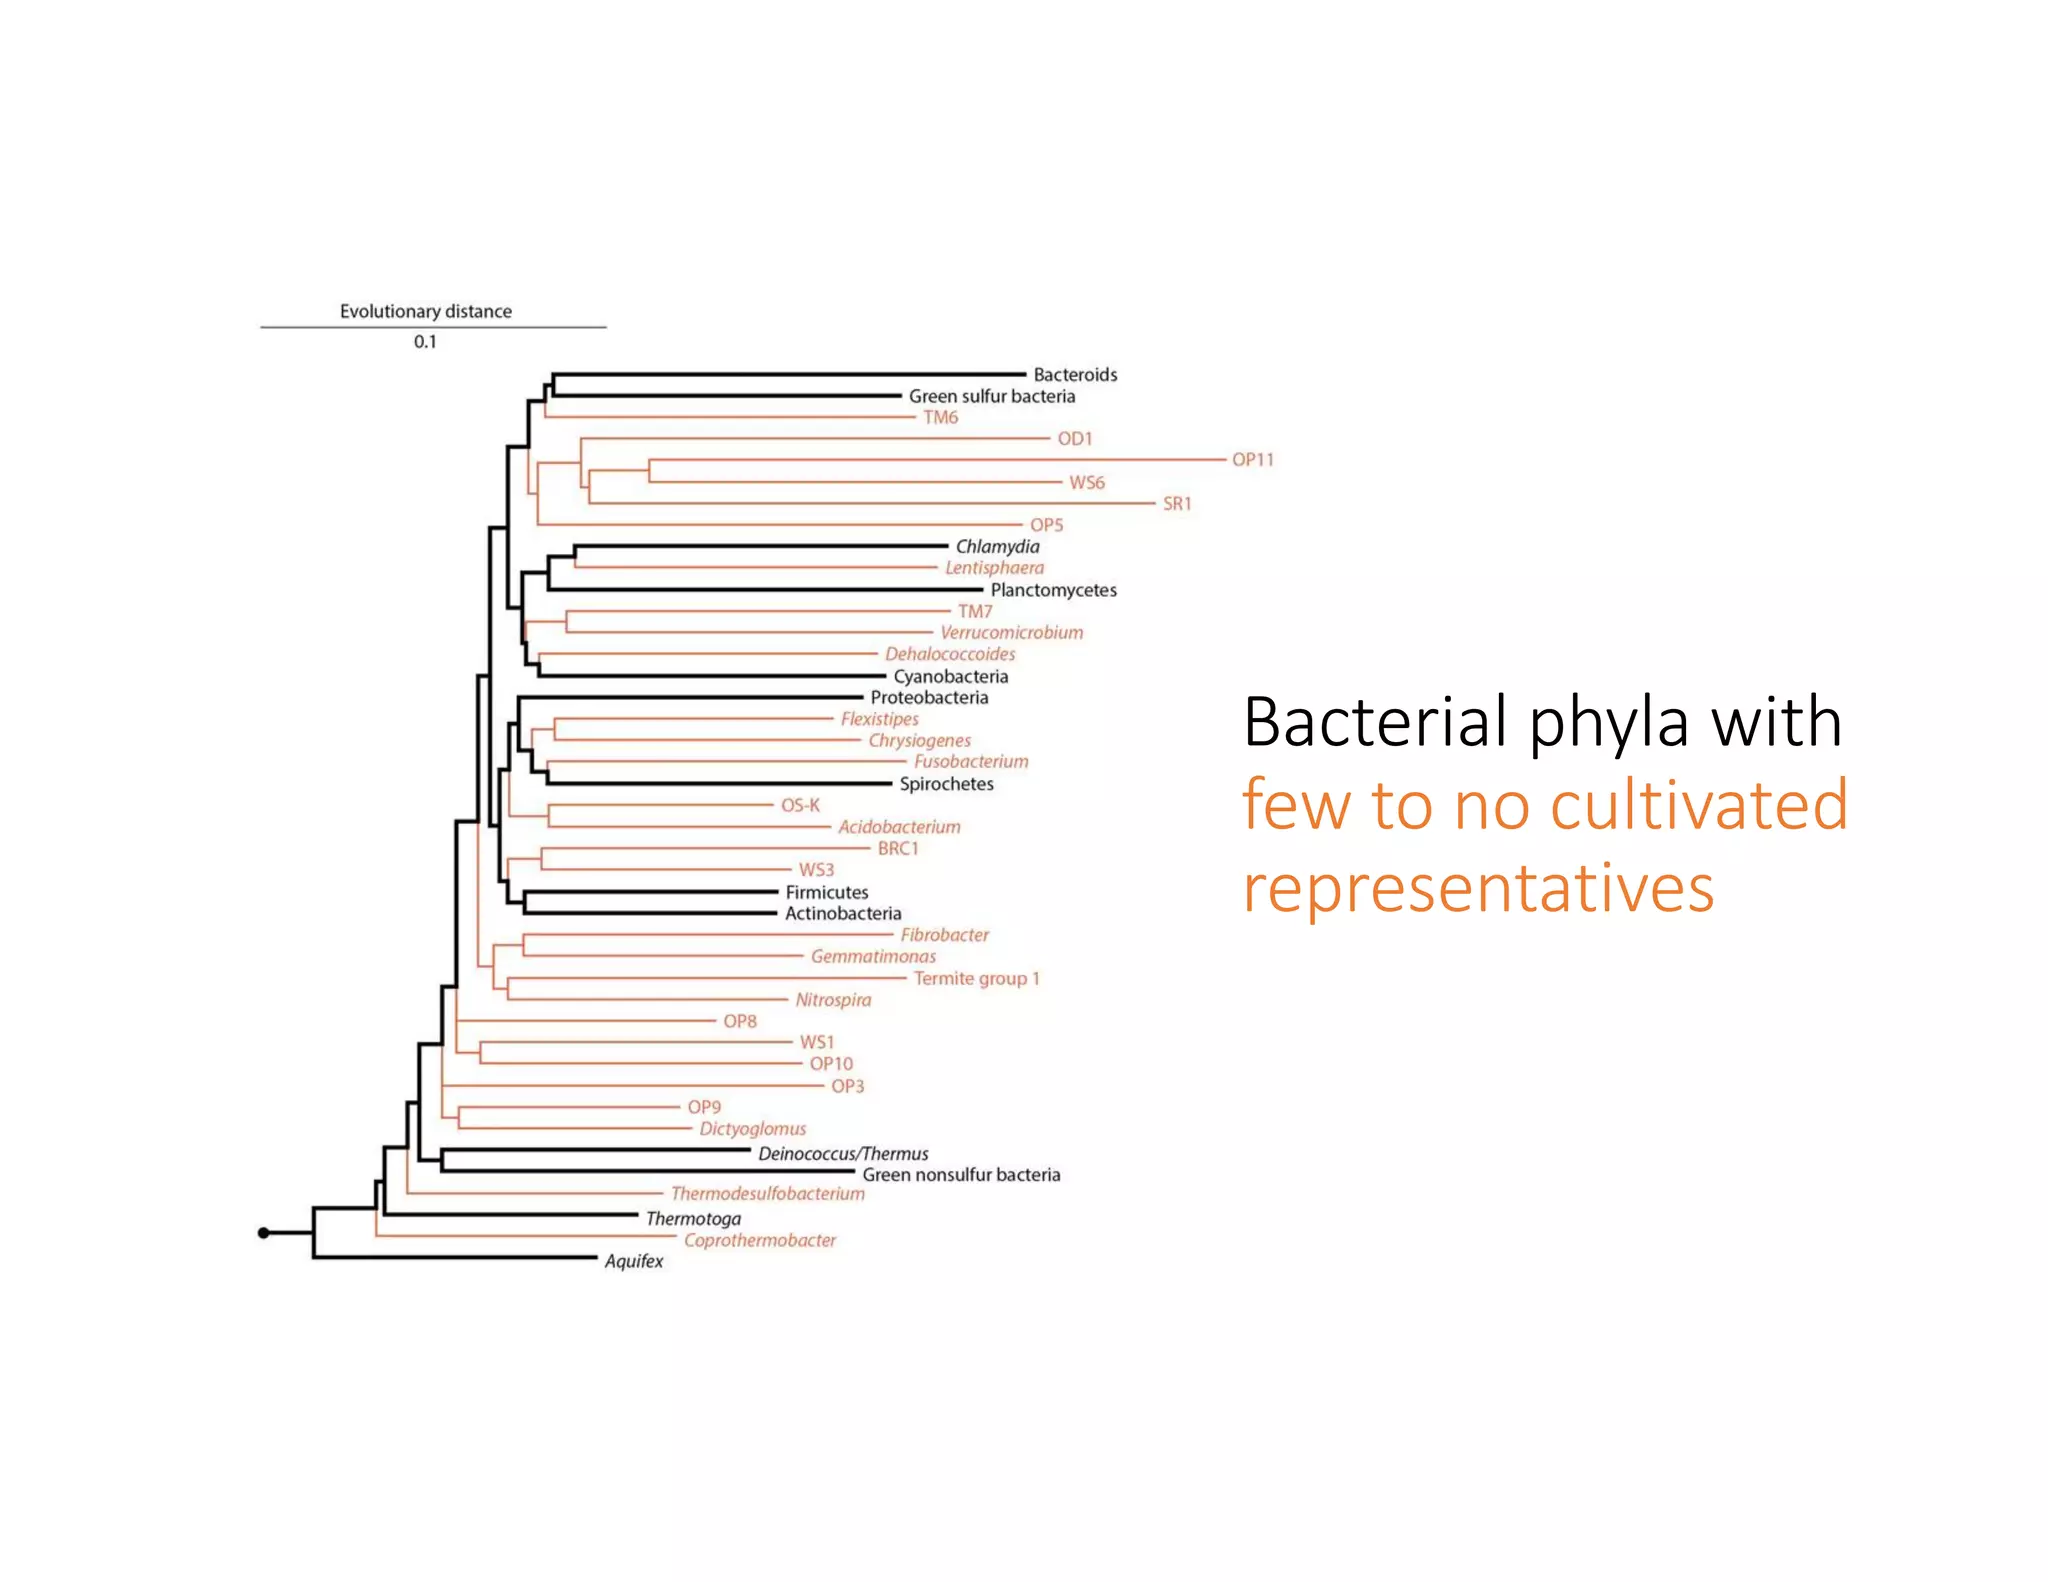
Download as PDF, PPTX


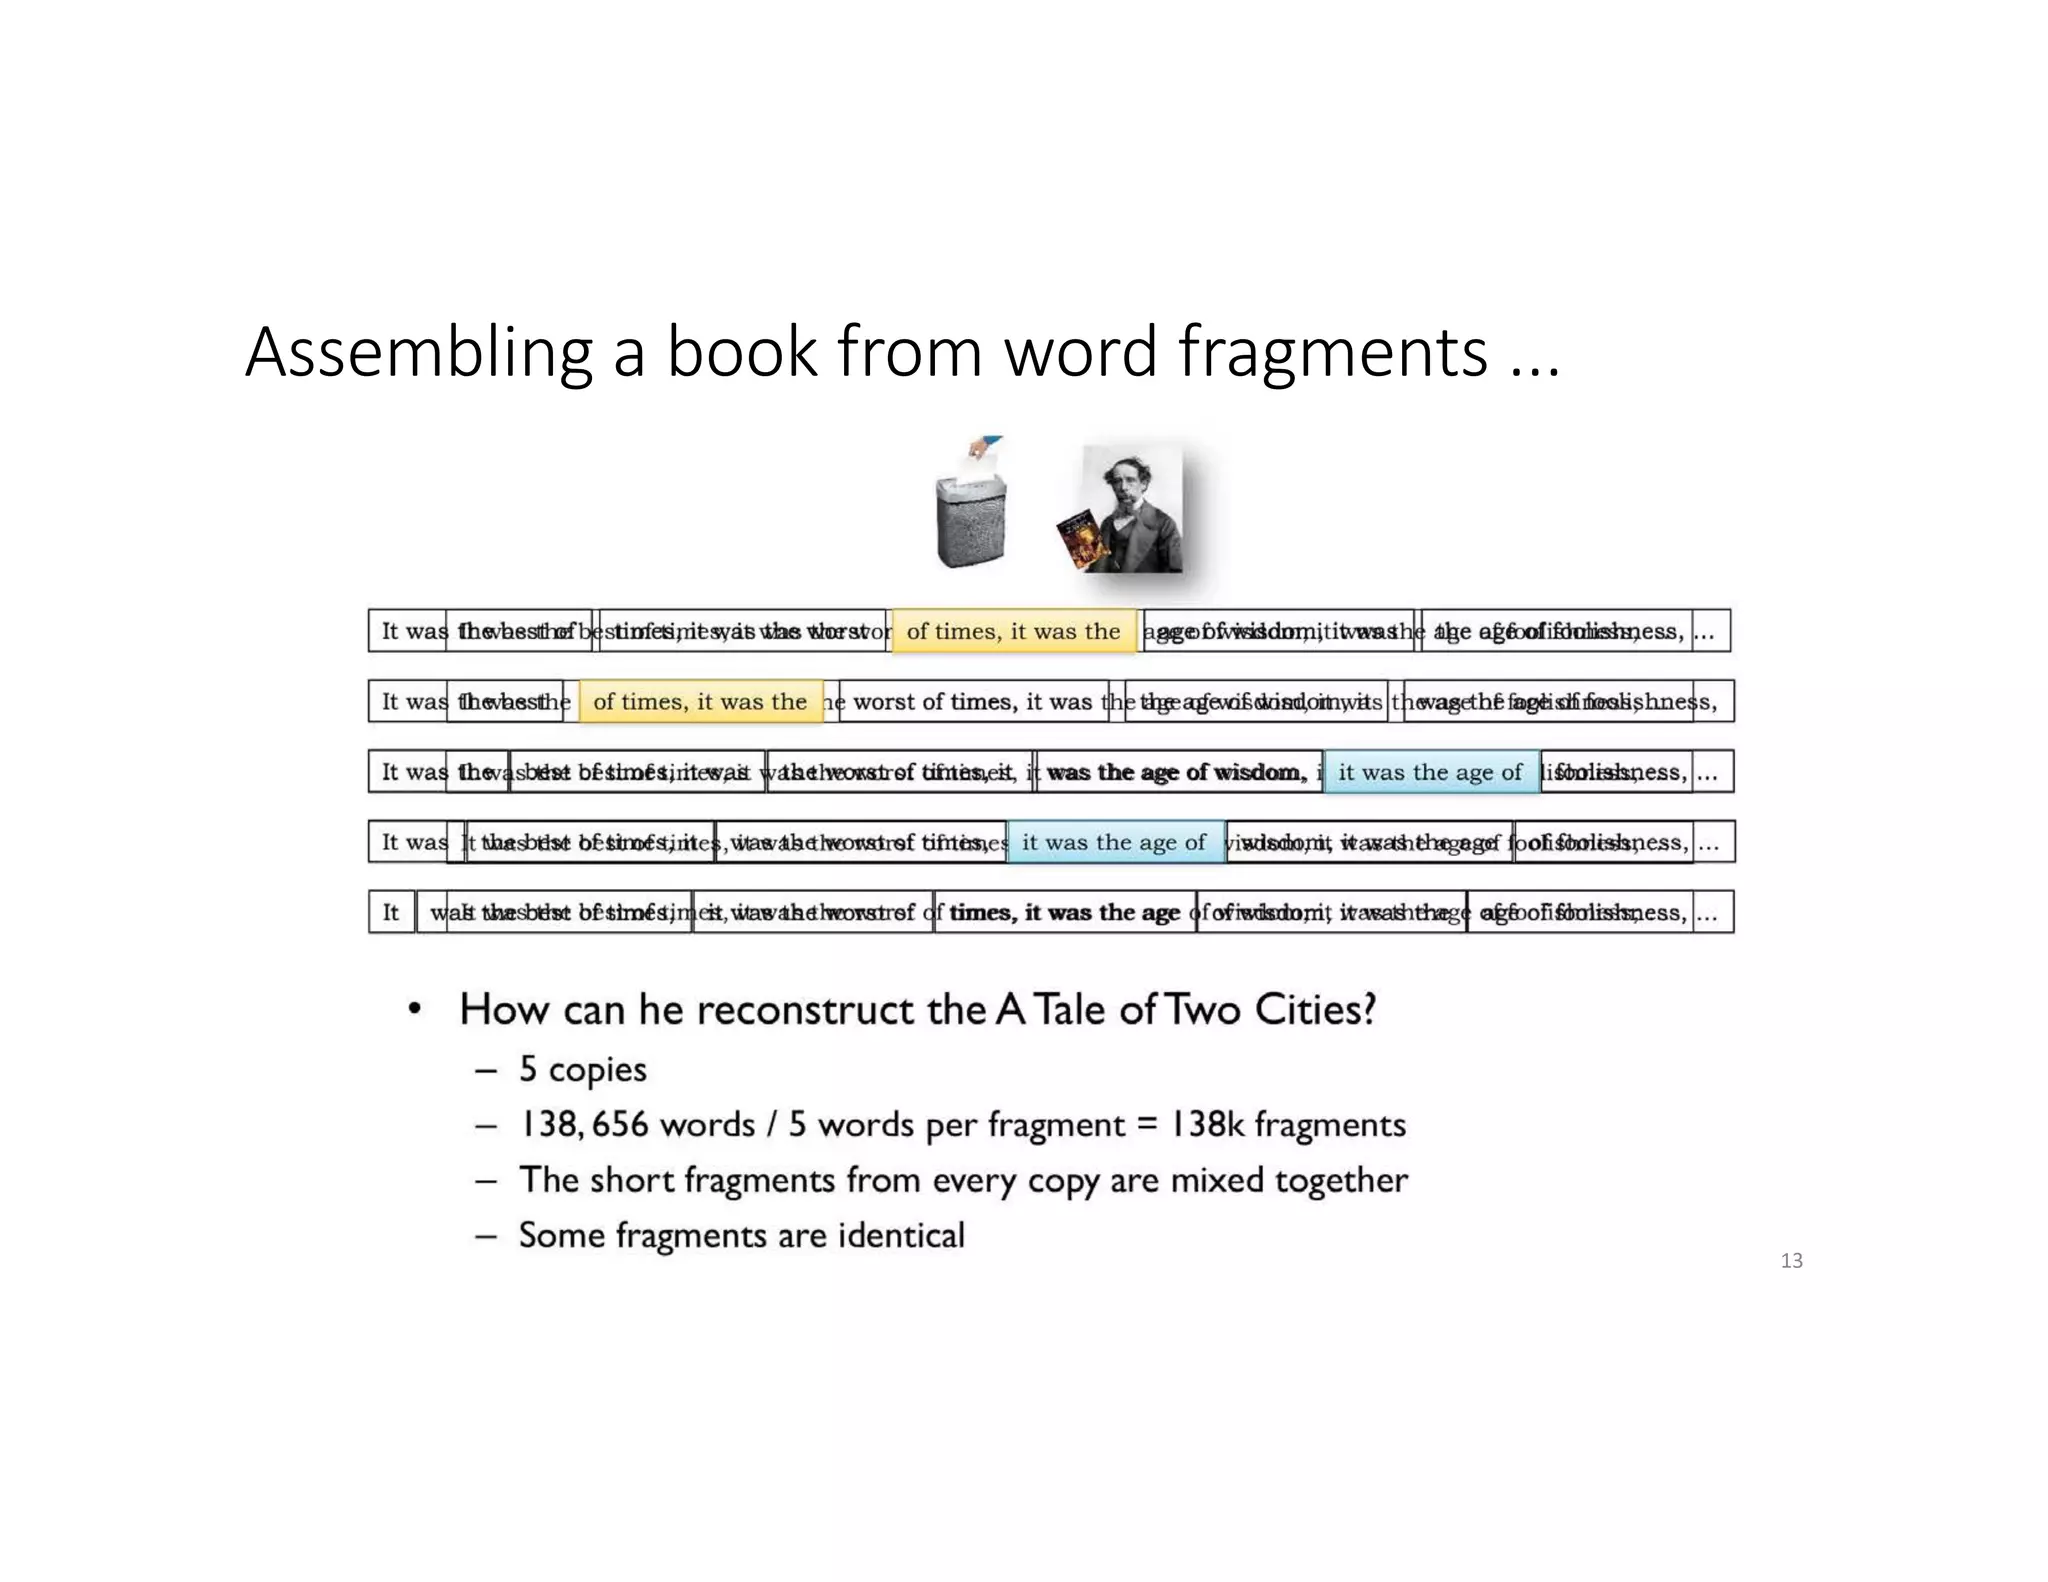
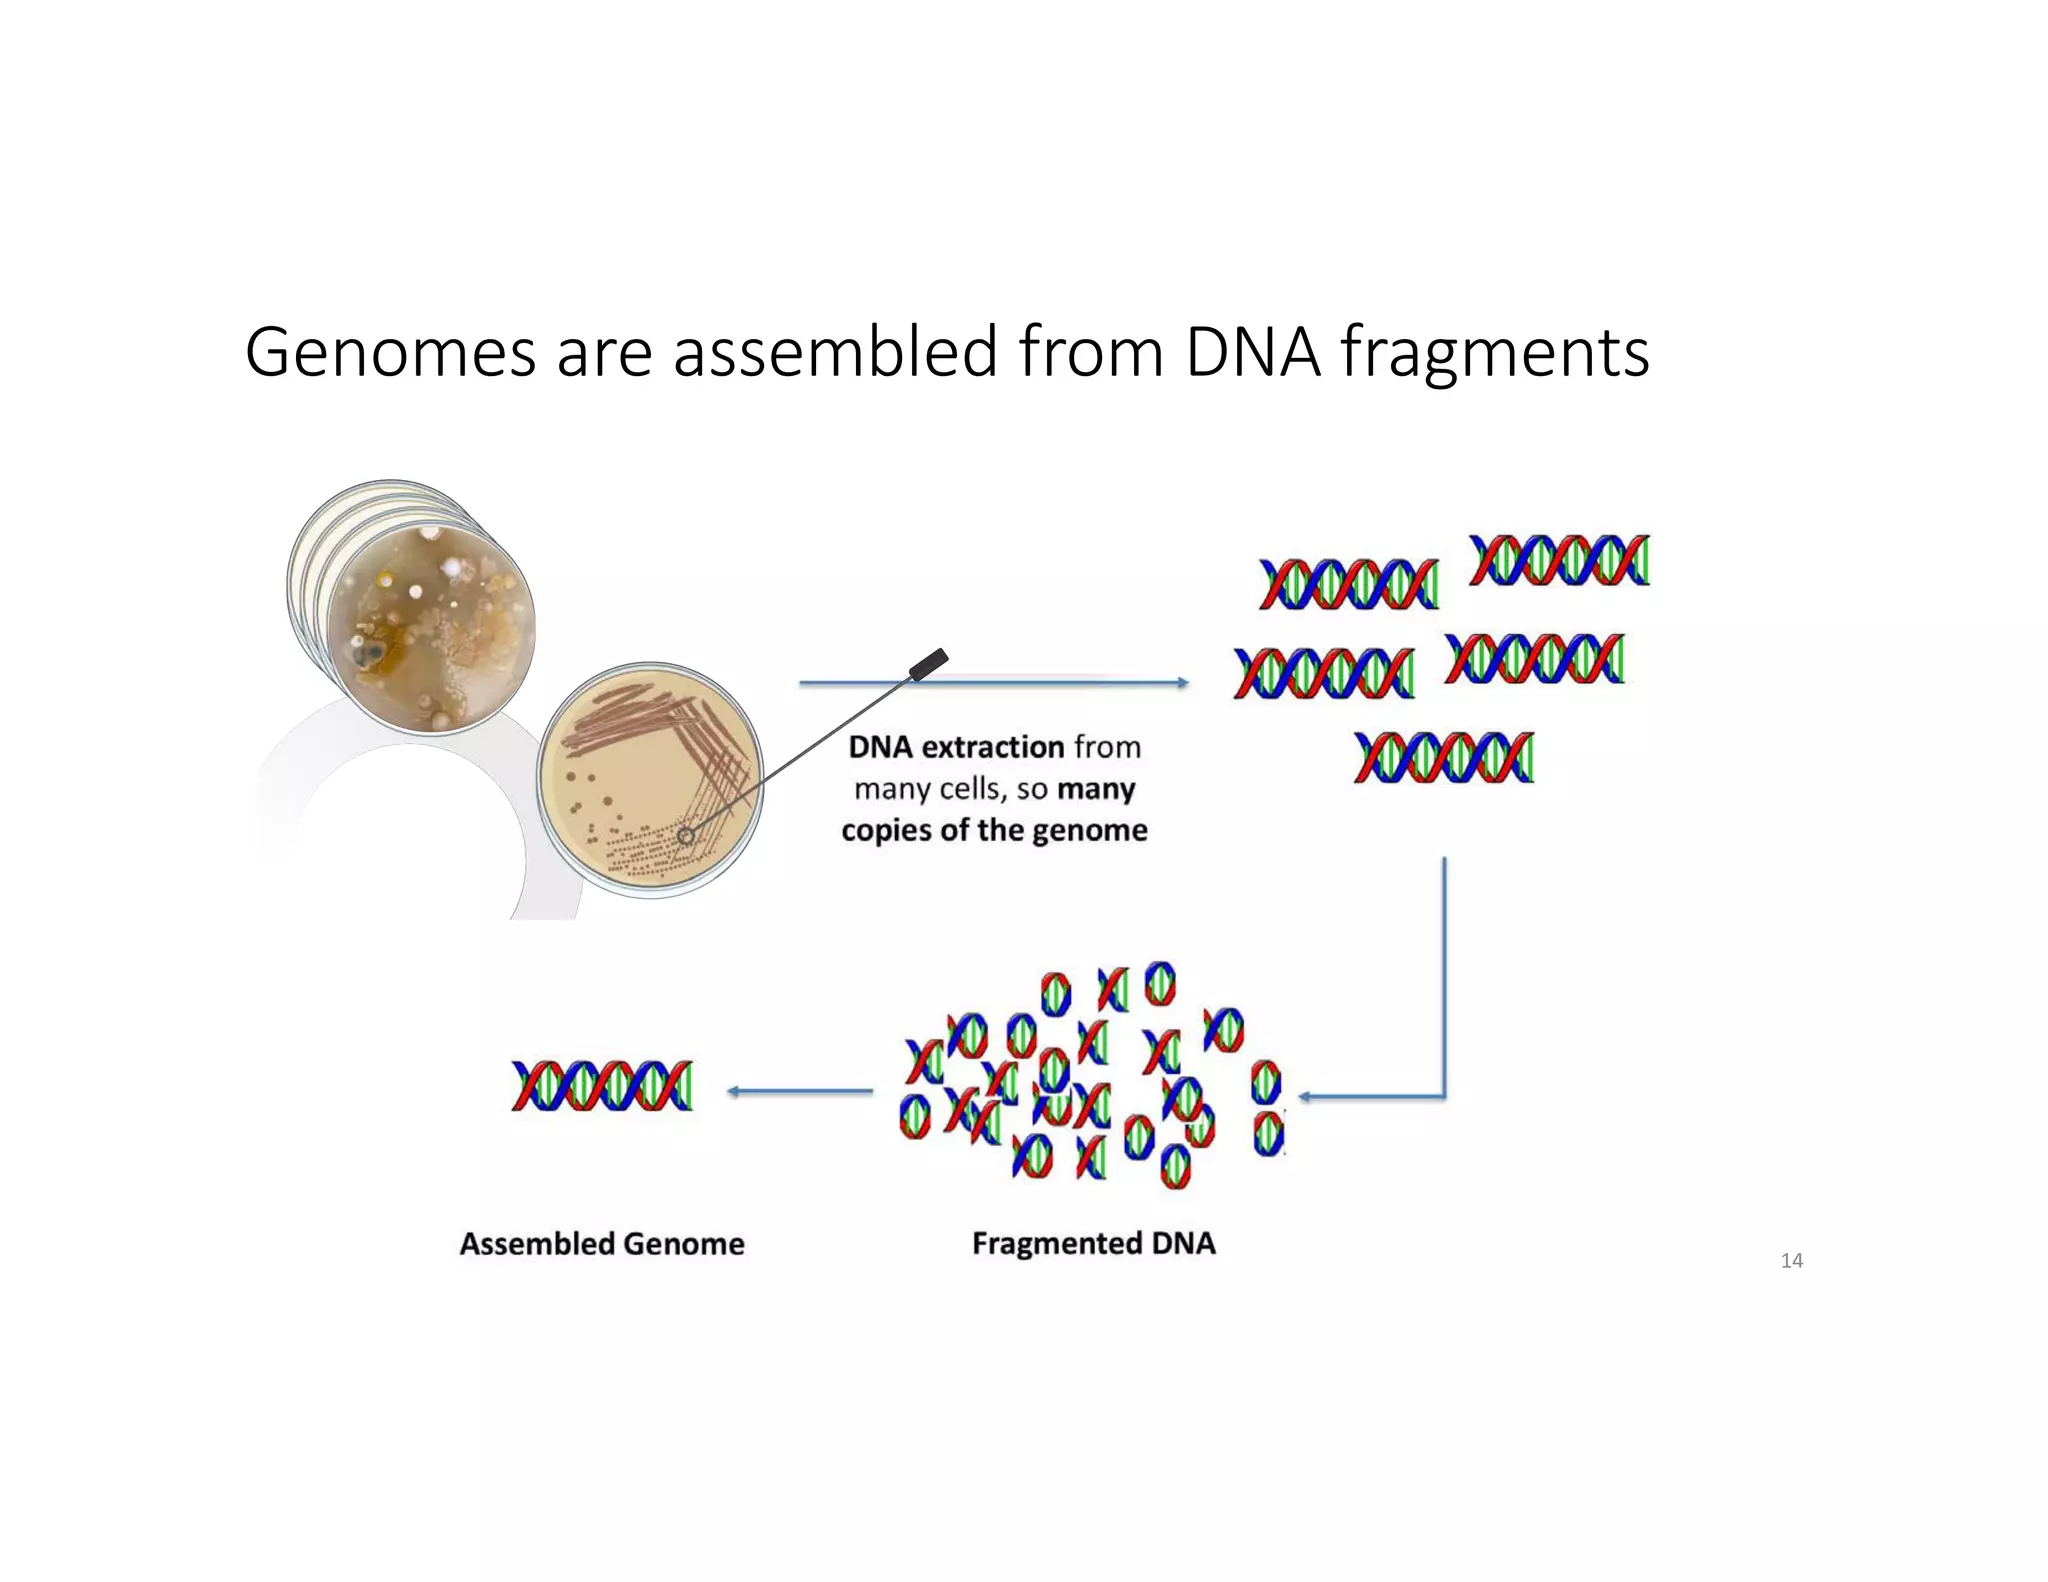
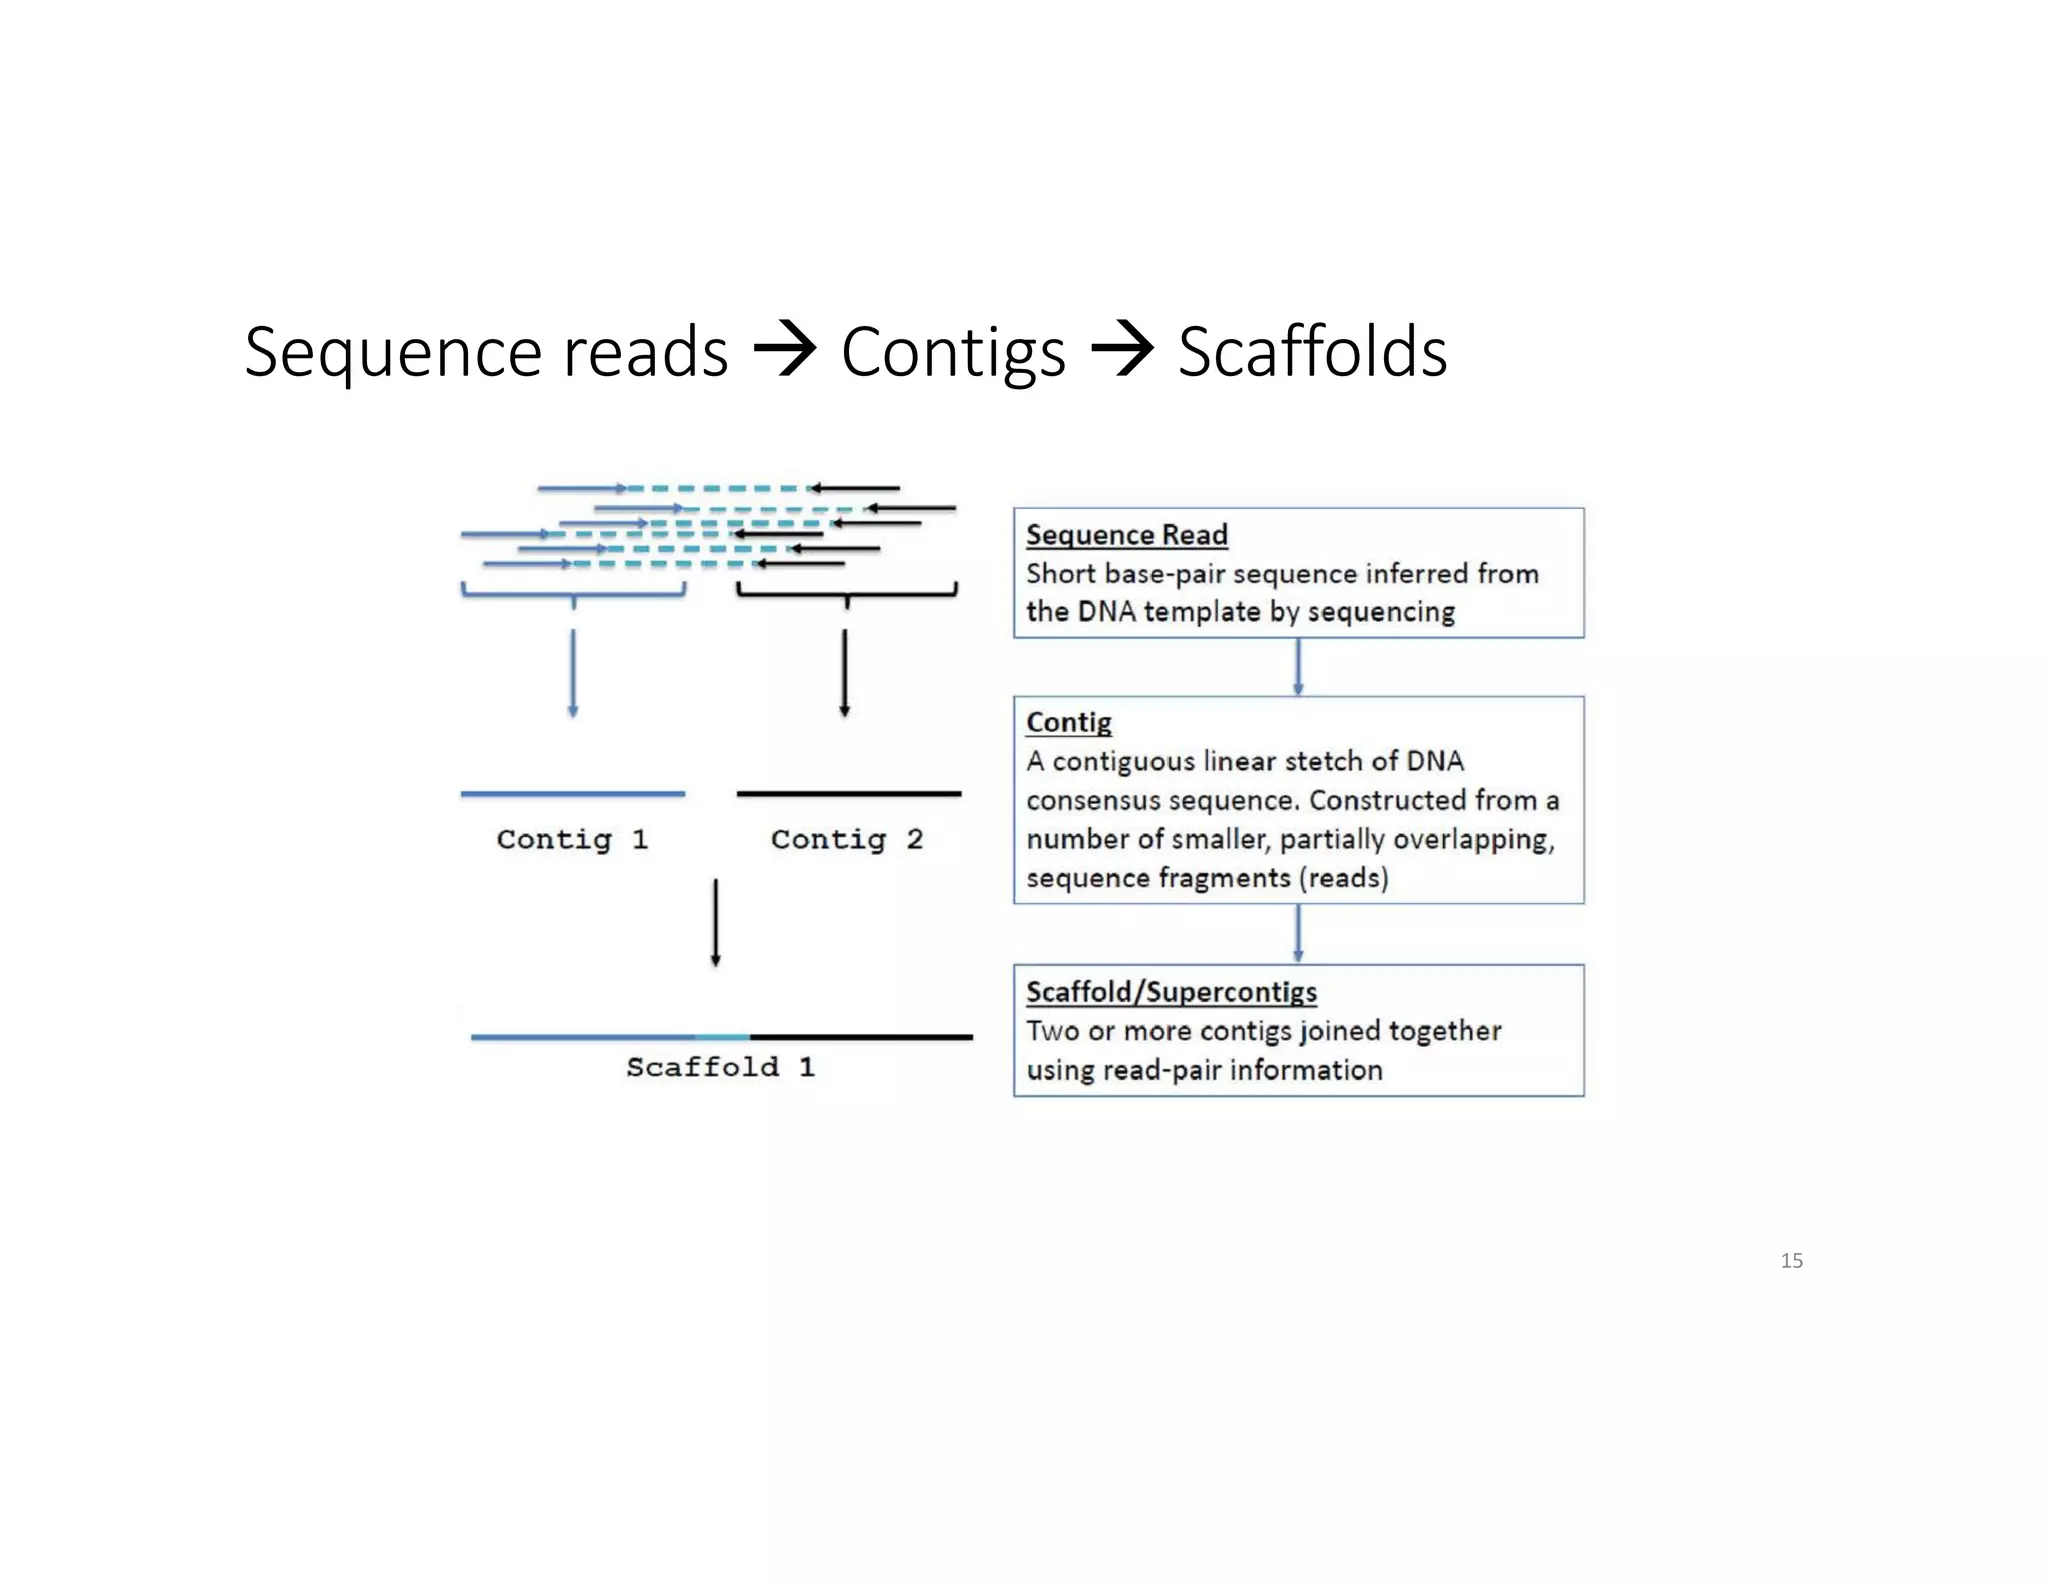
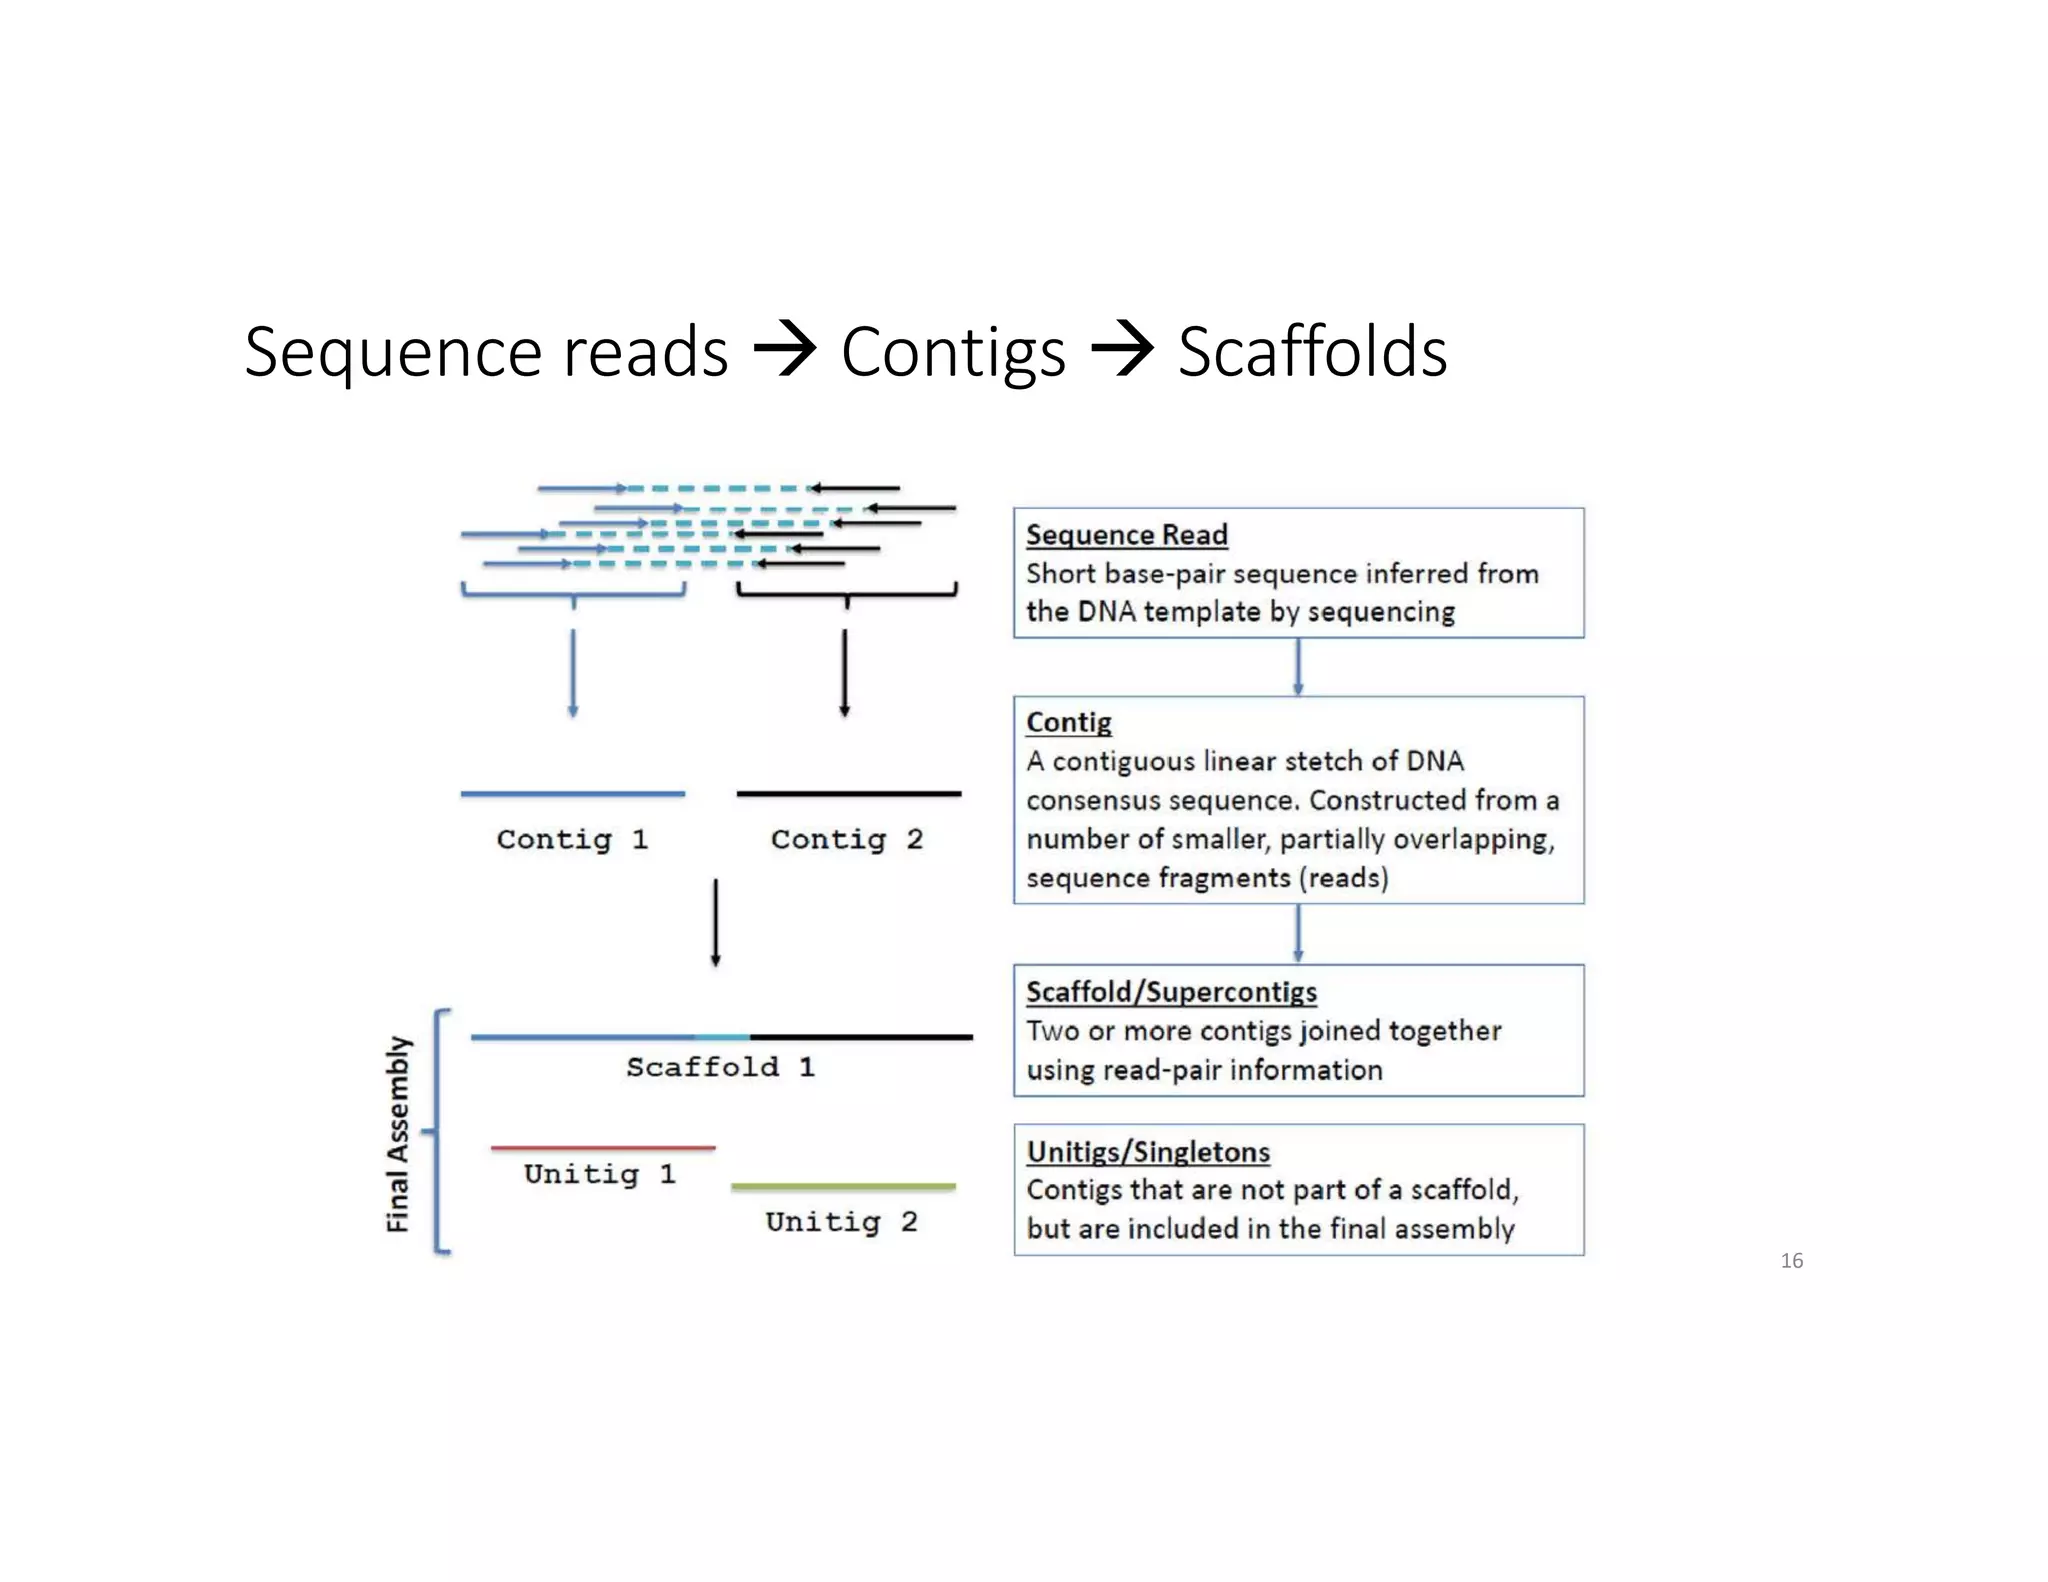
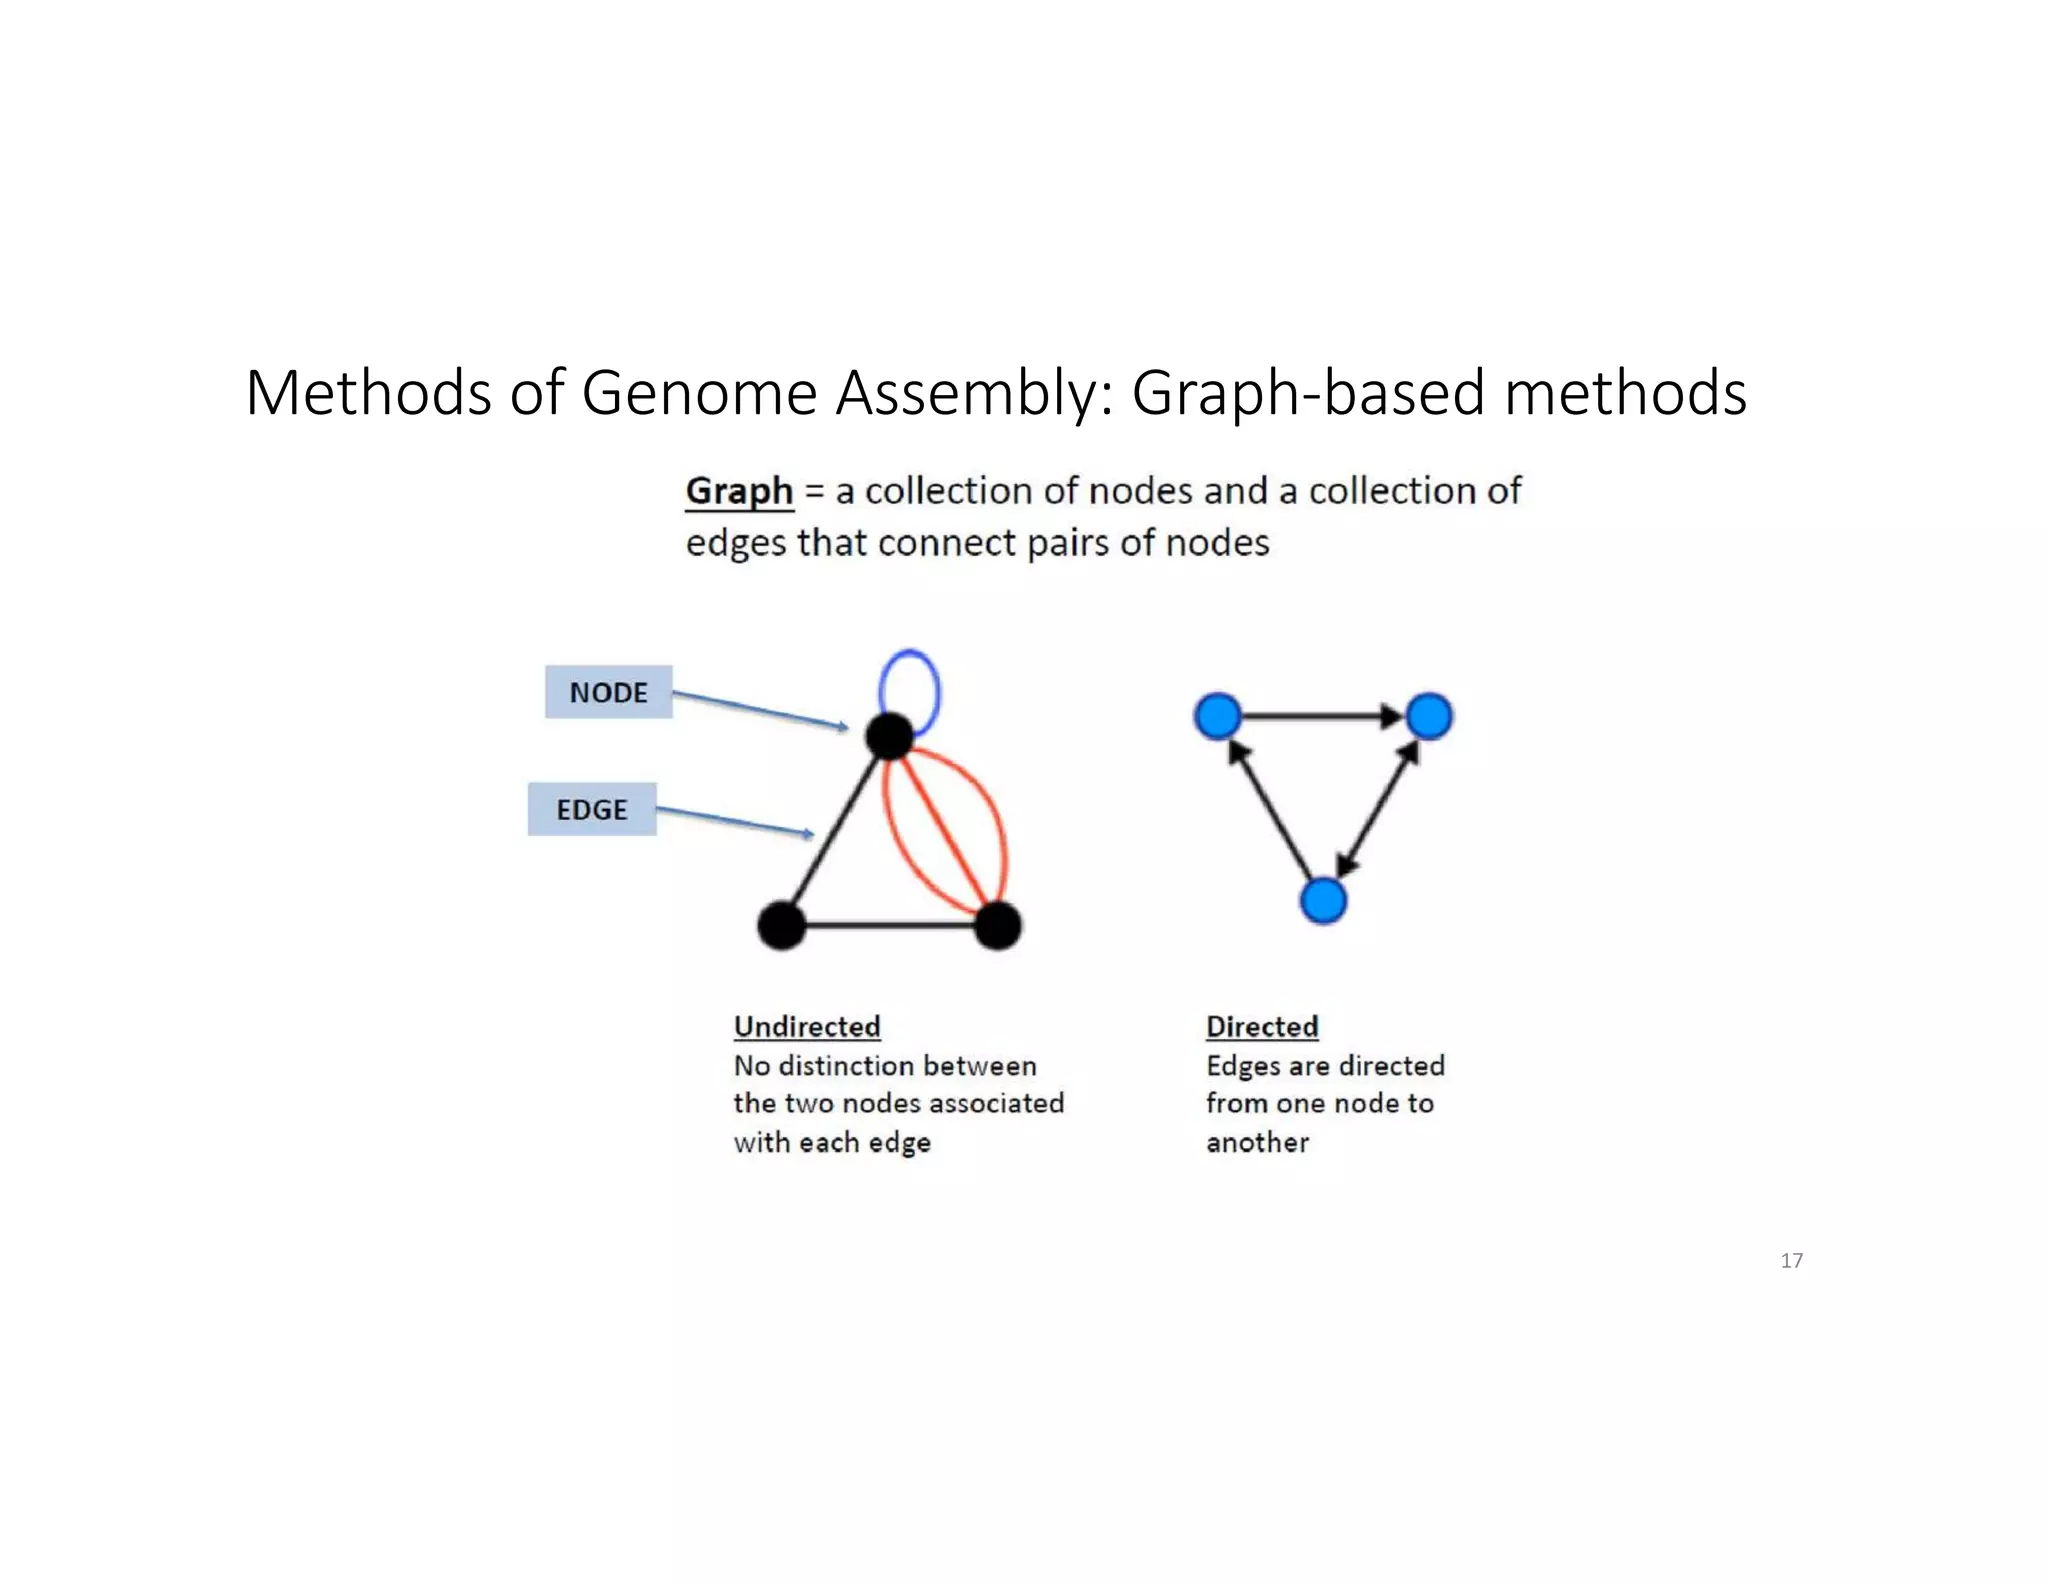
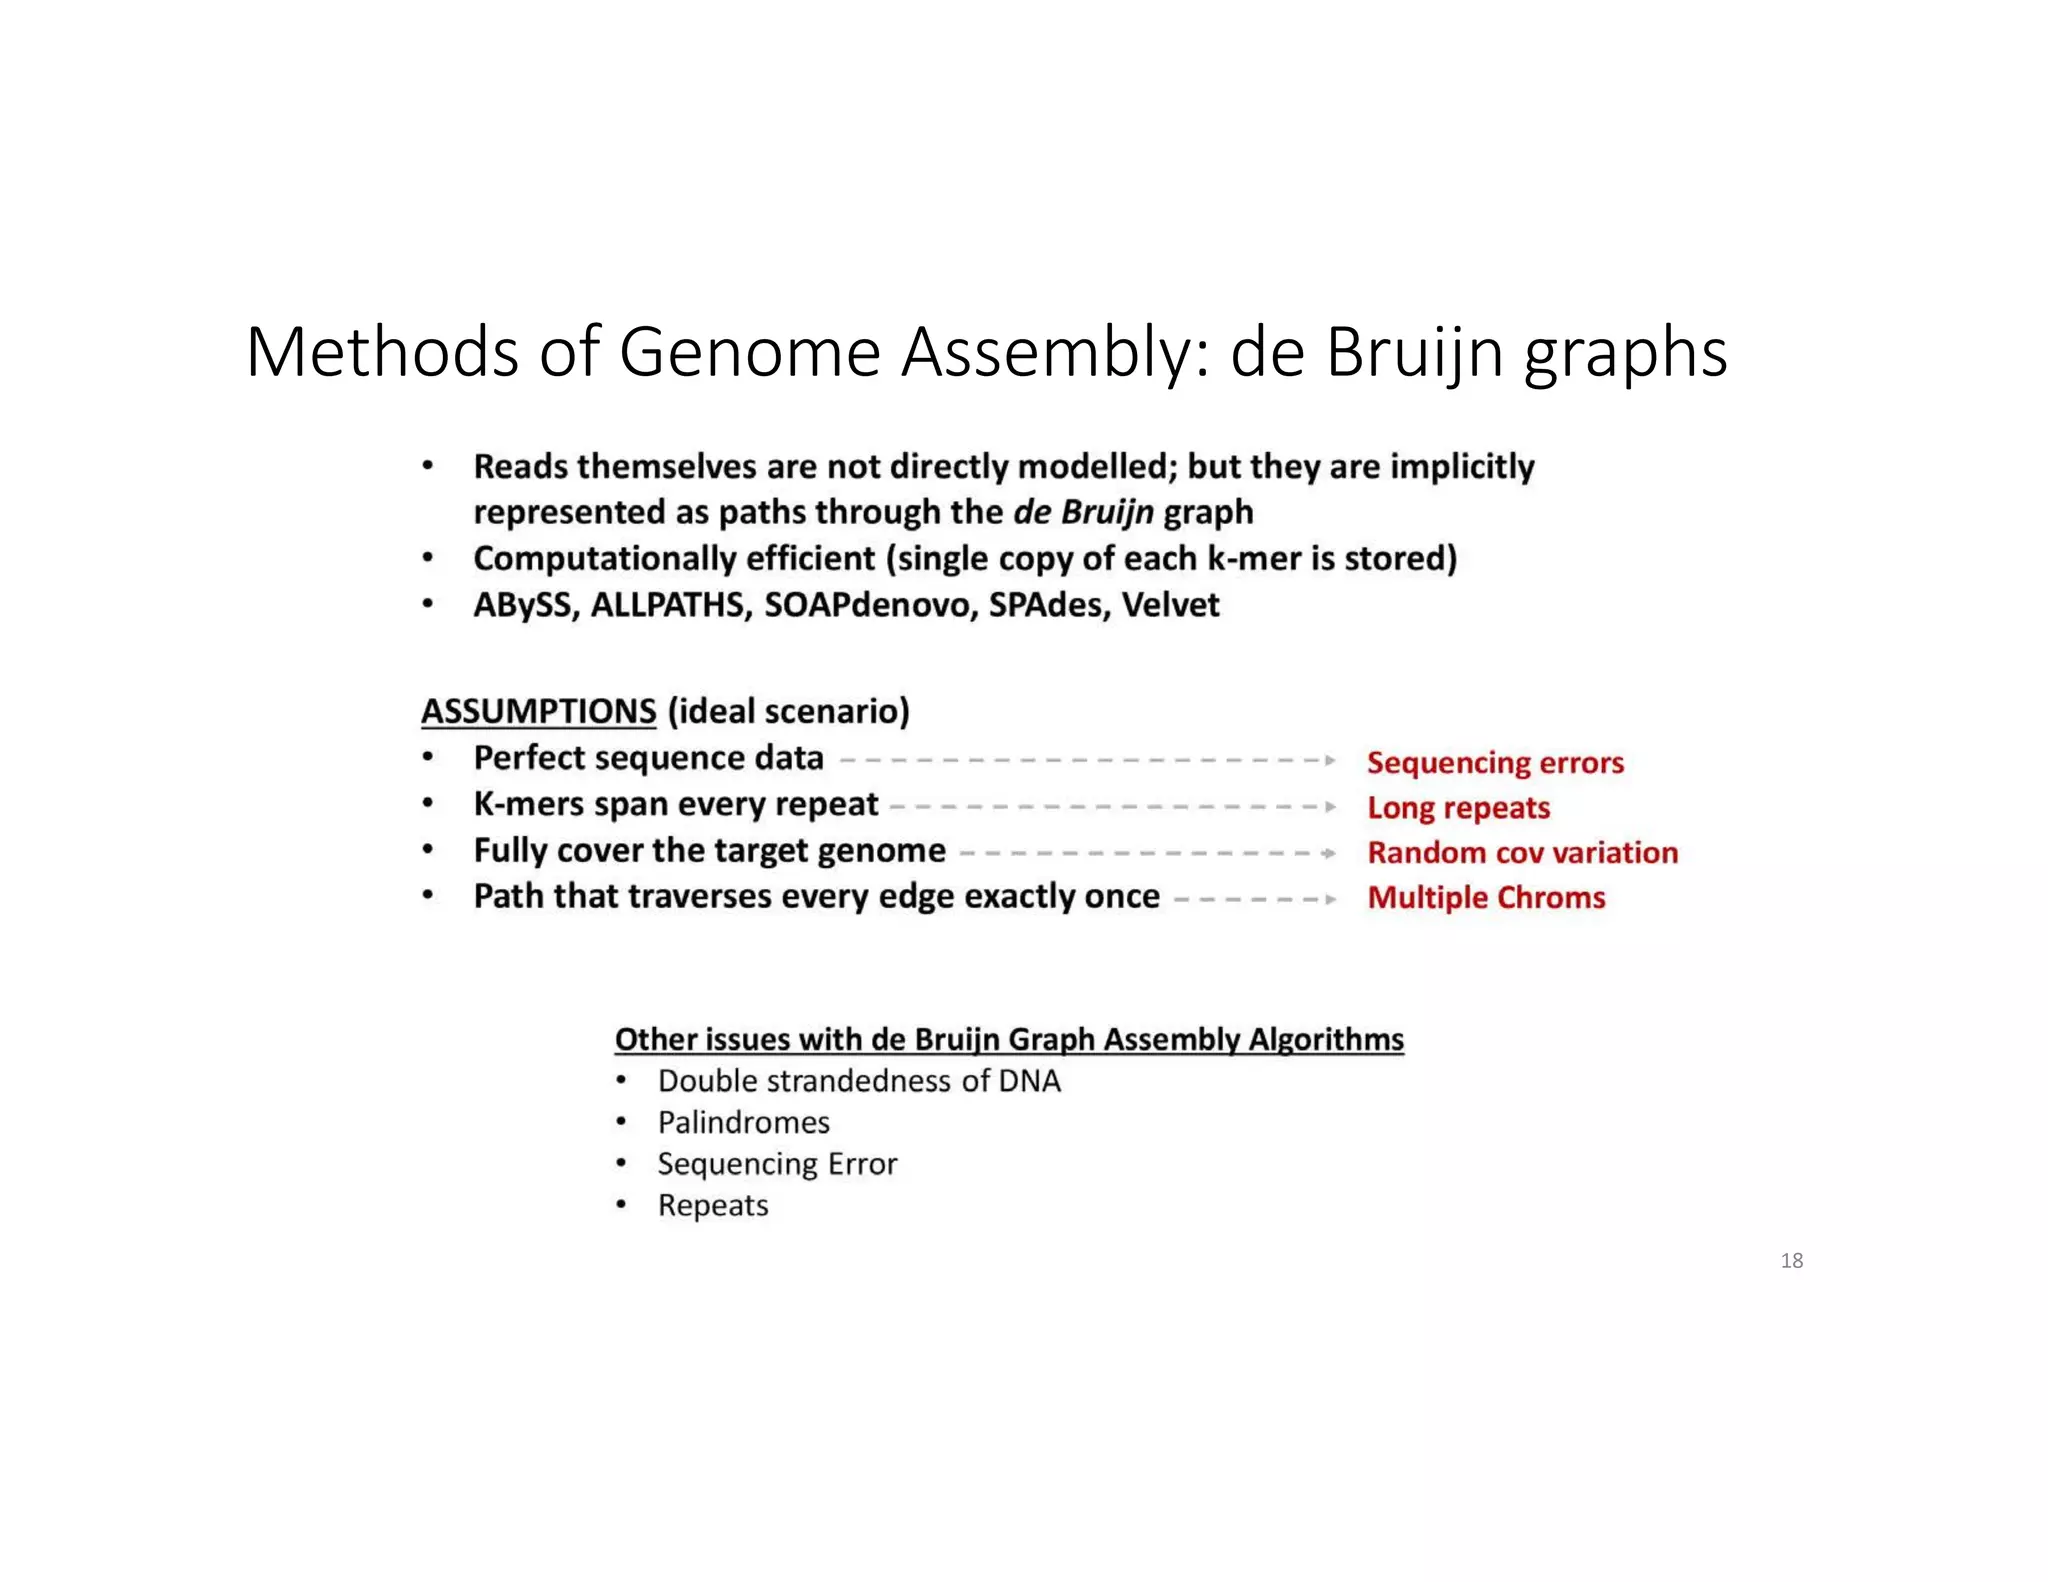
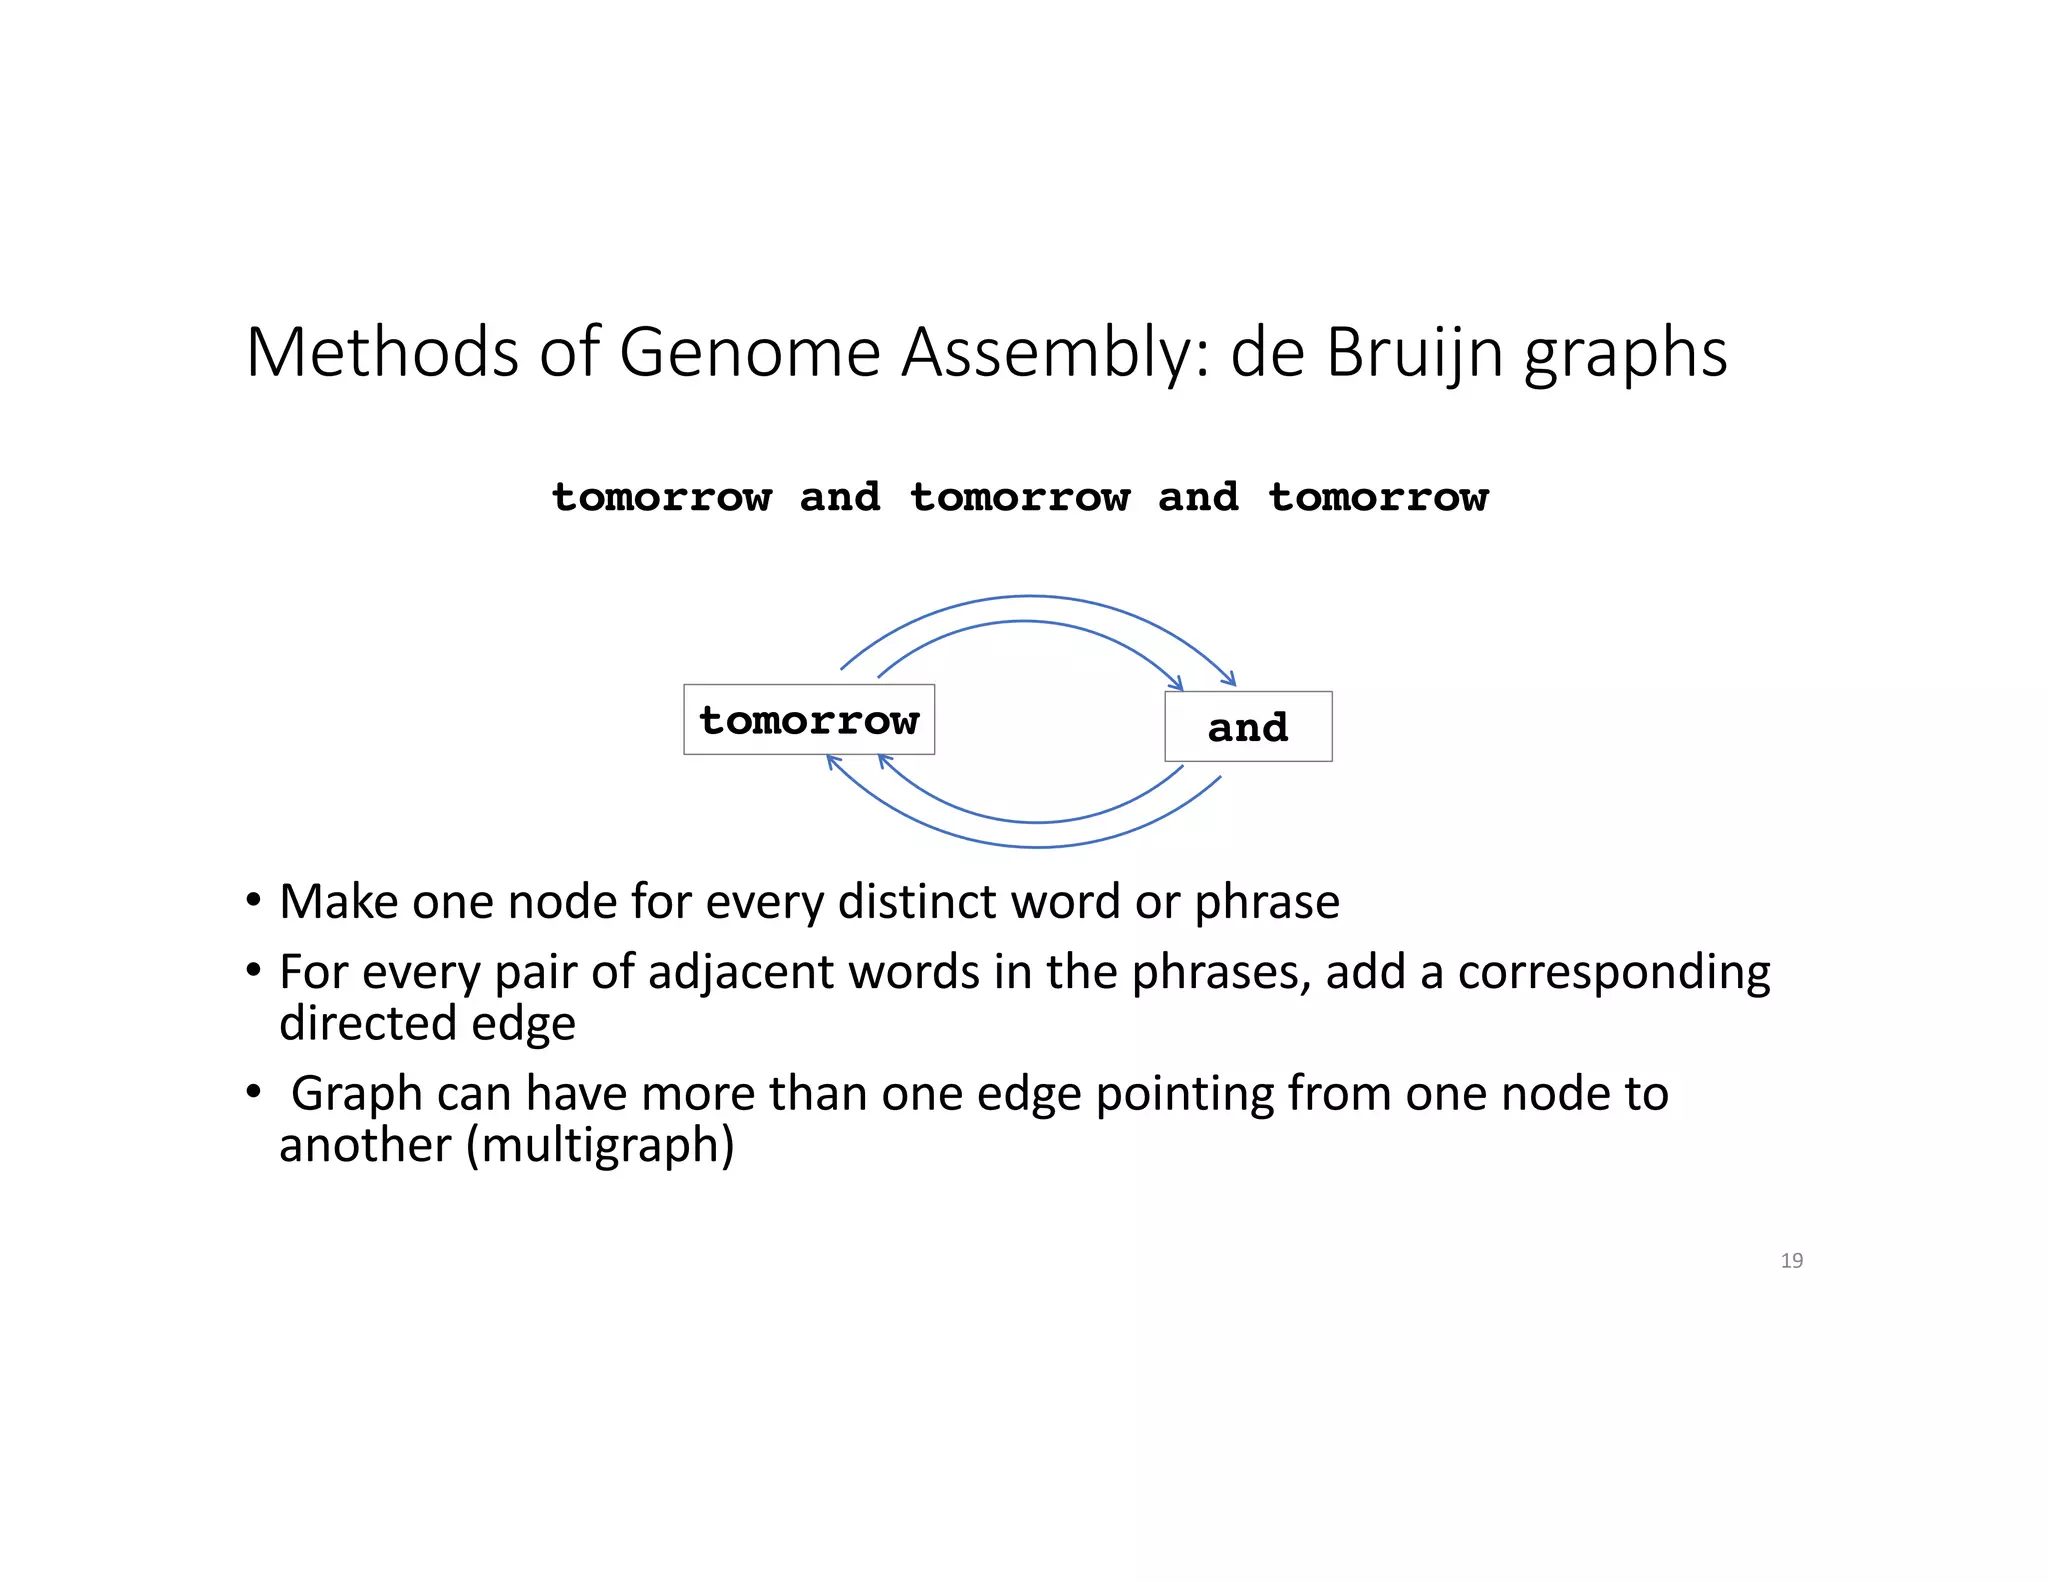
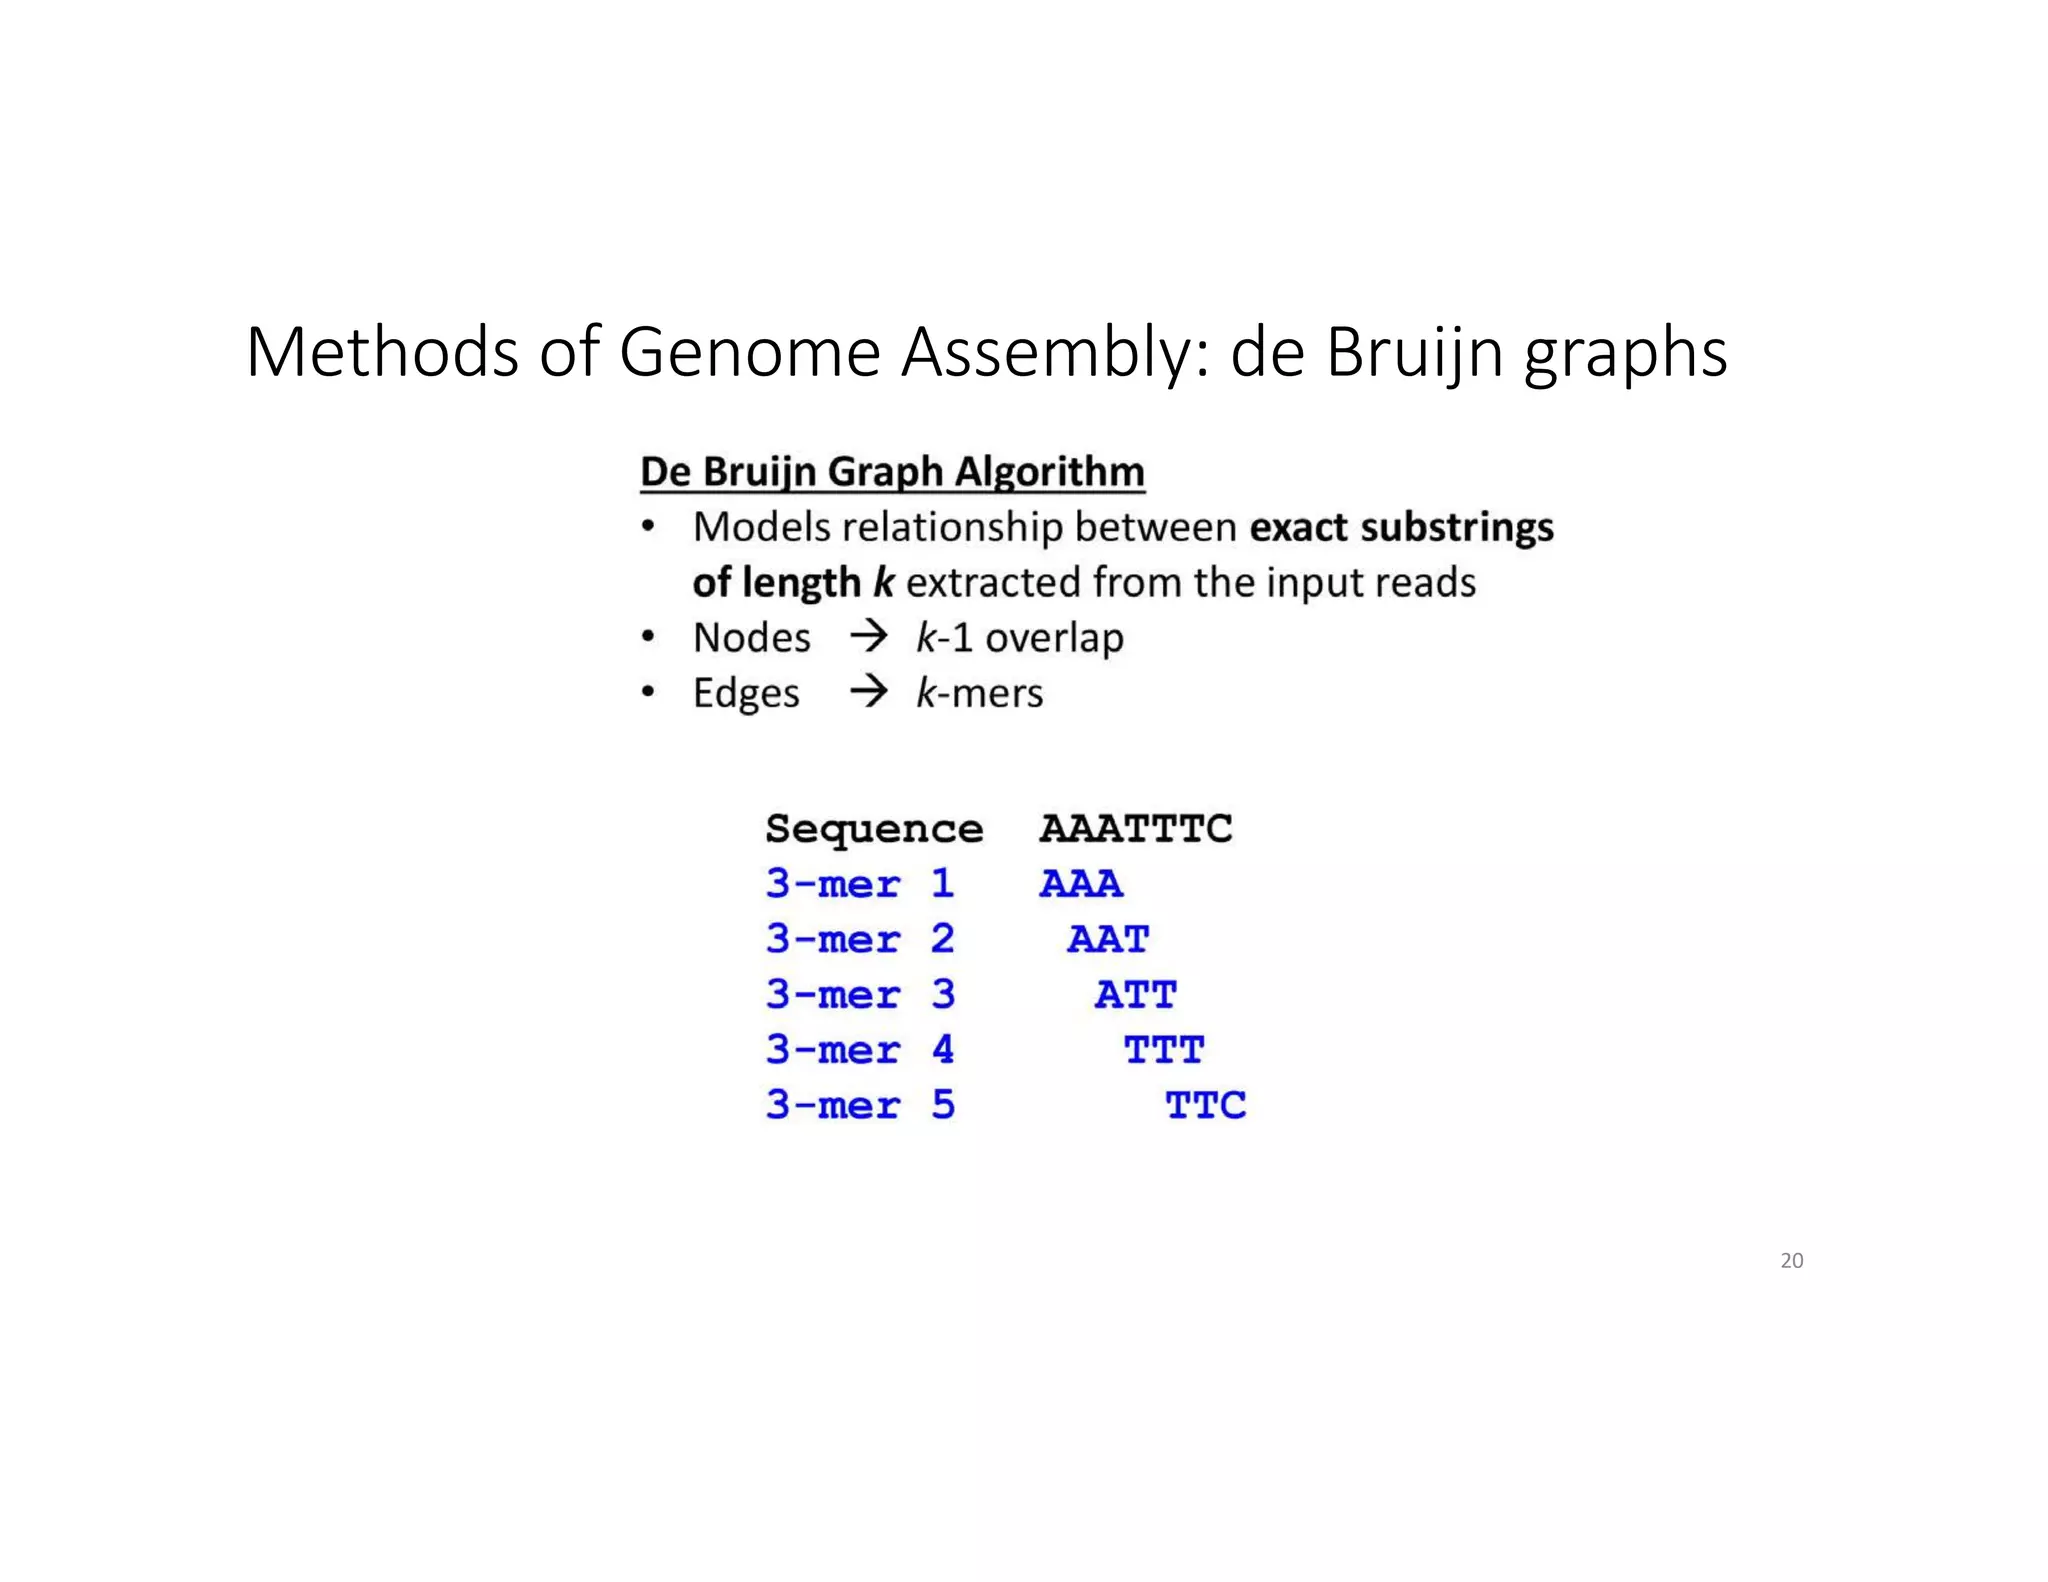
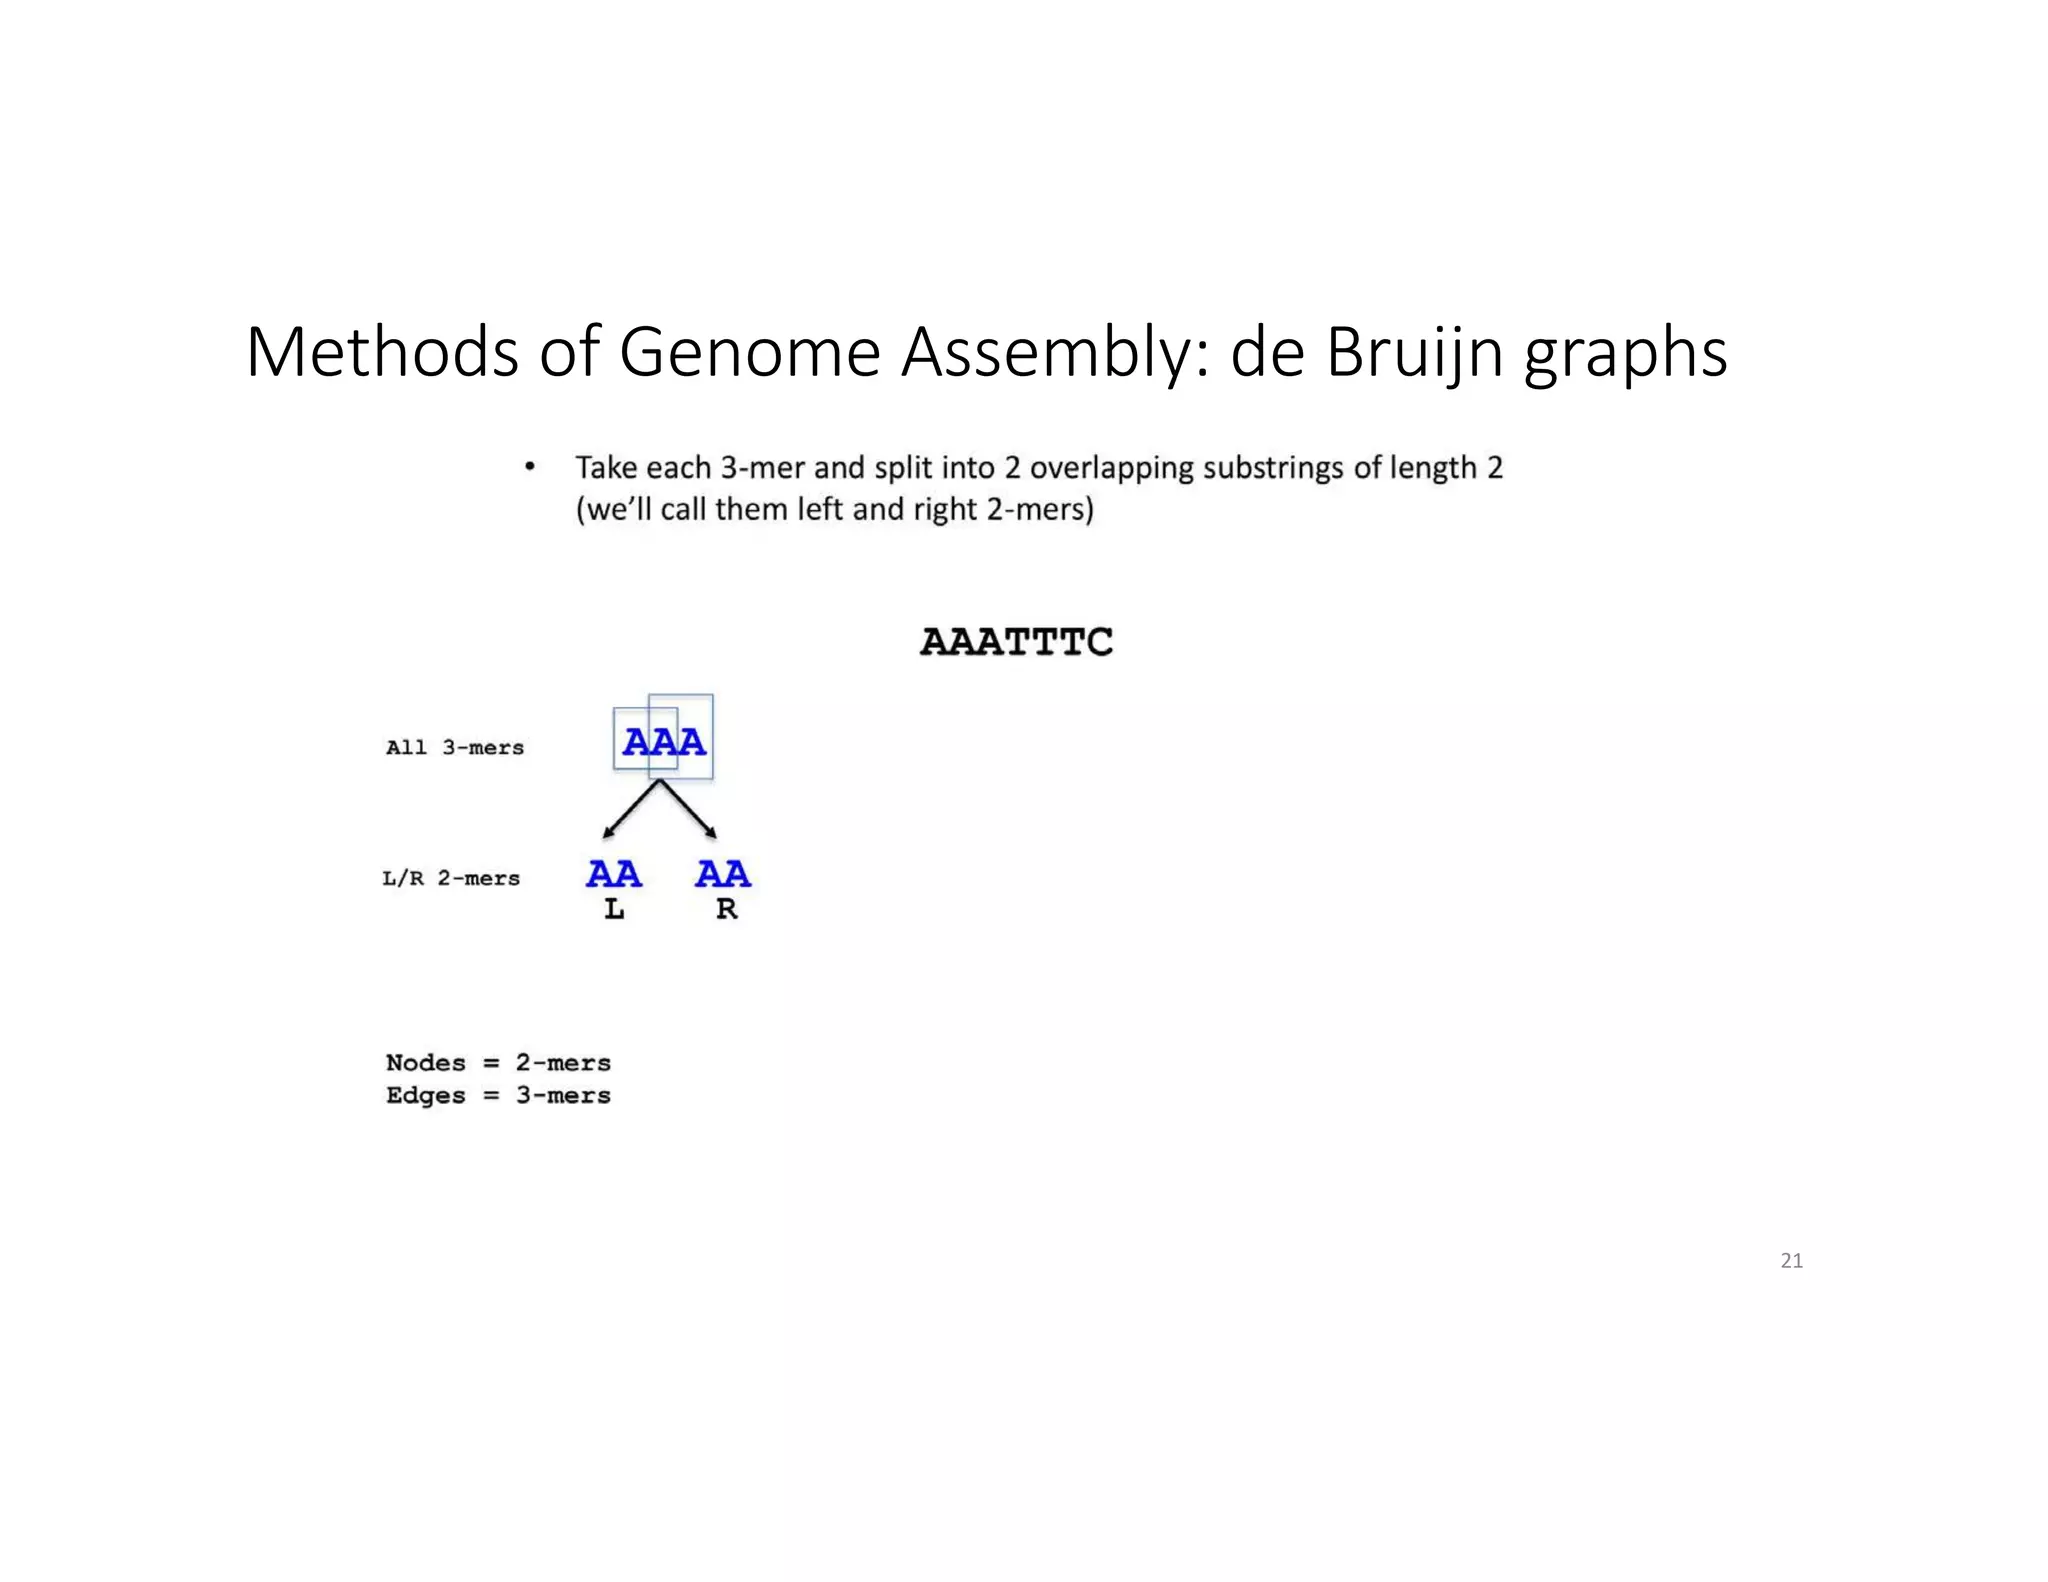
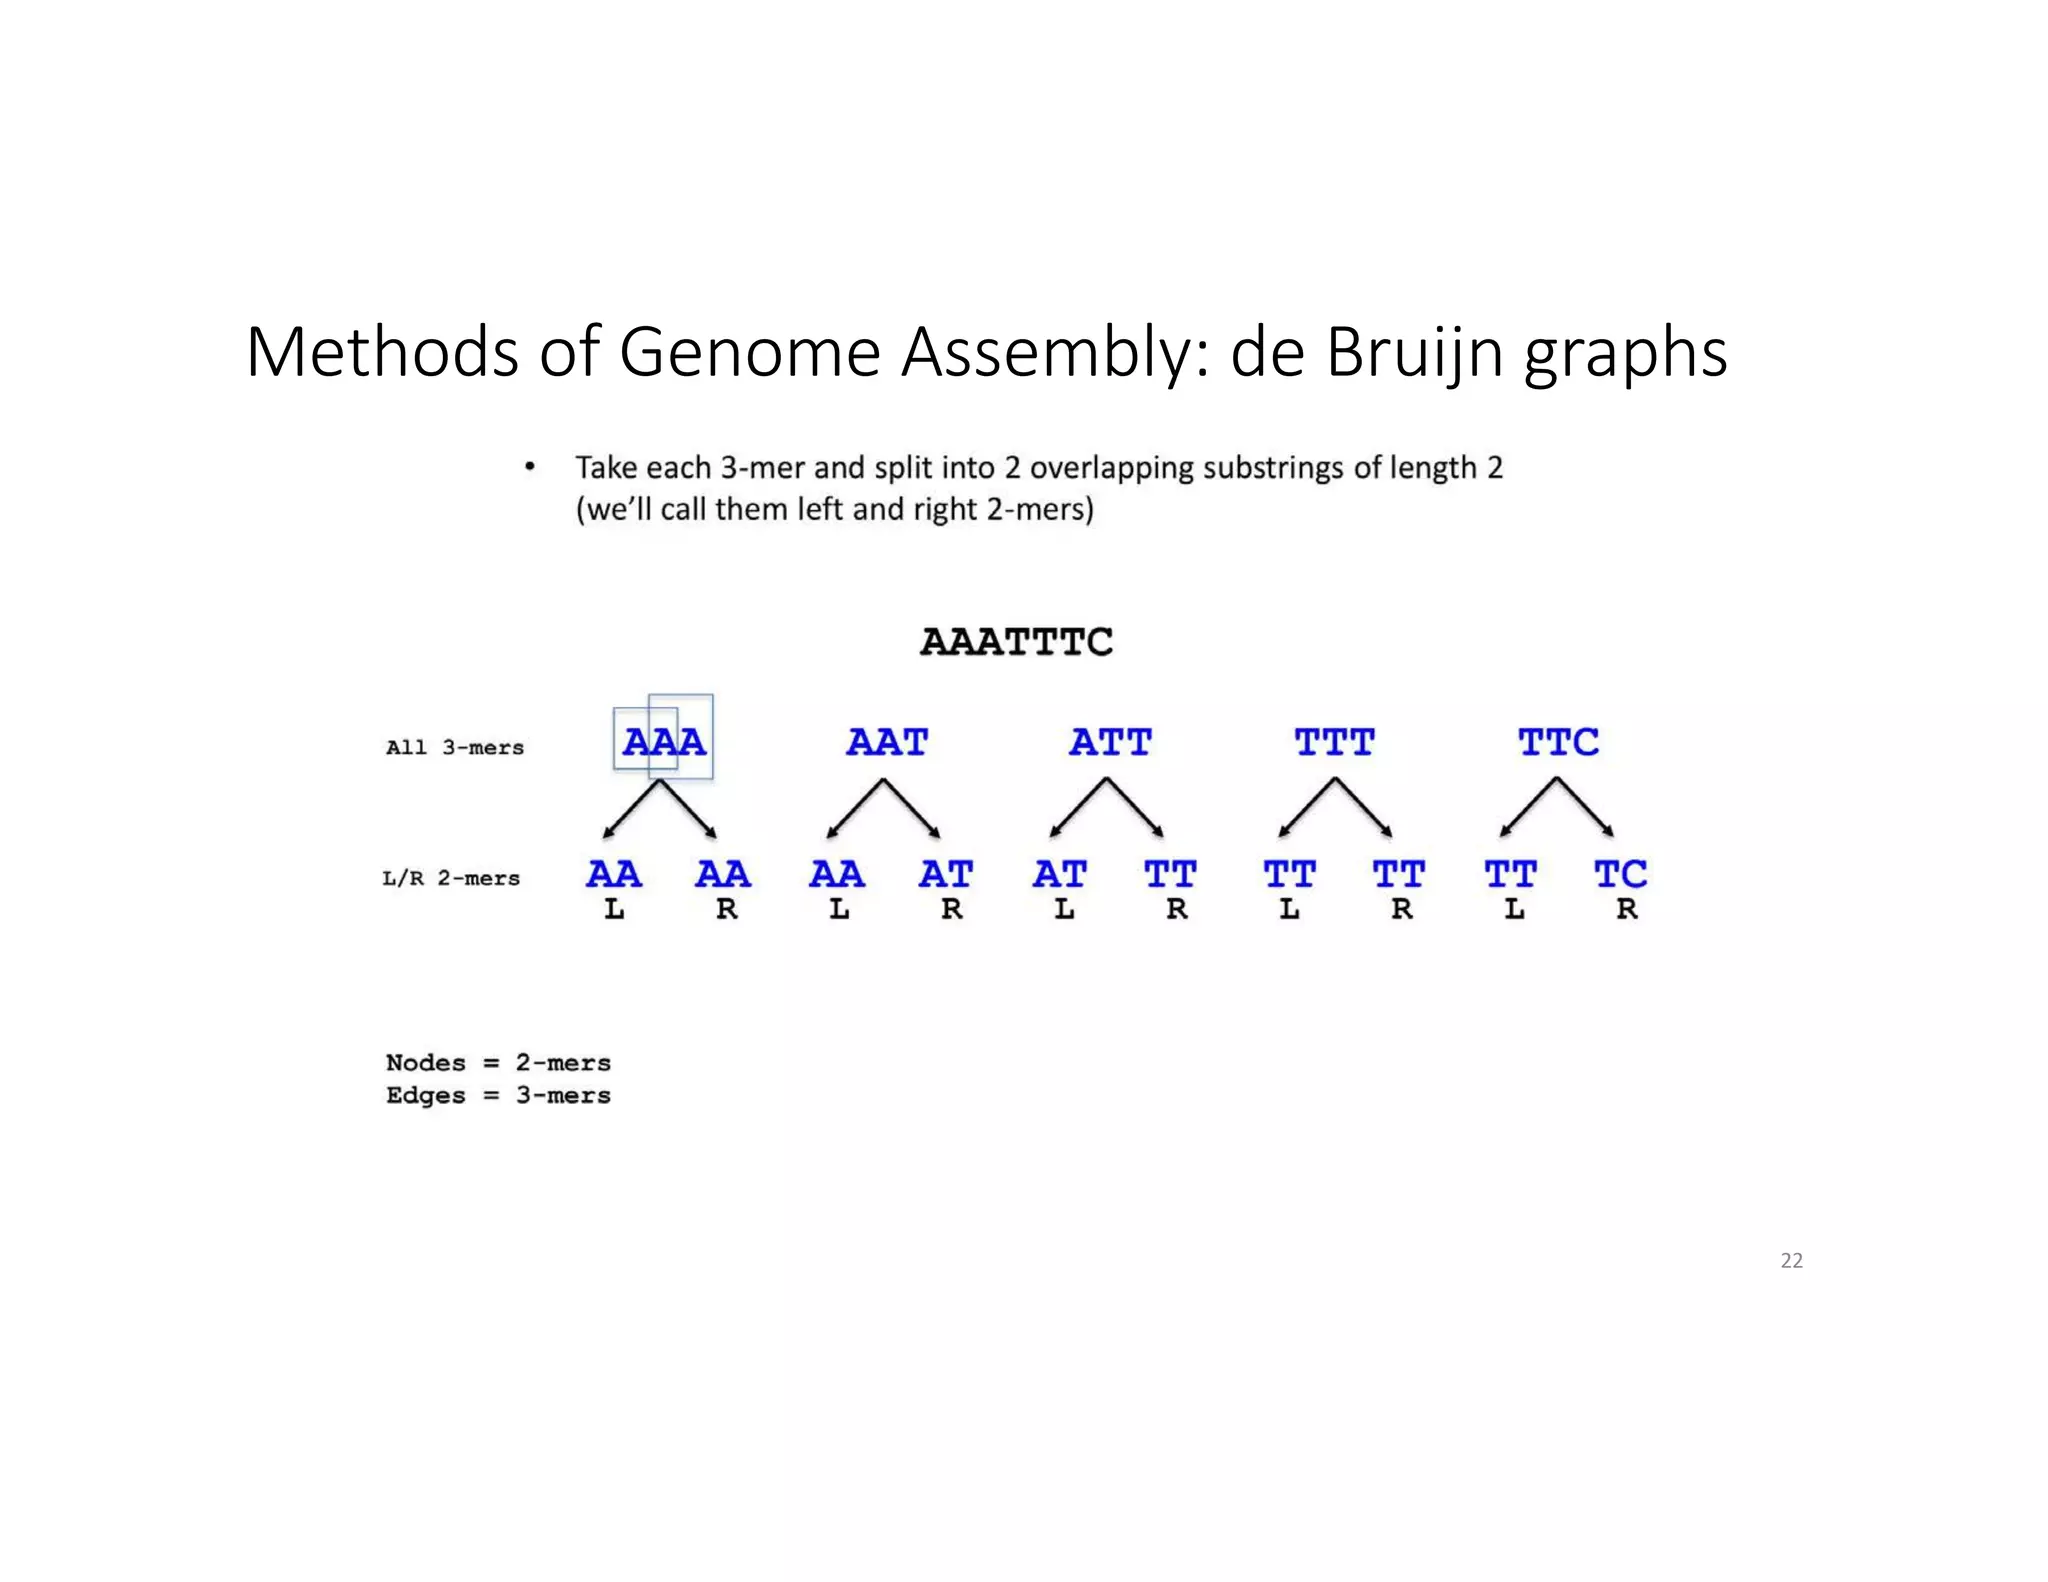
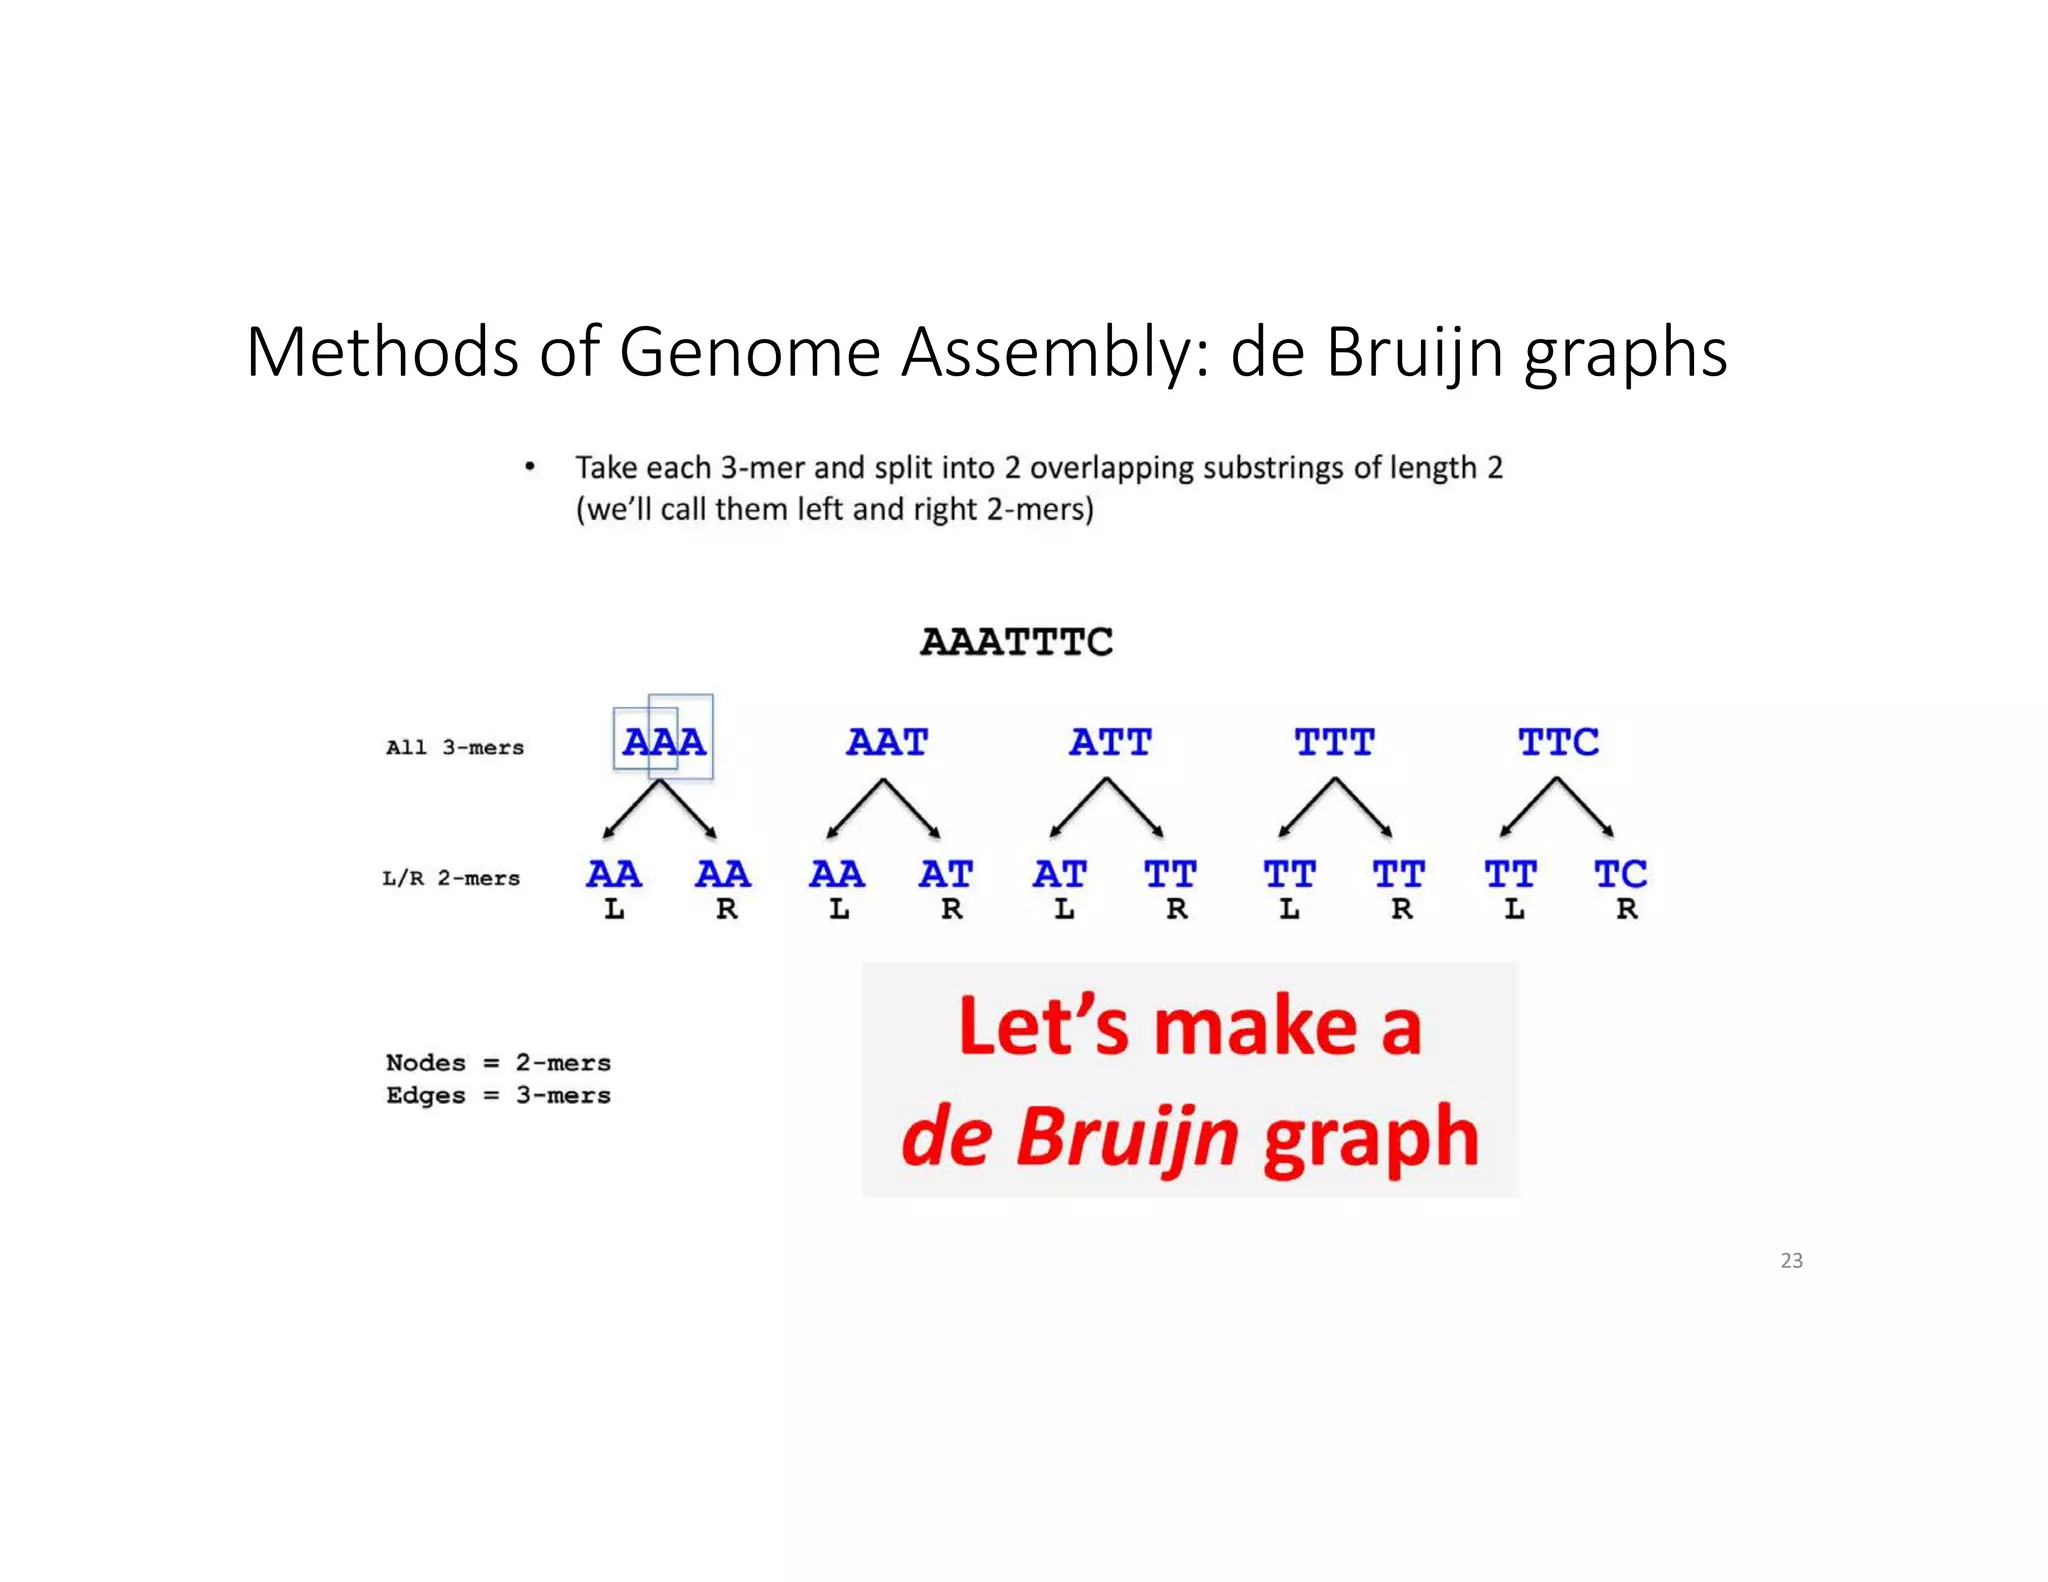
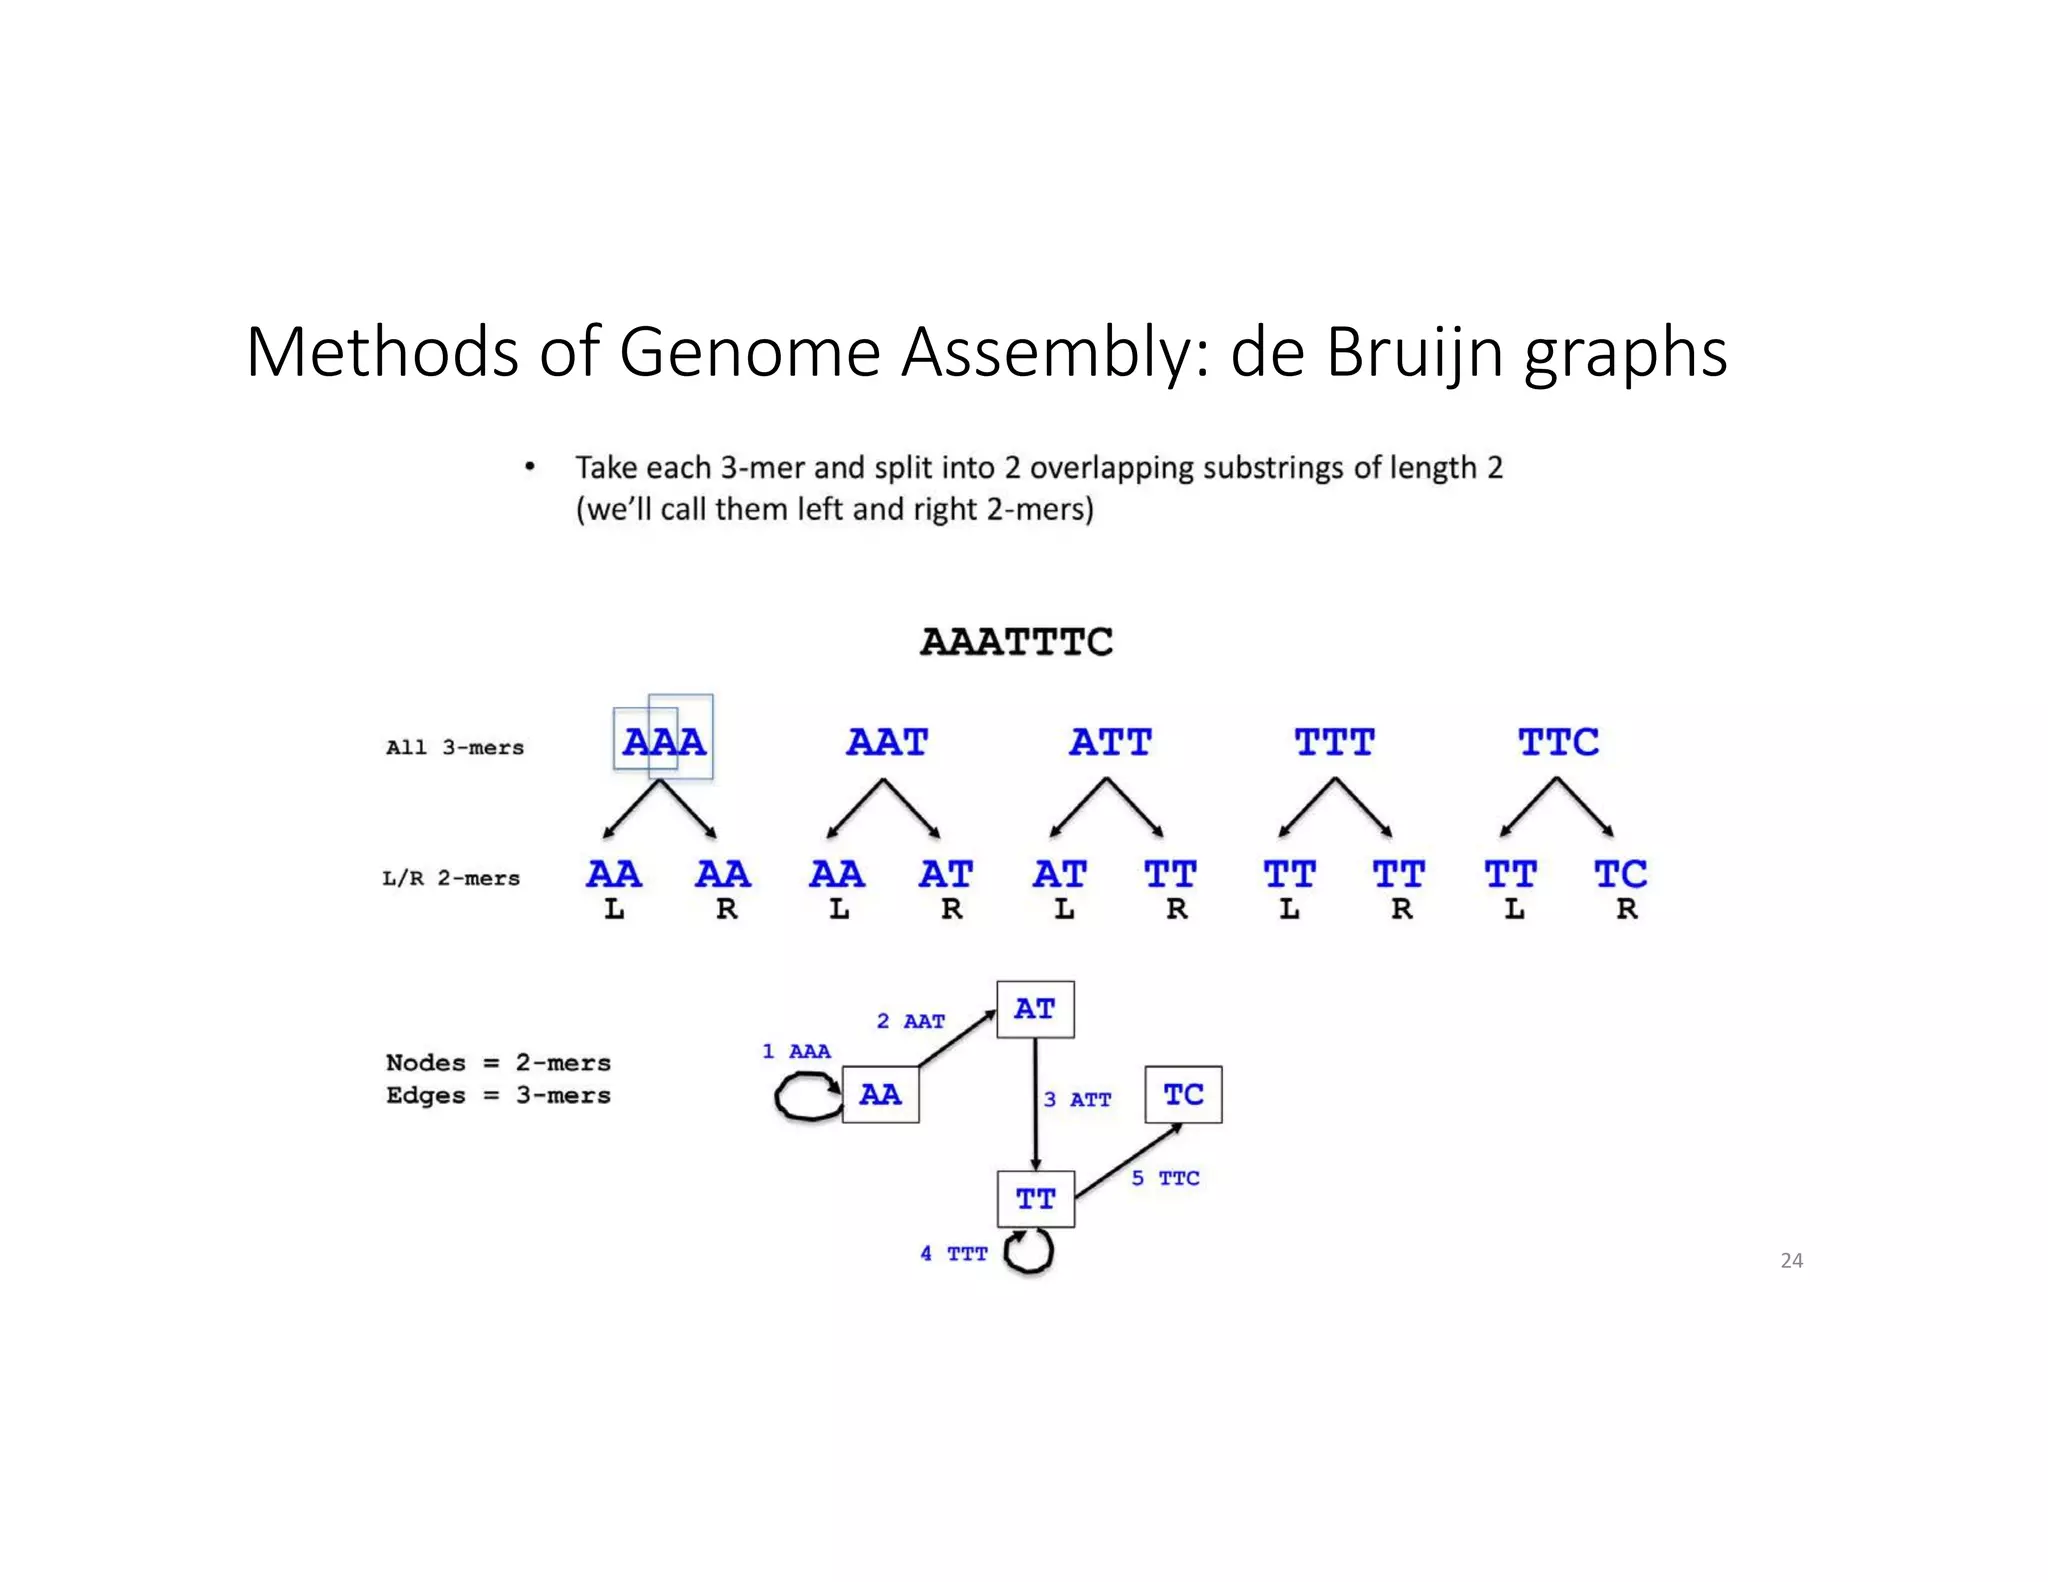

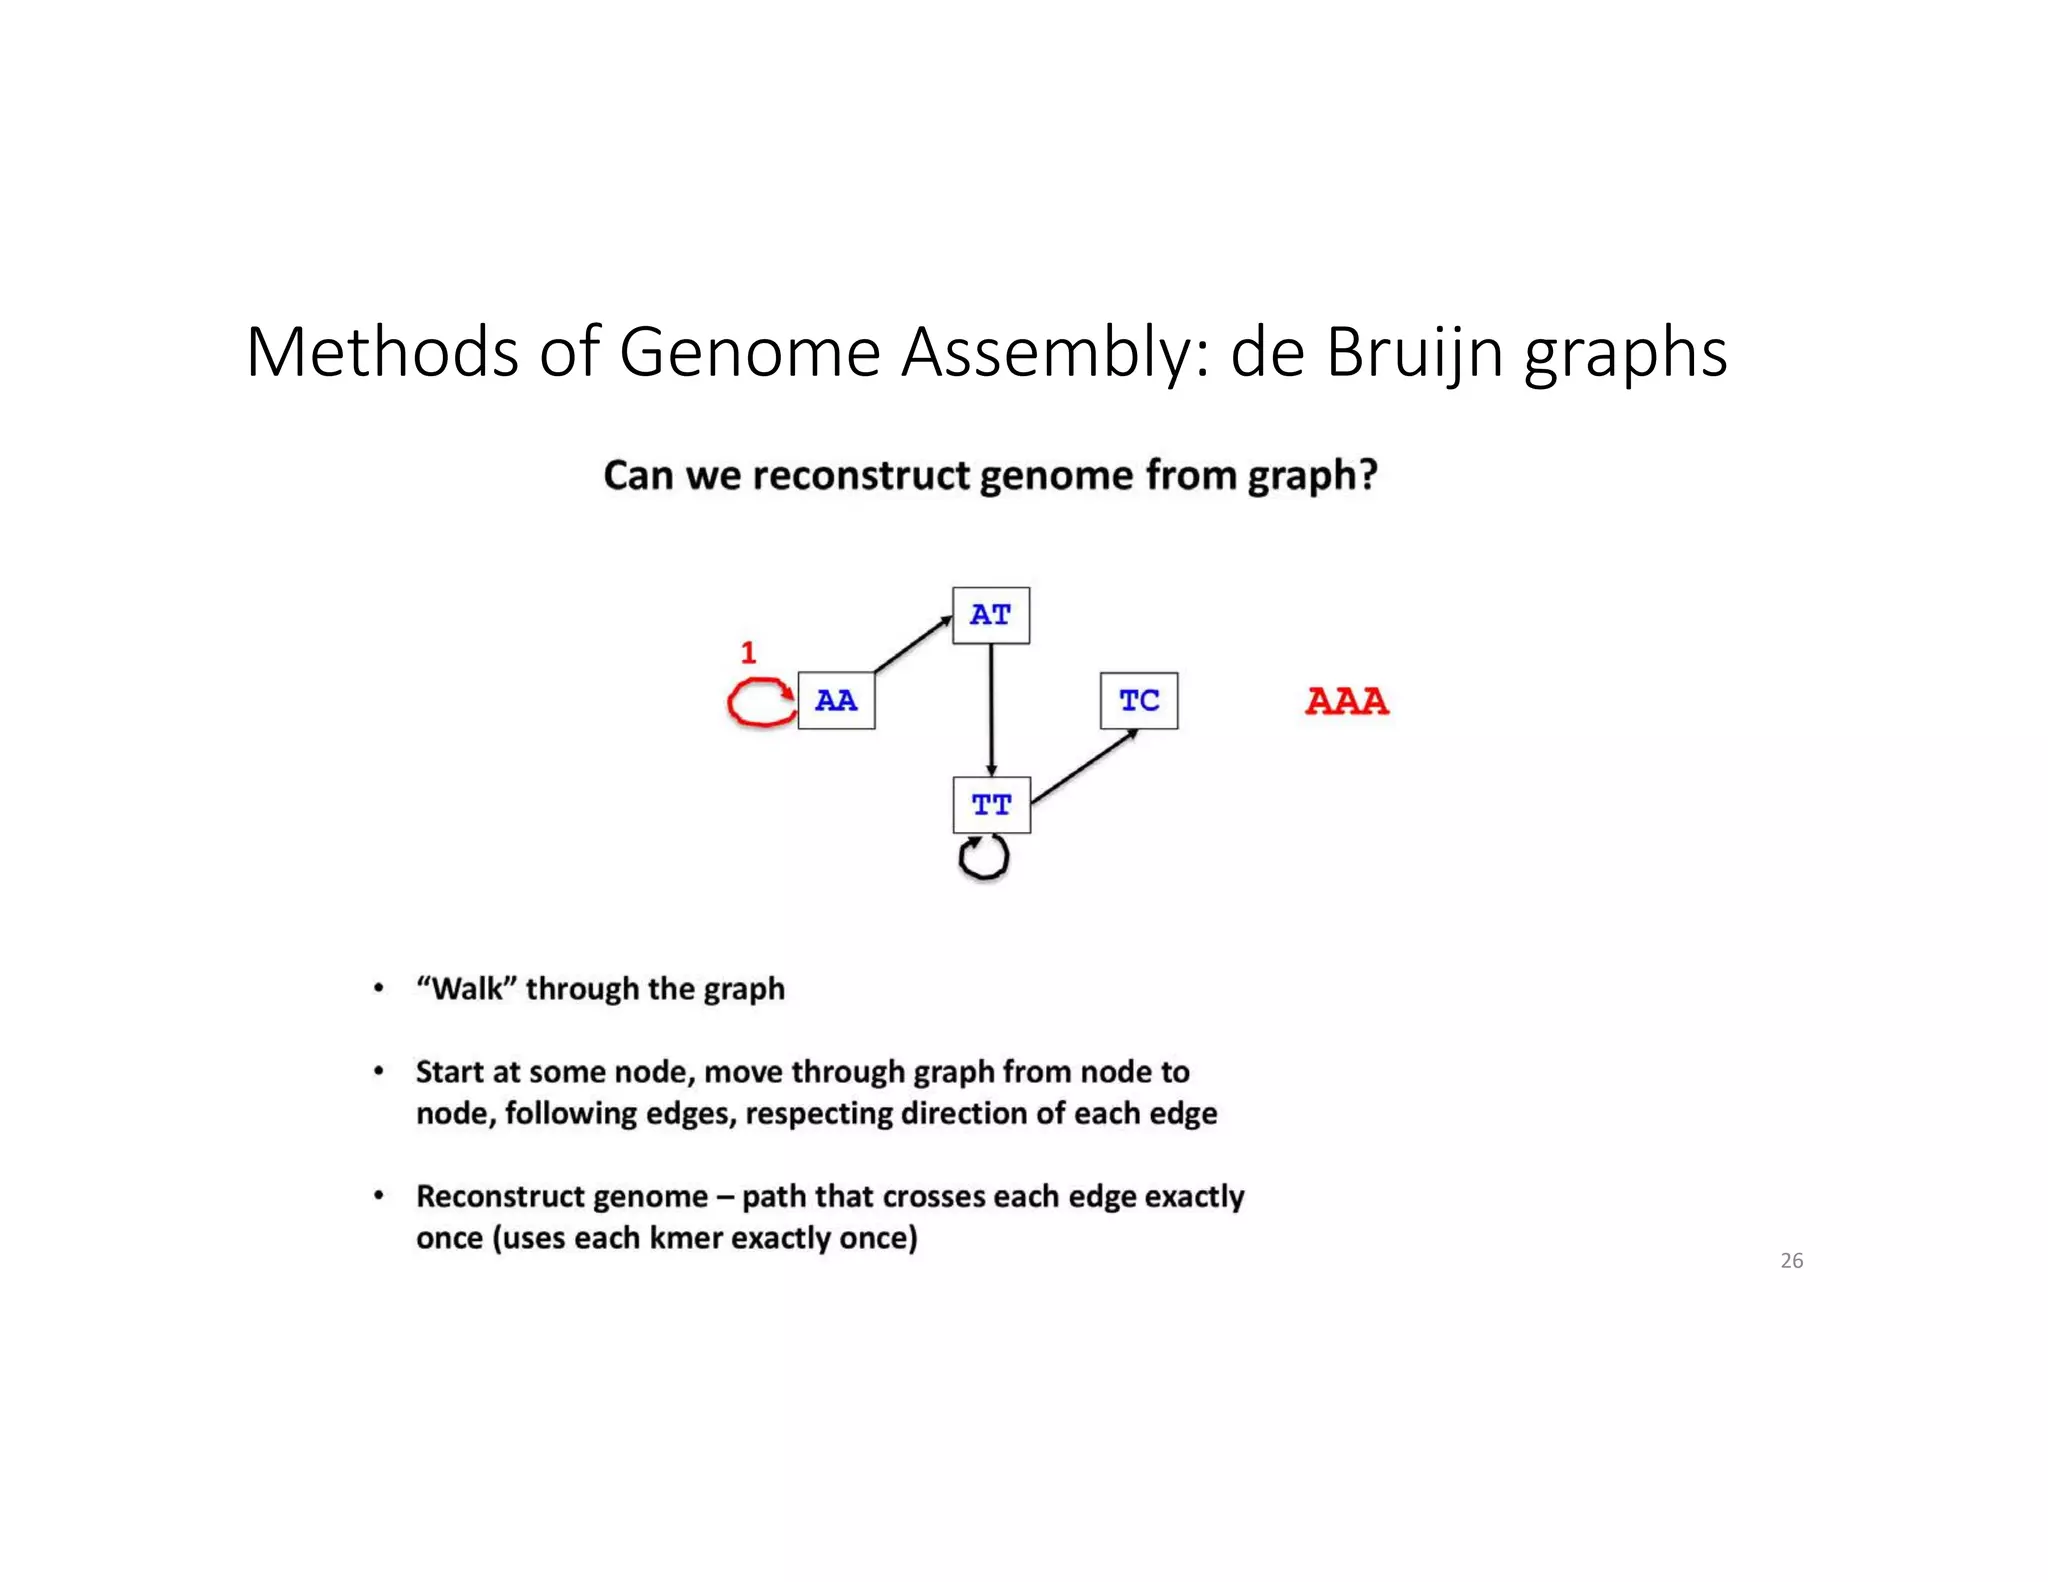
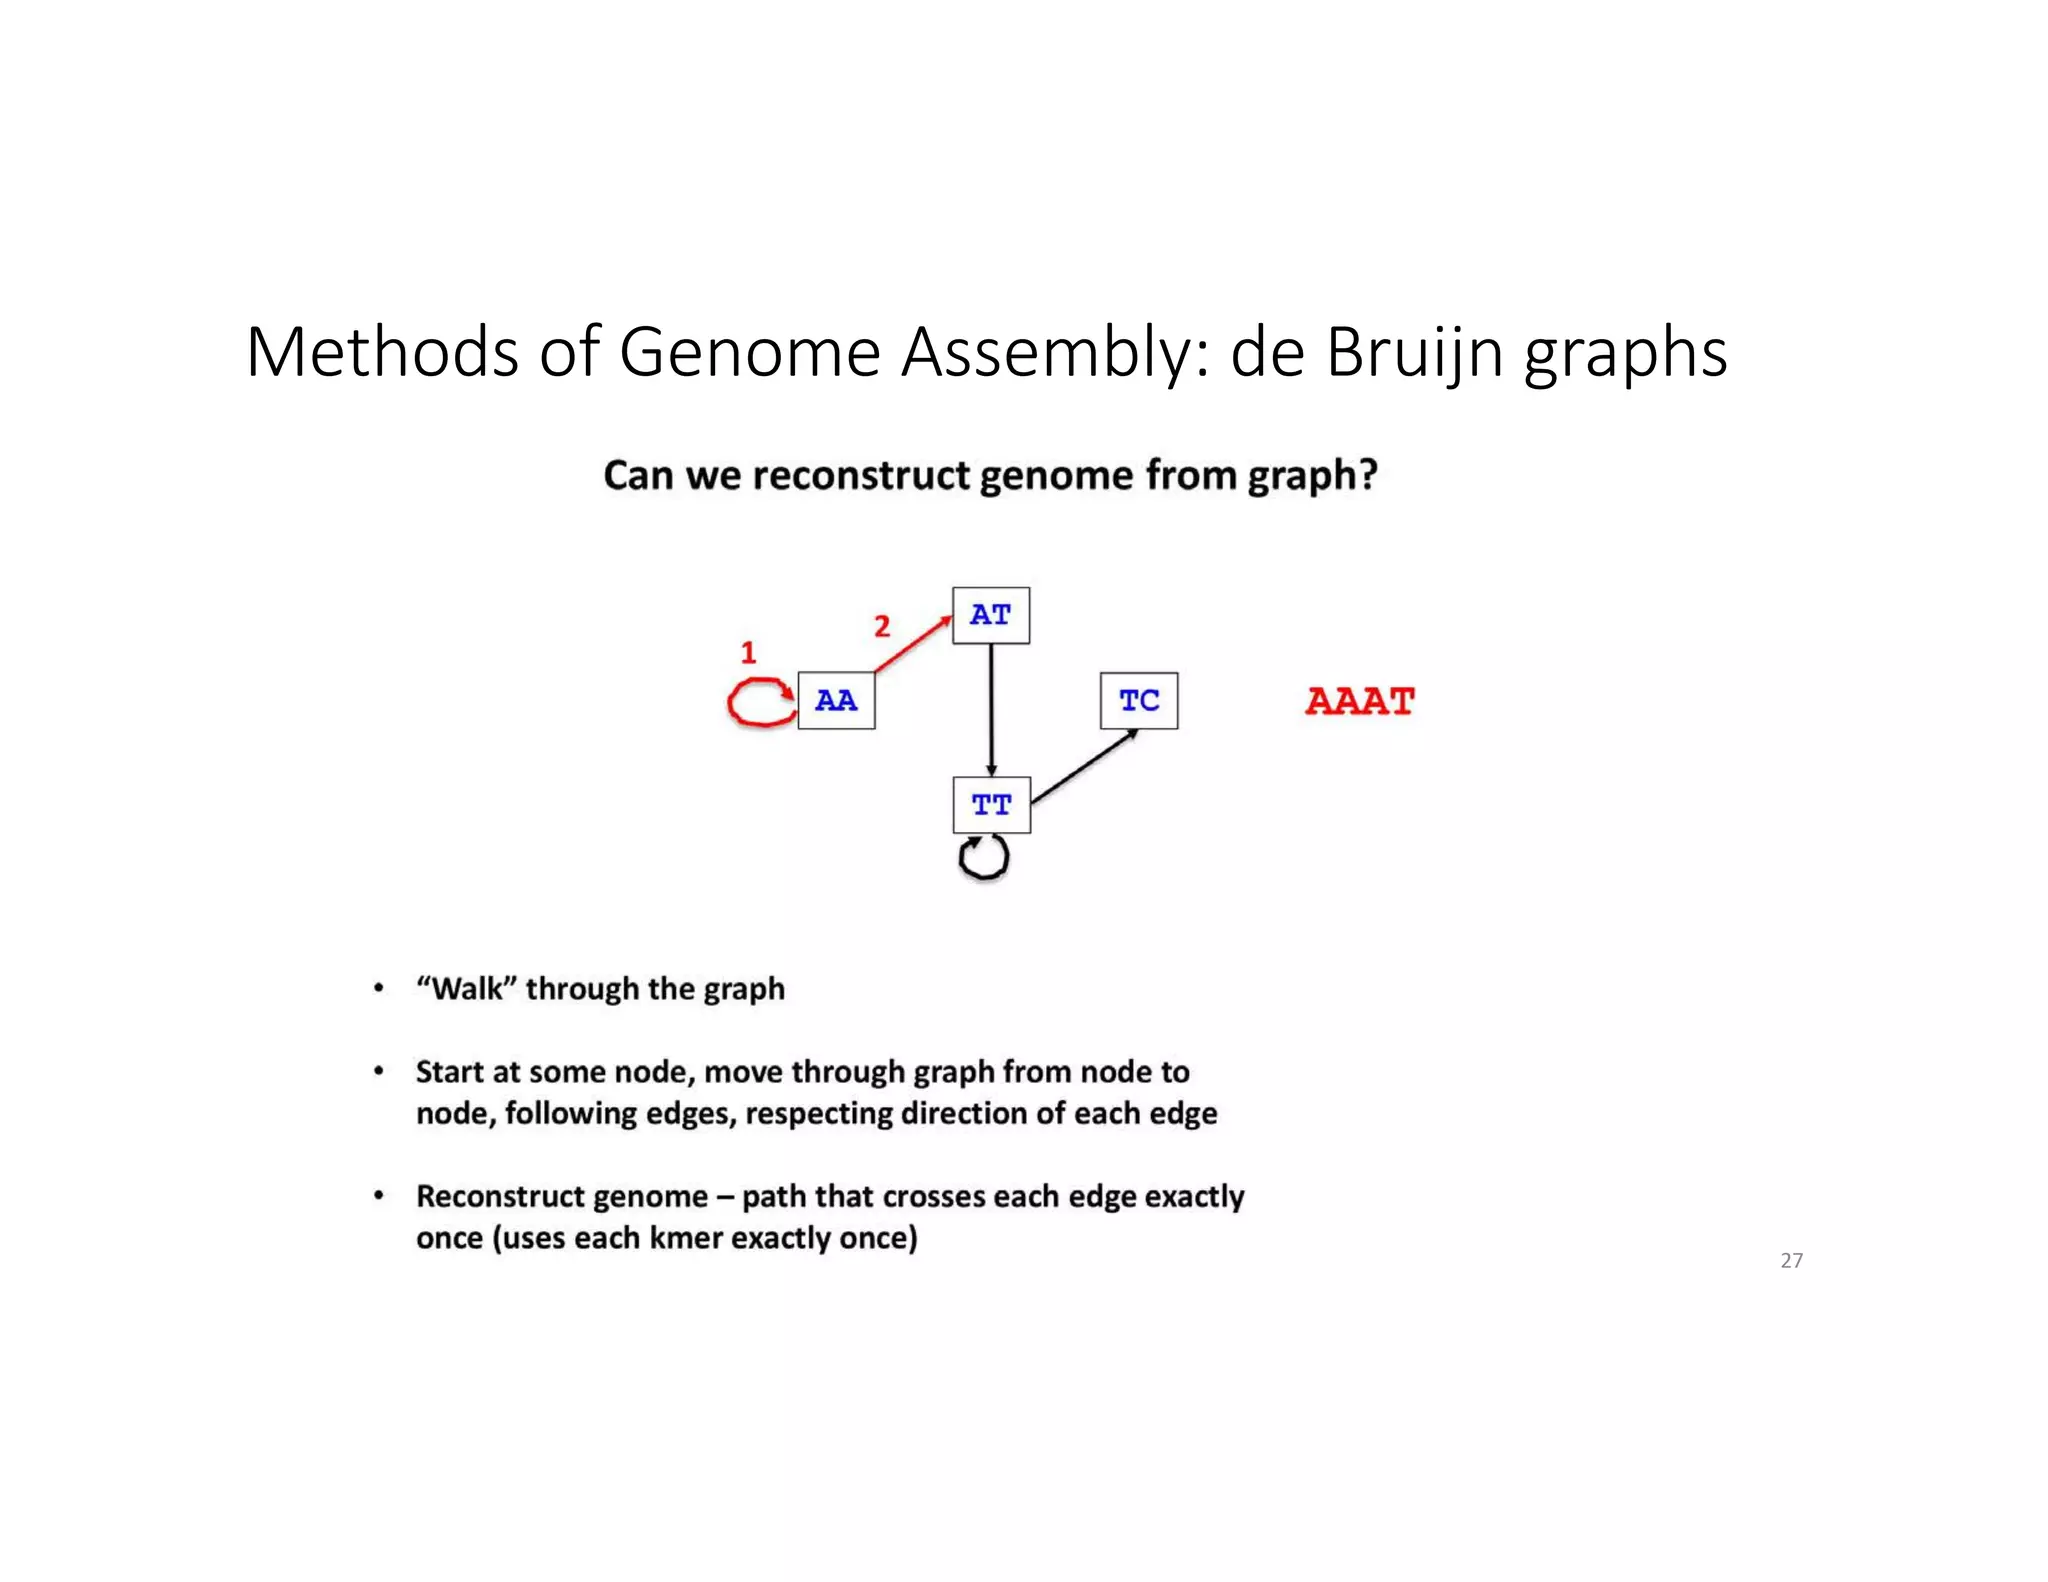
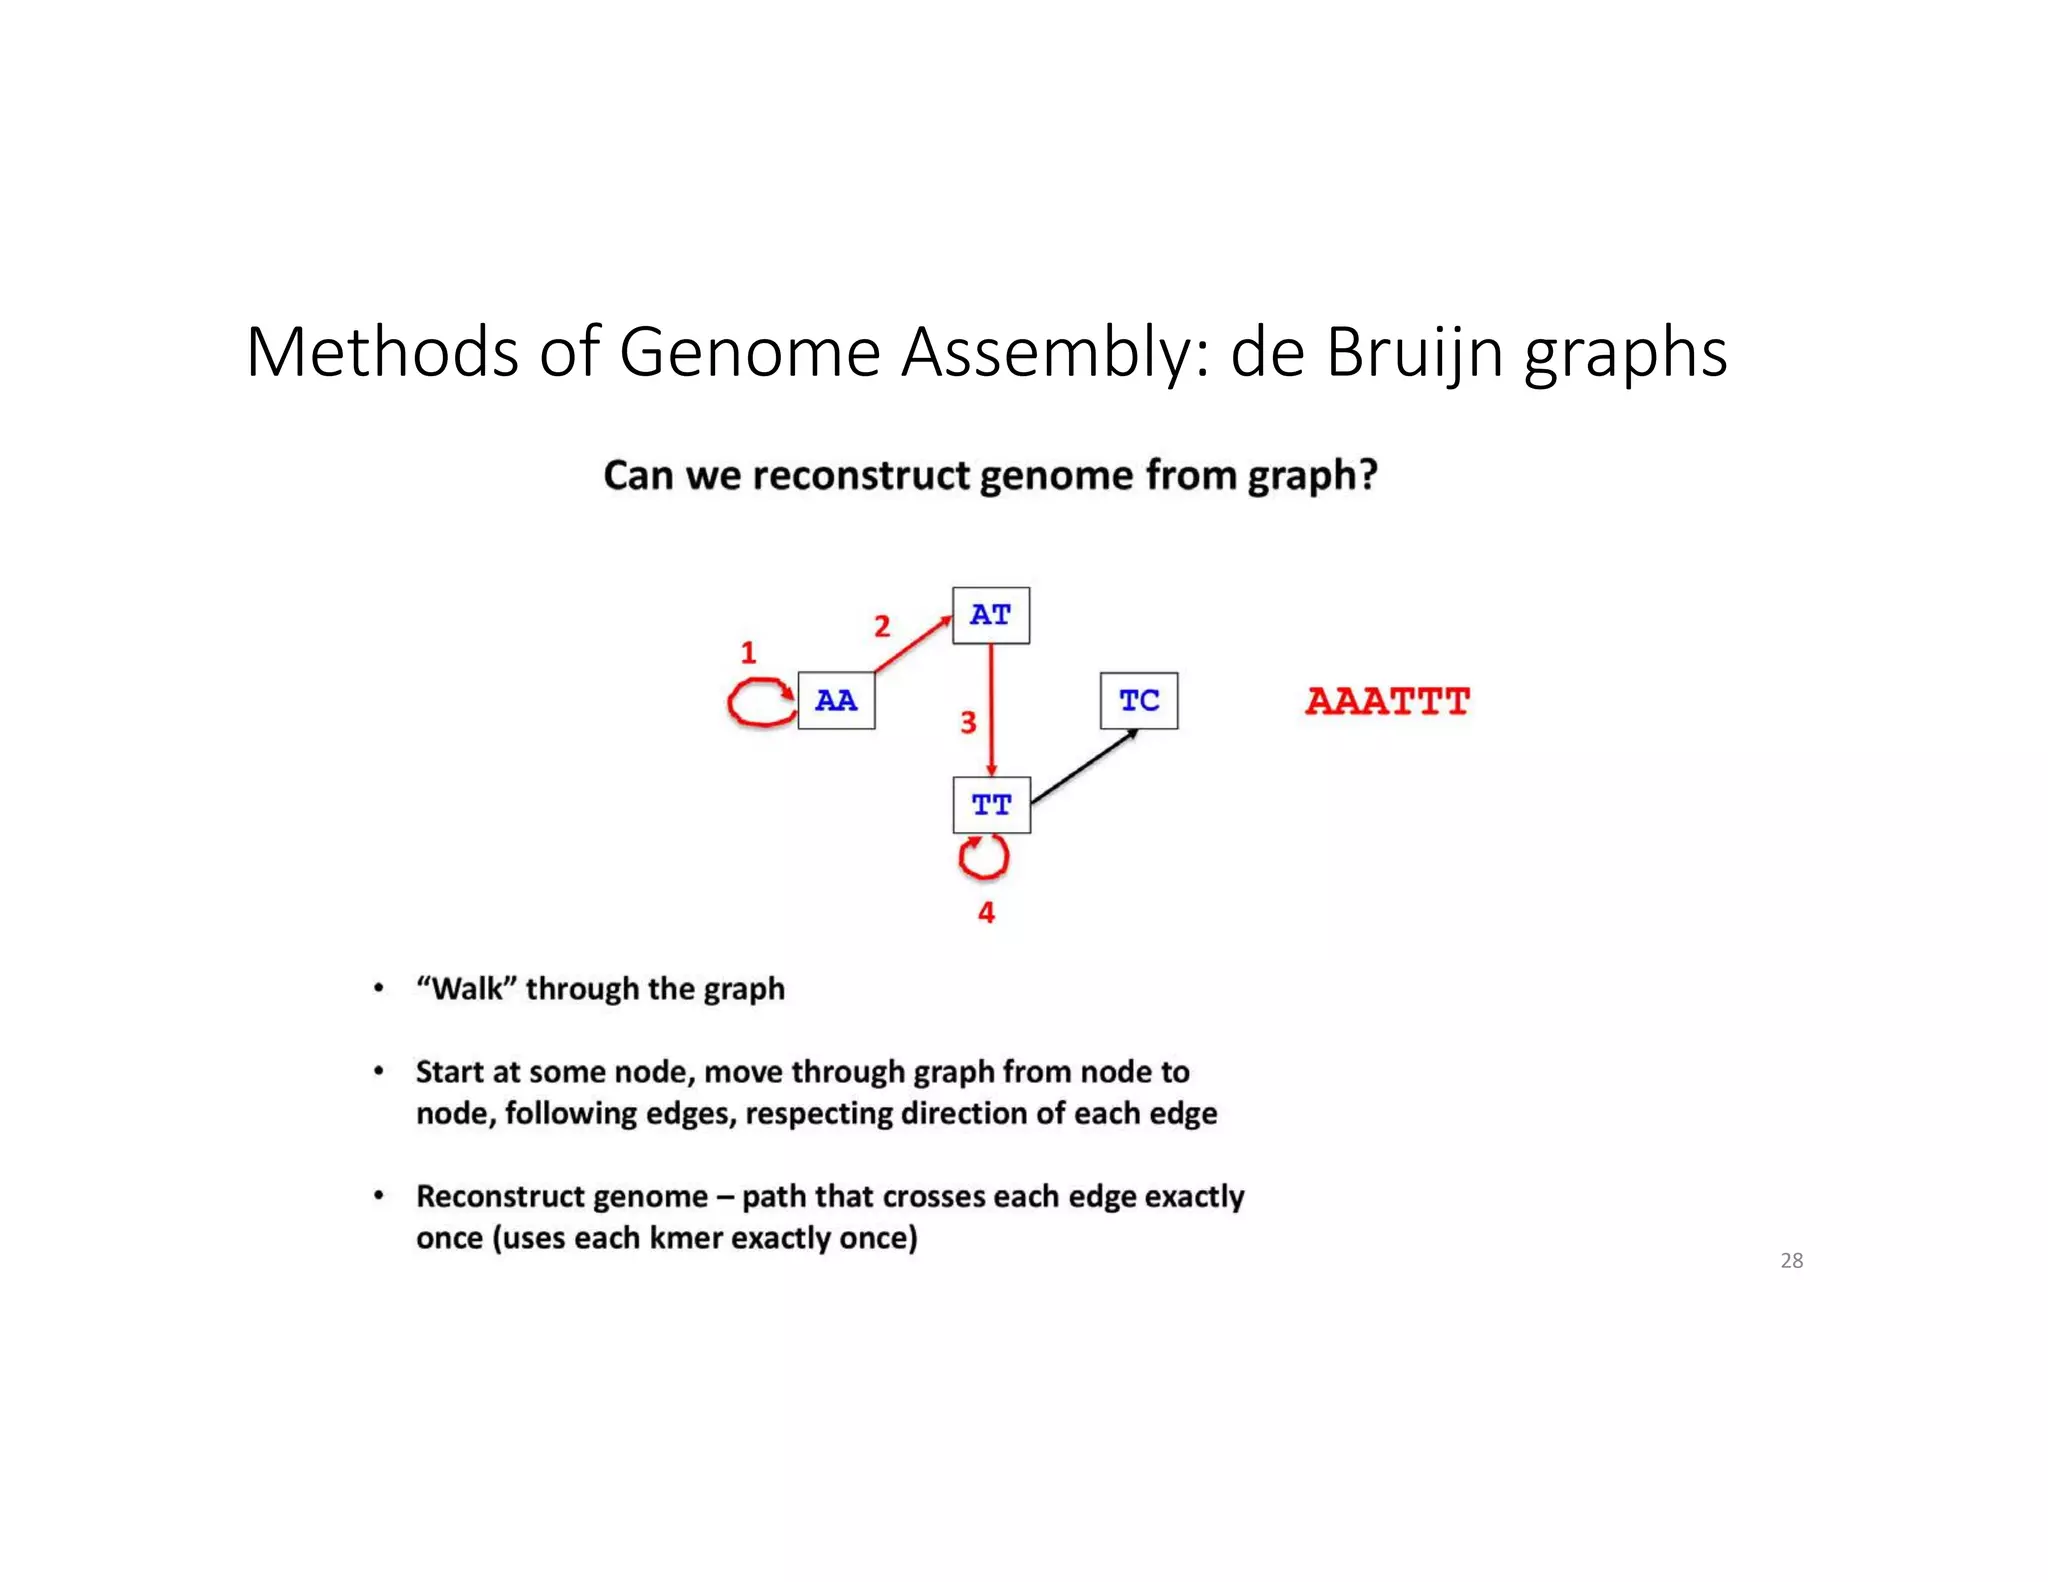

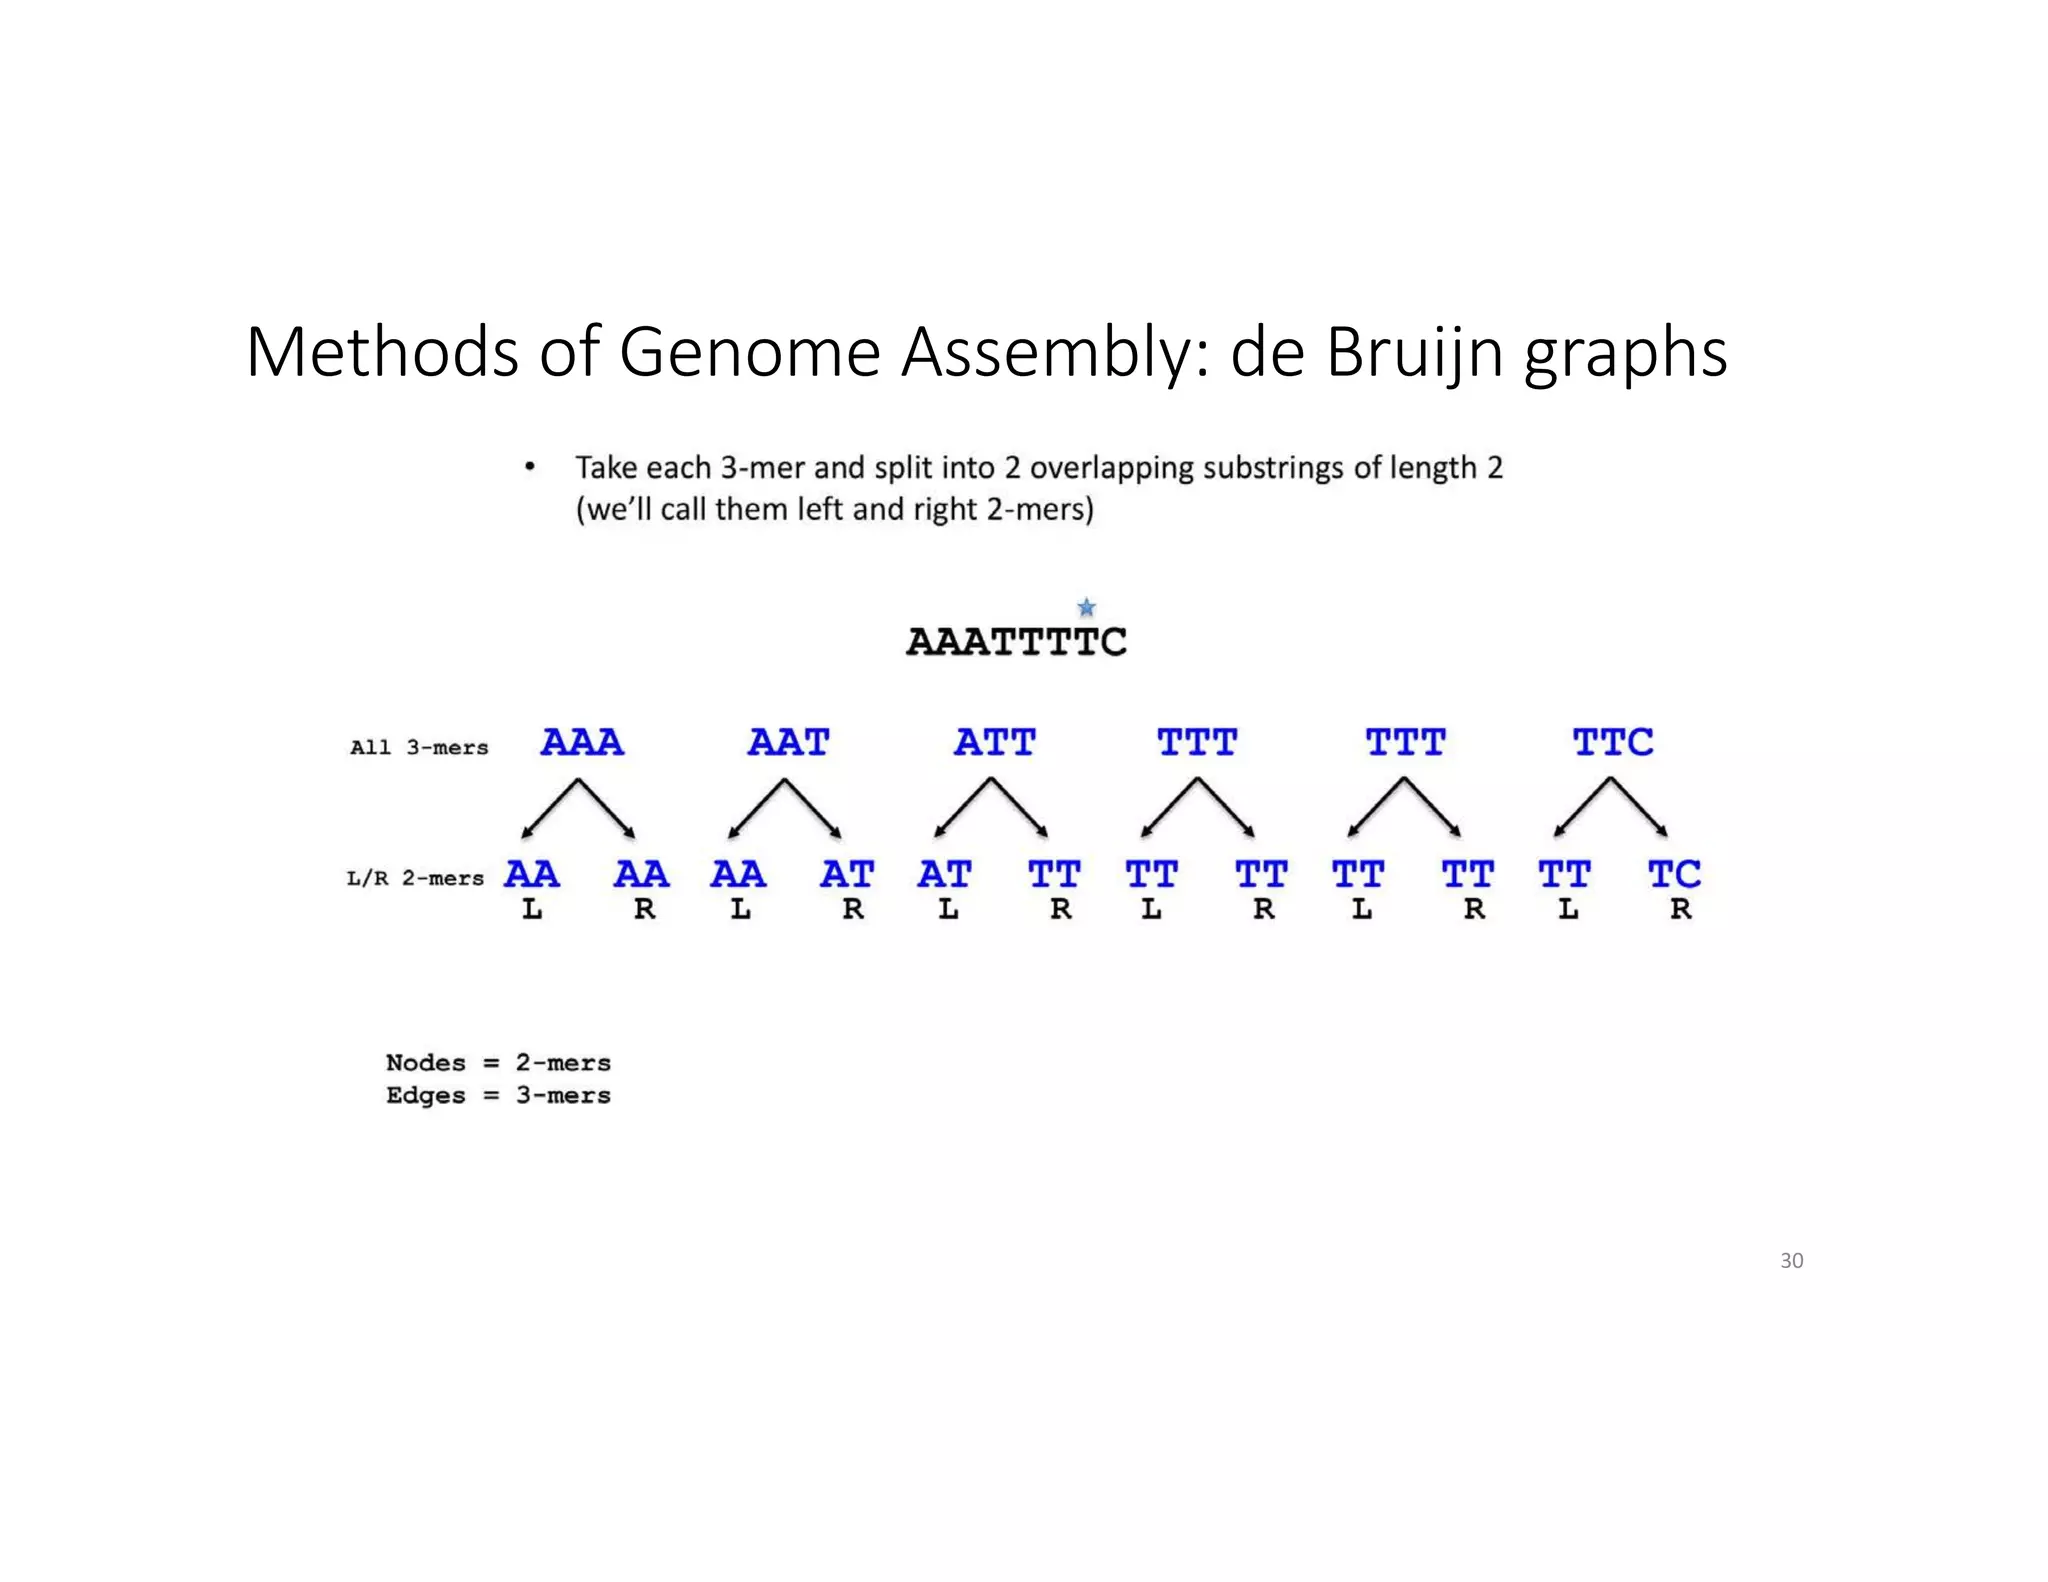

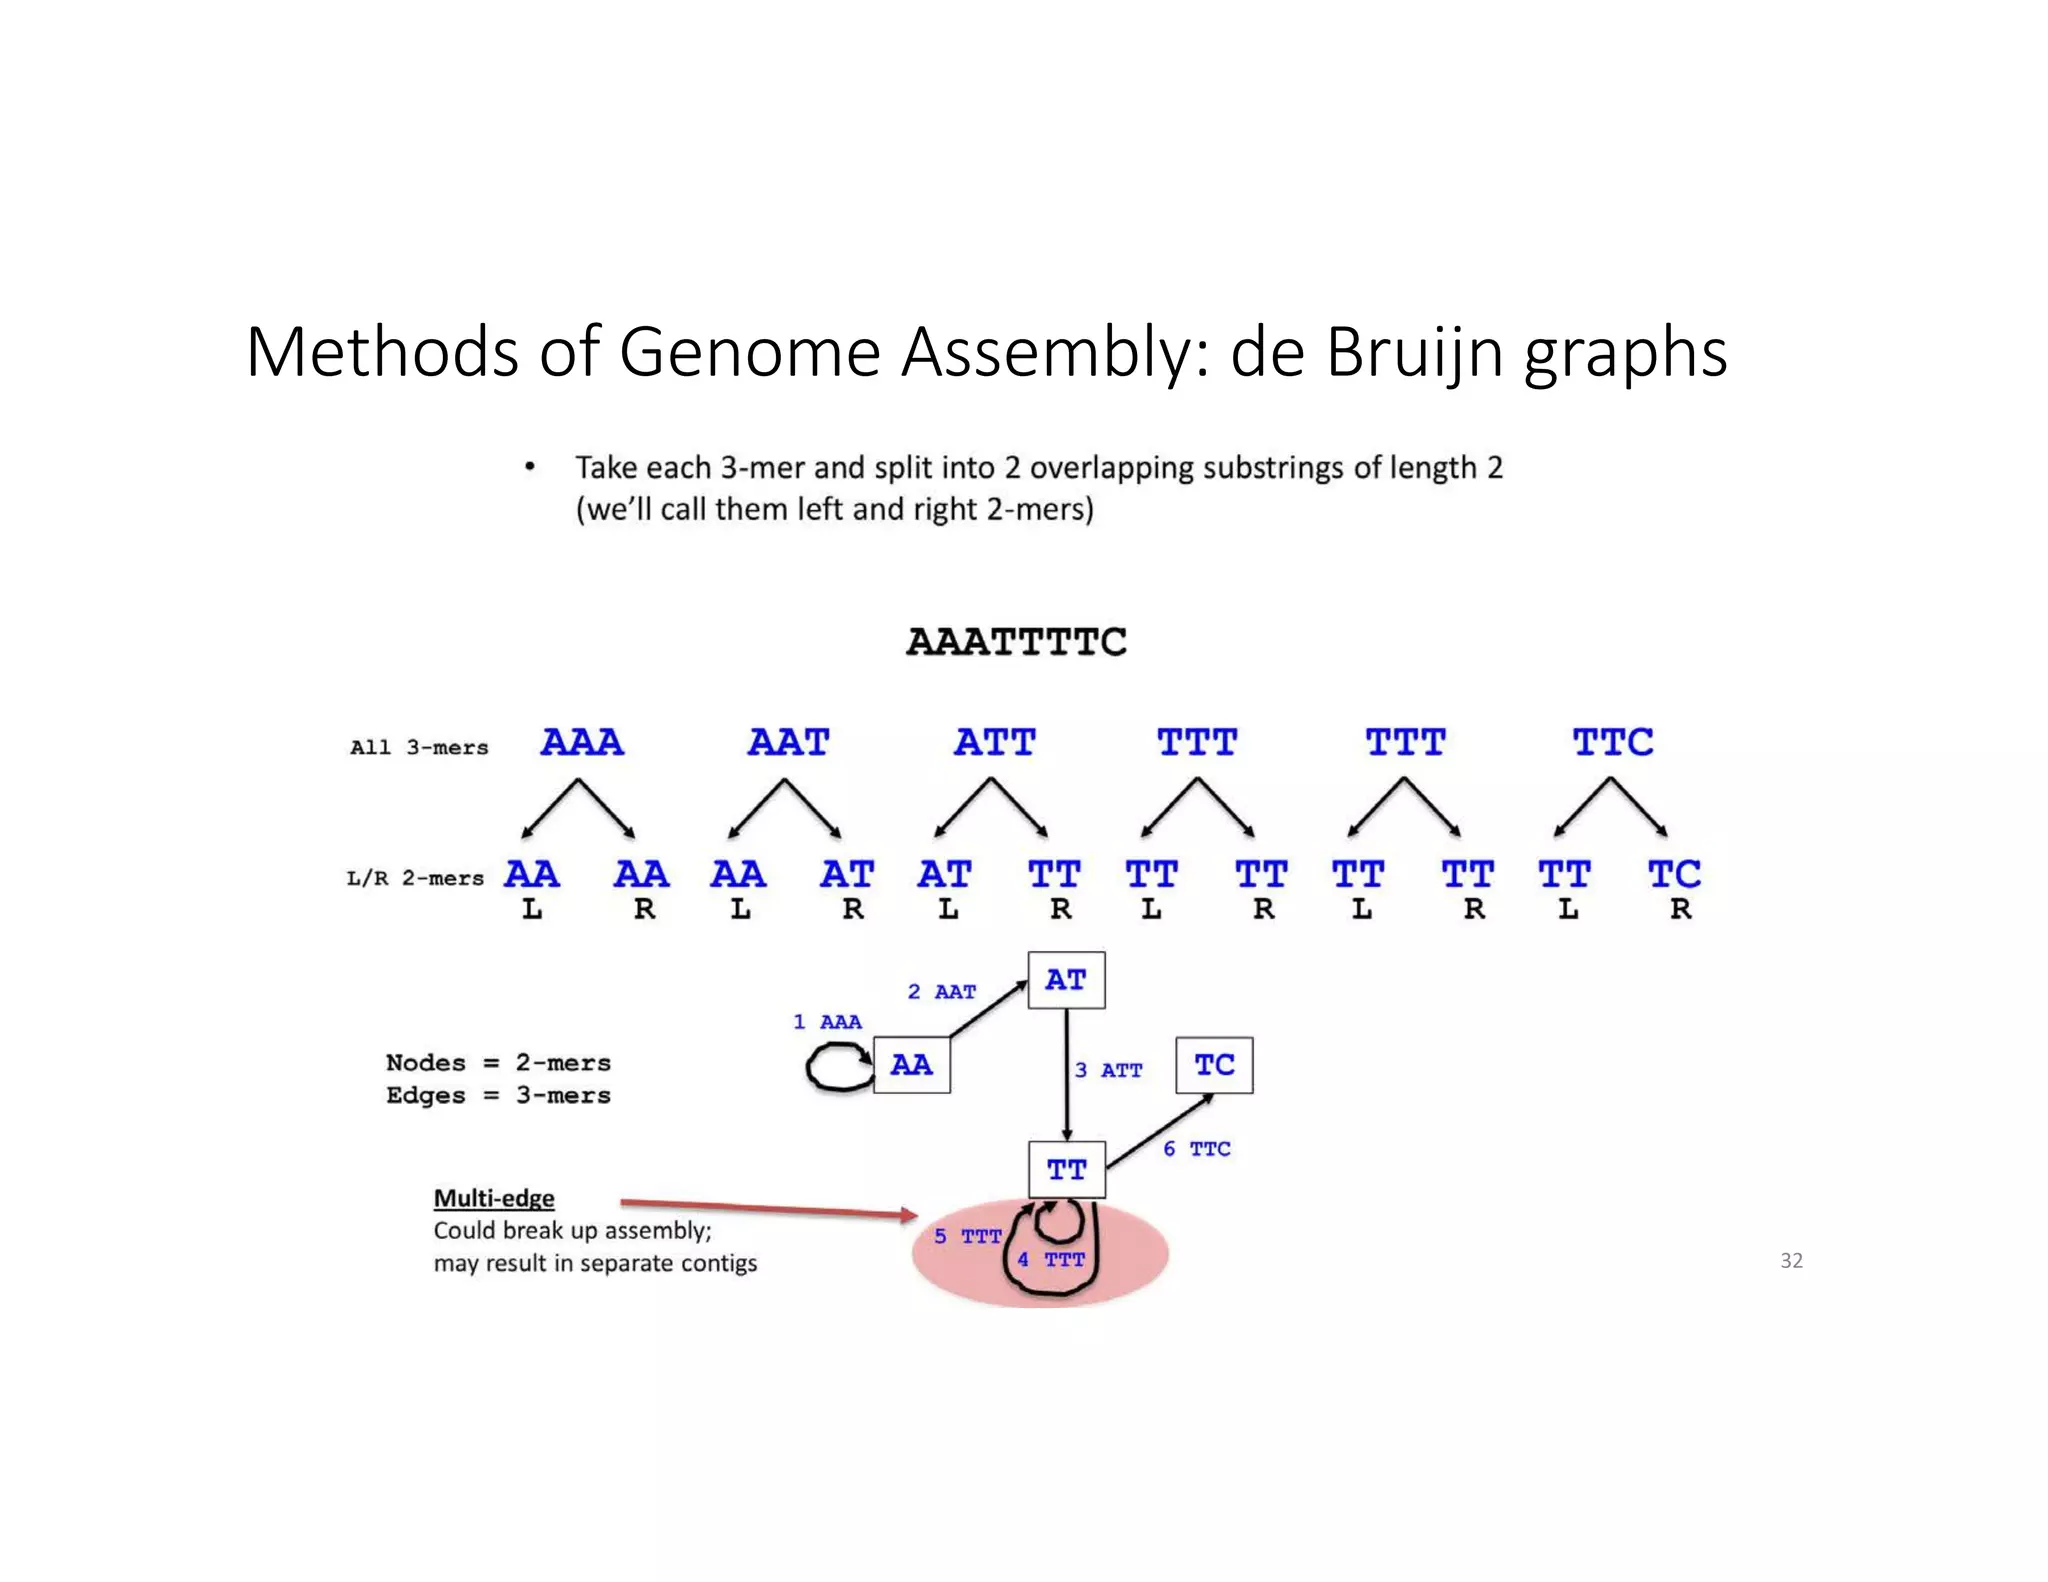

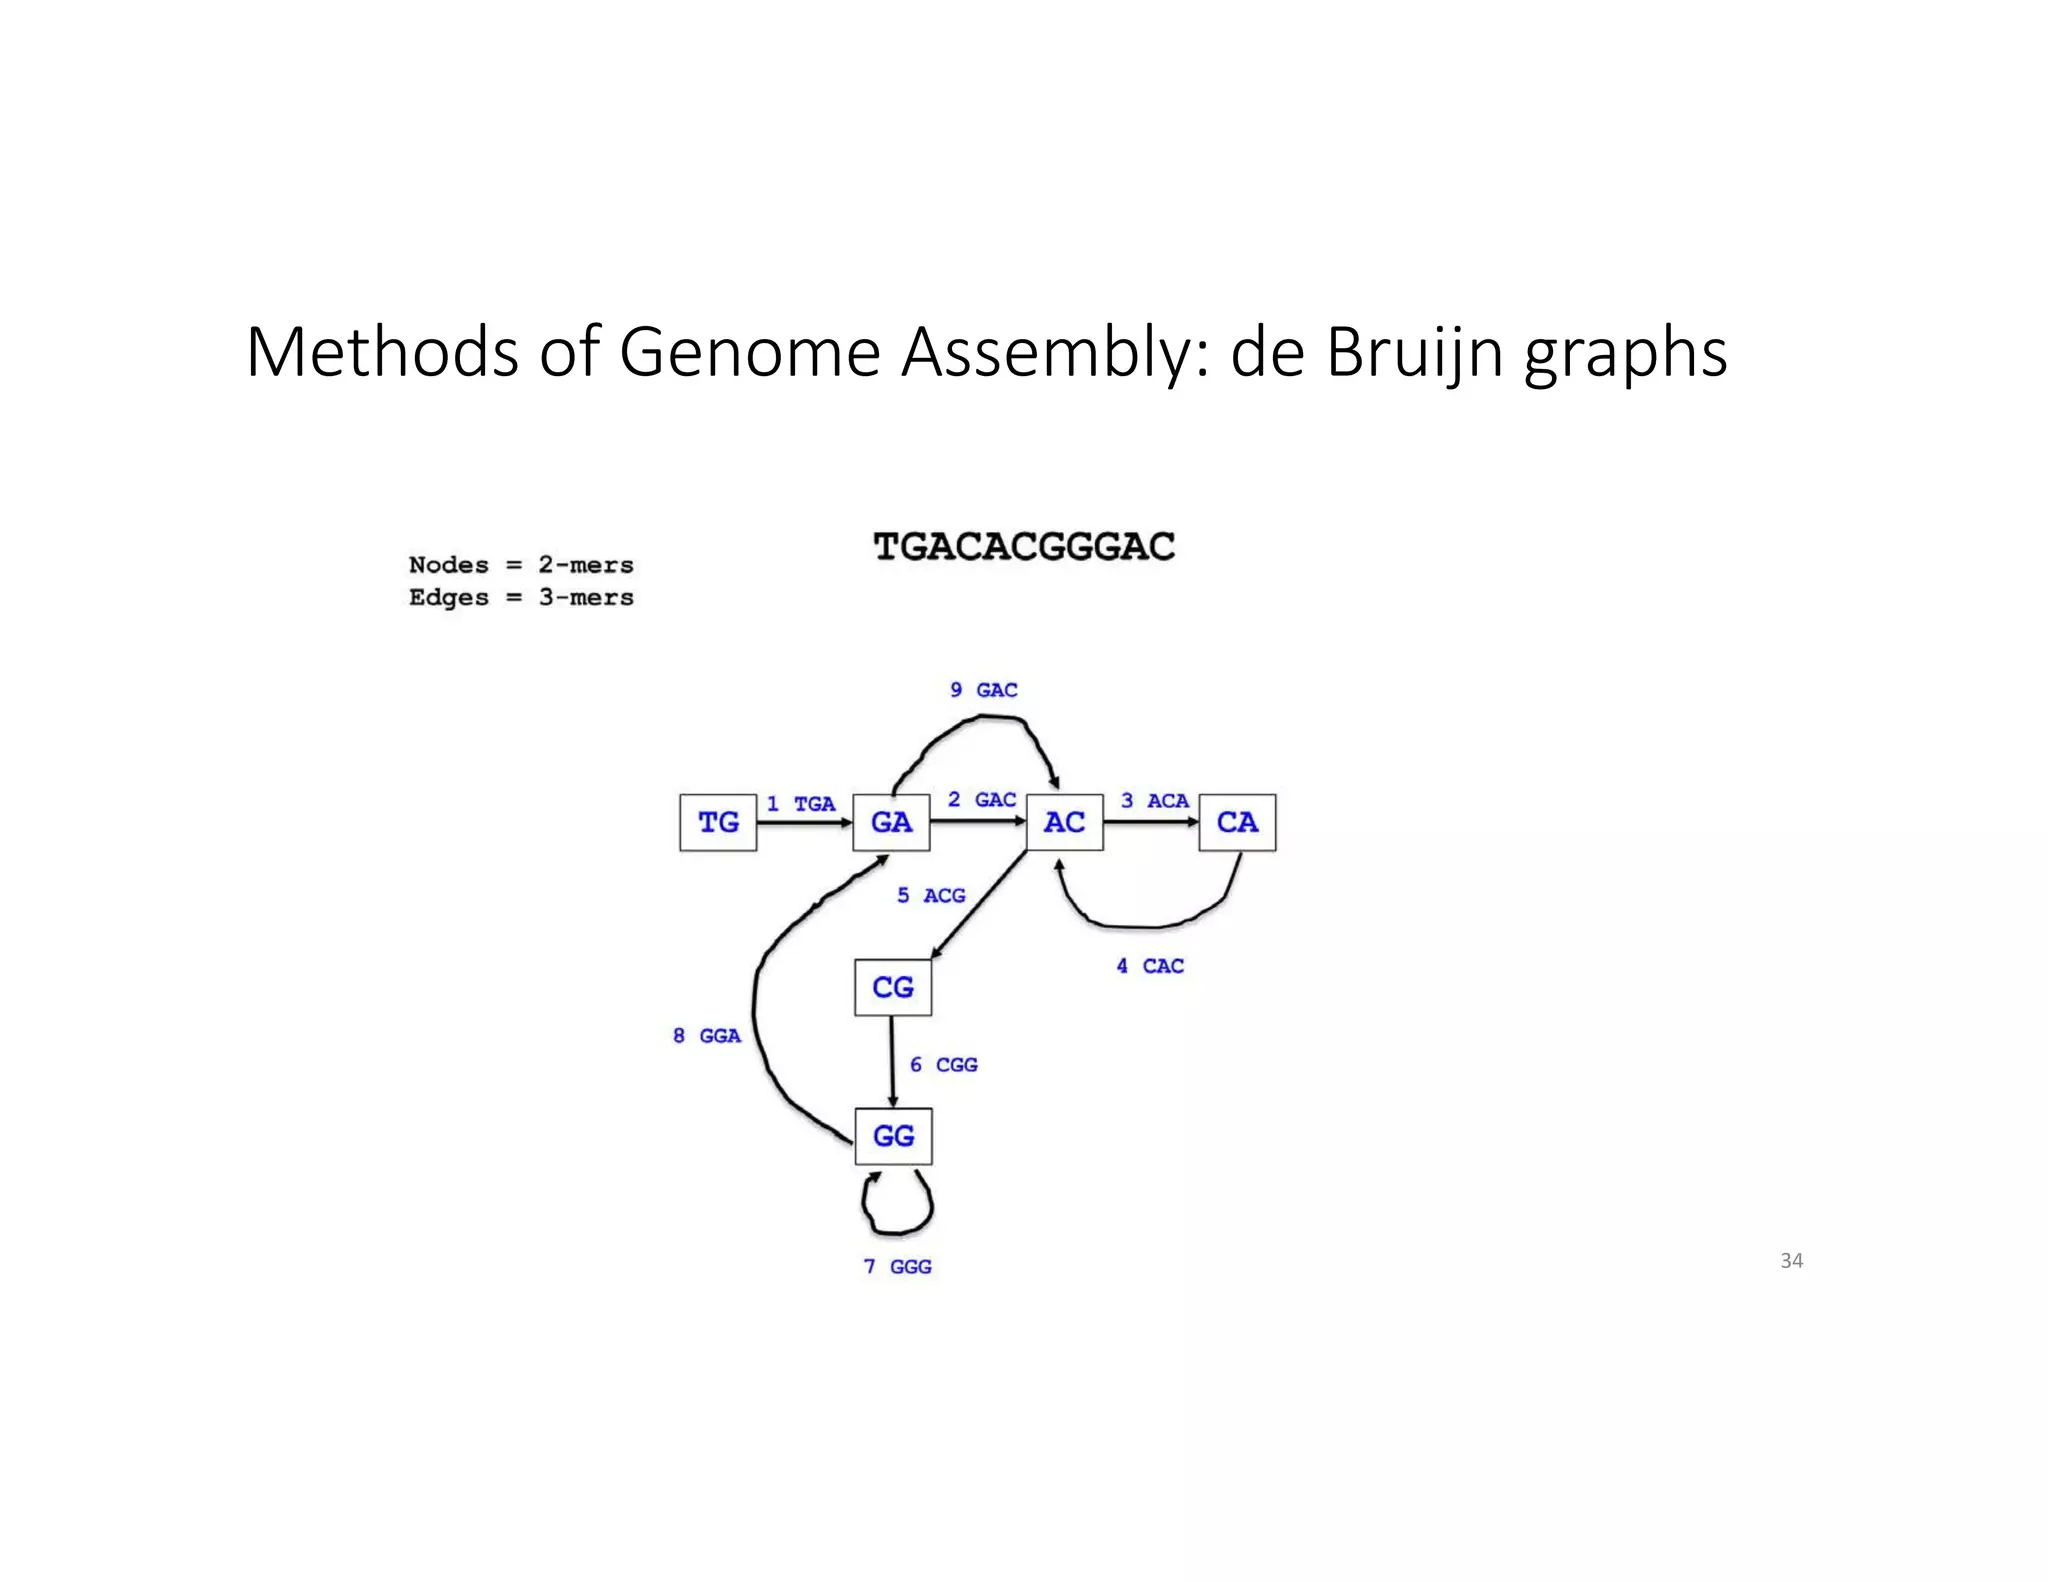


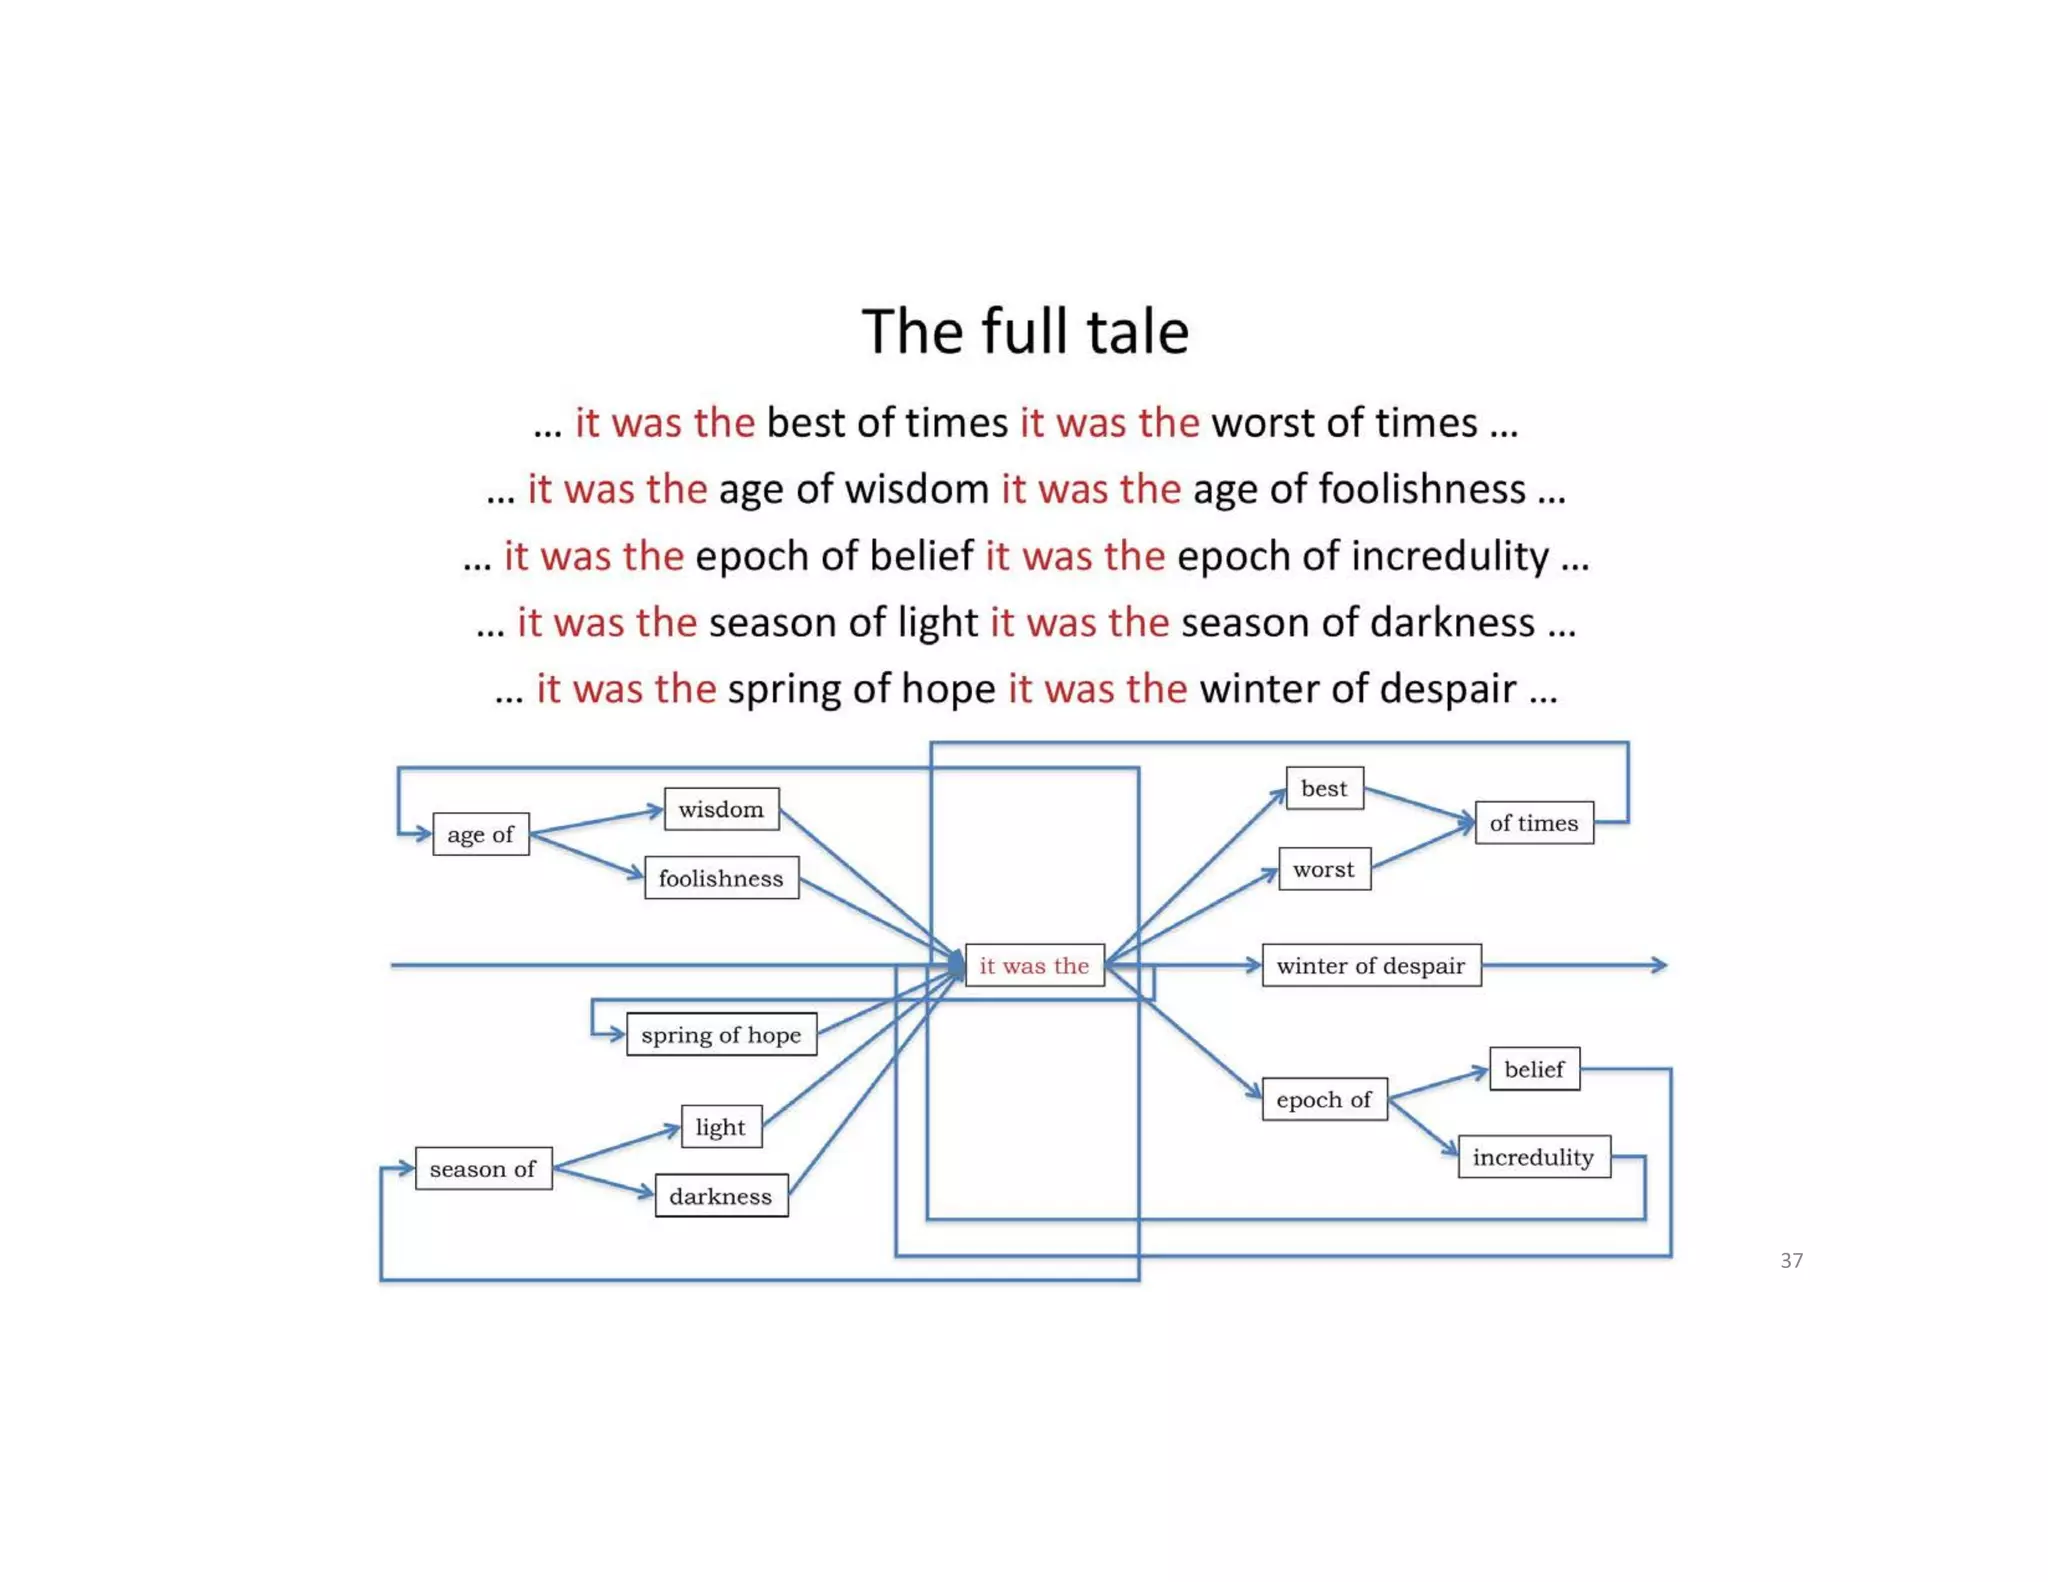

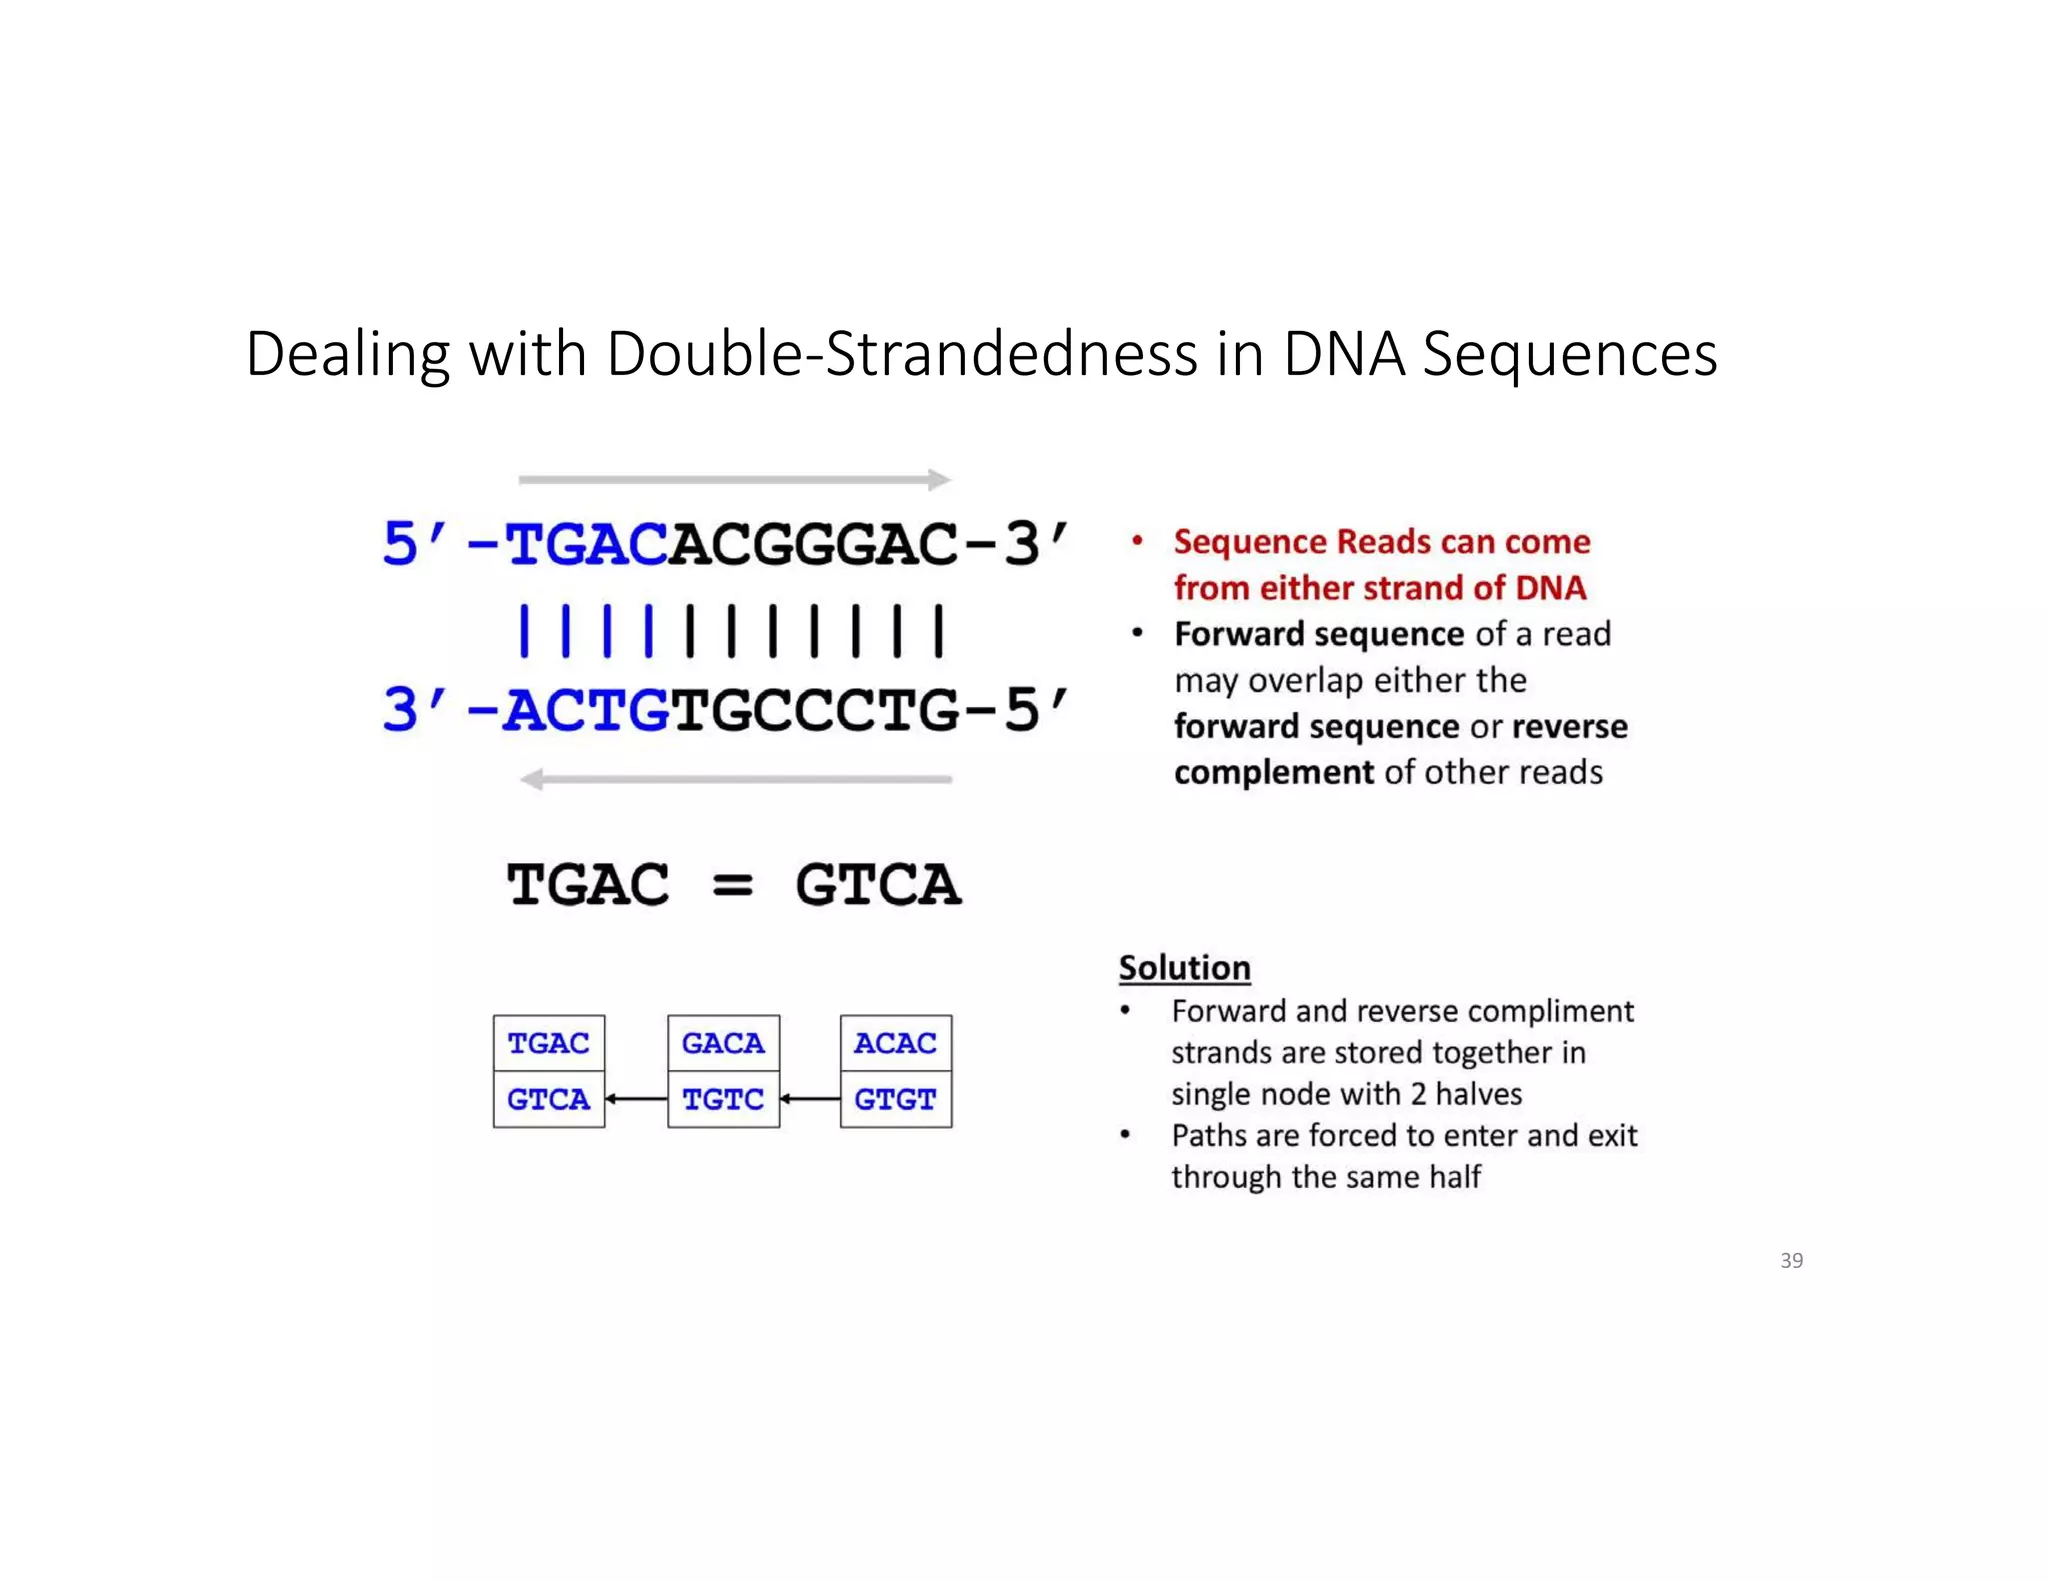
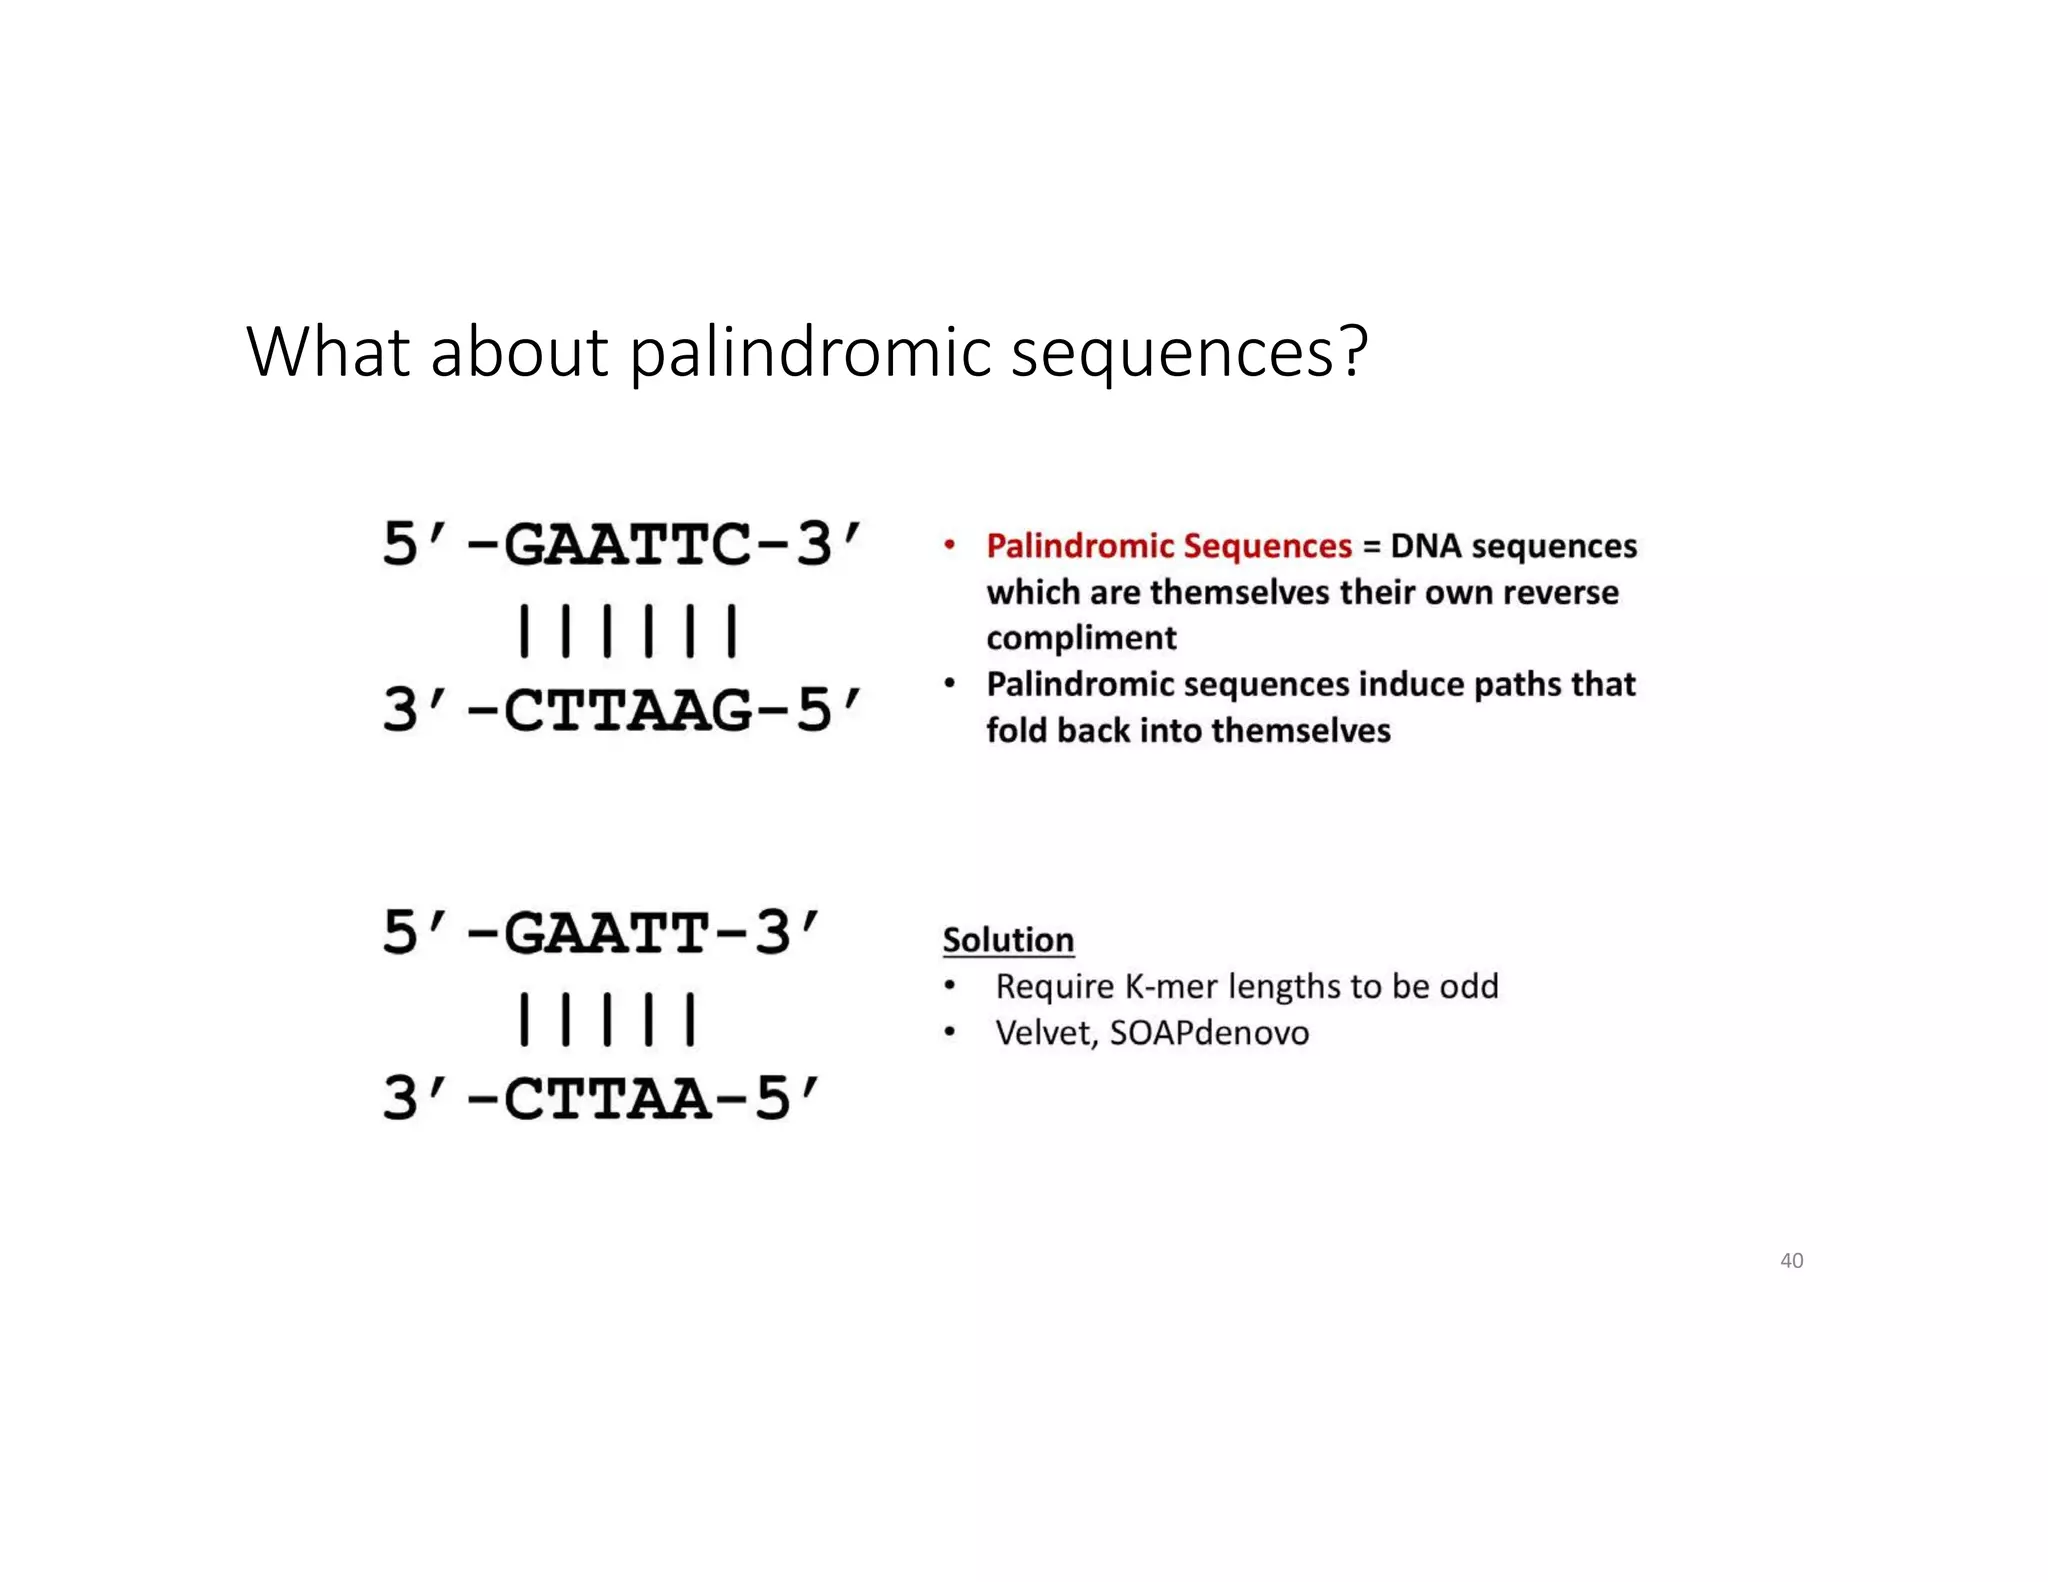
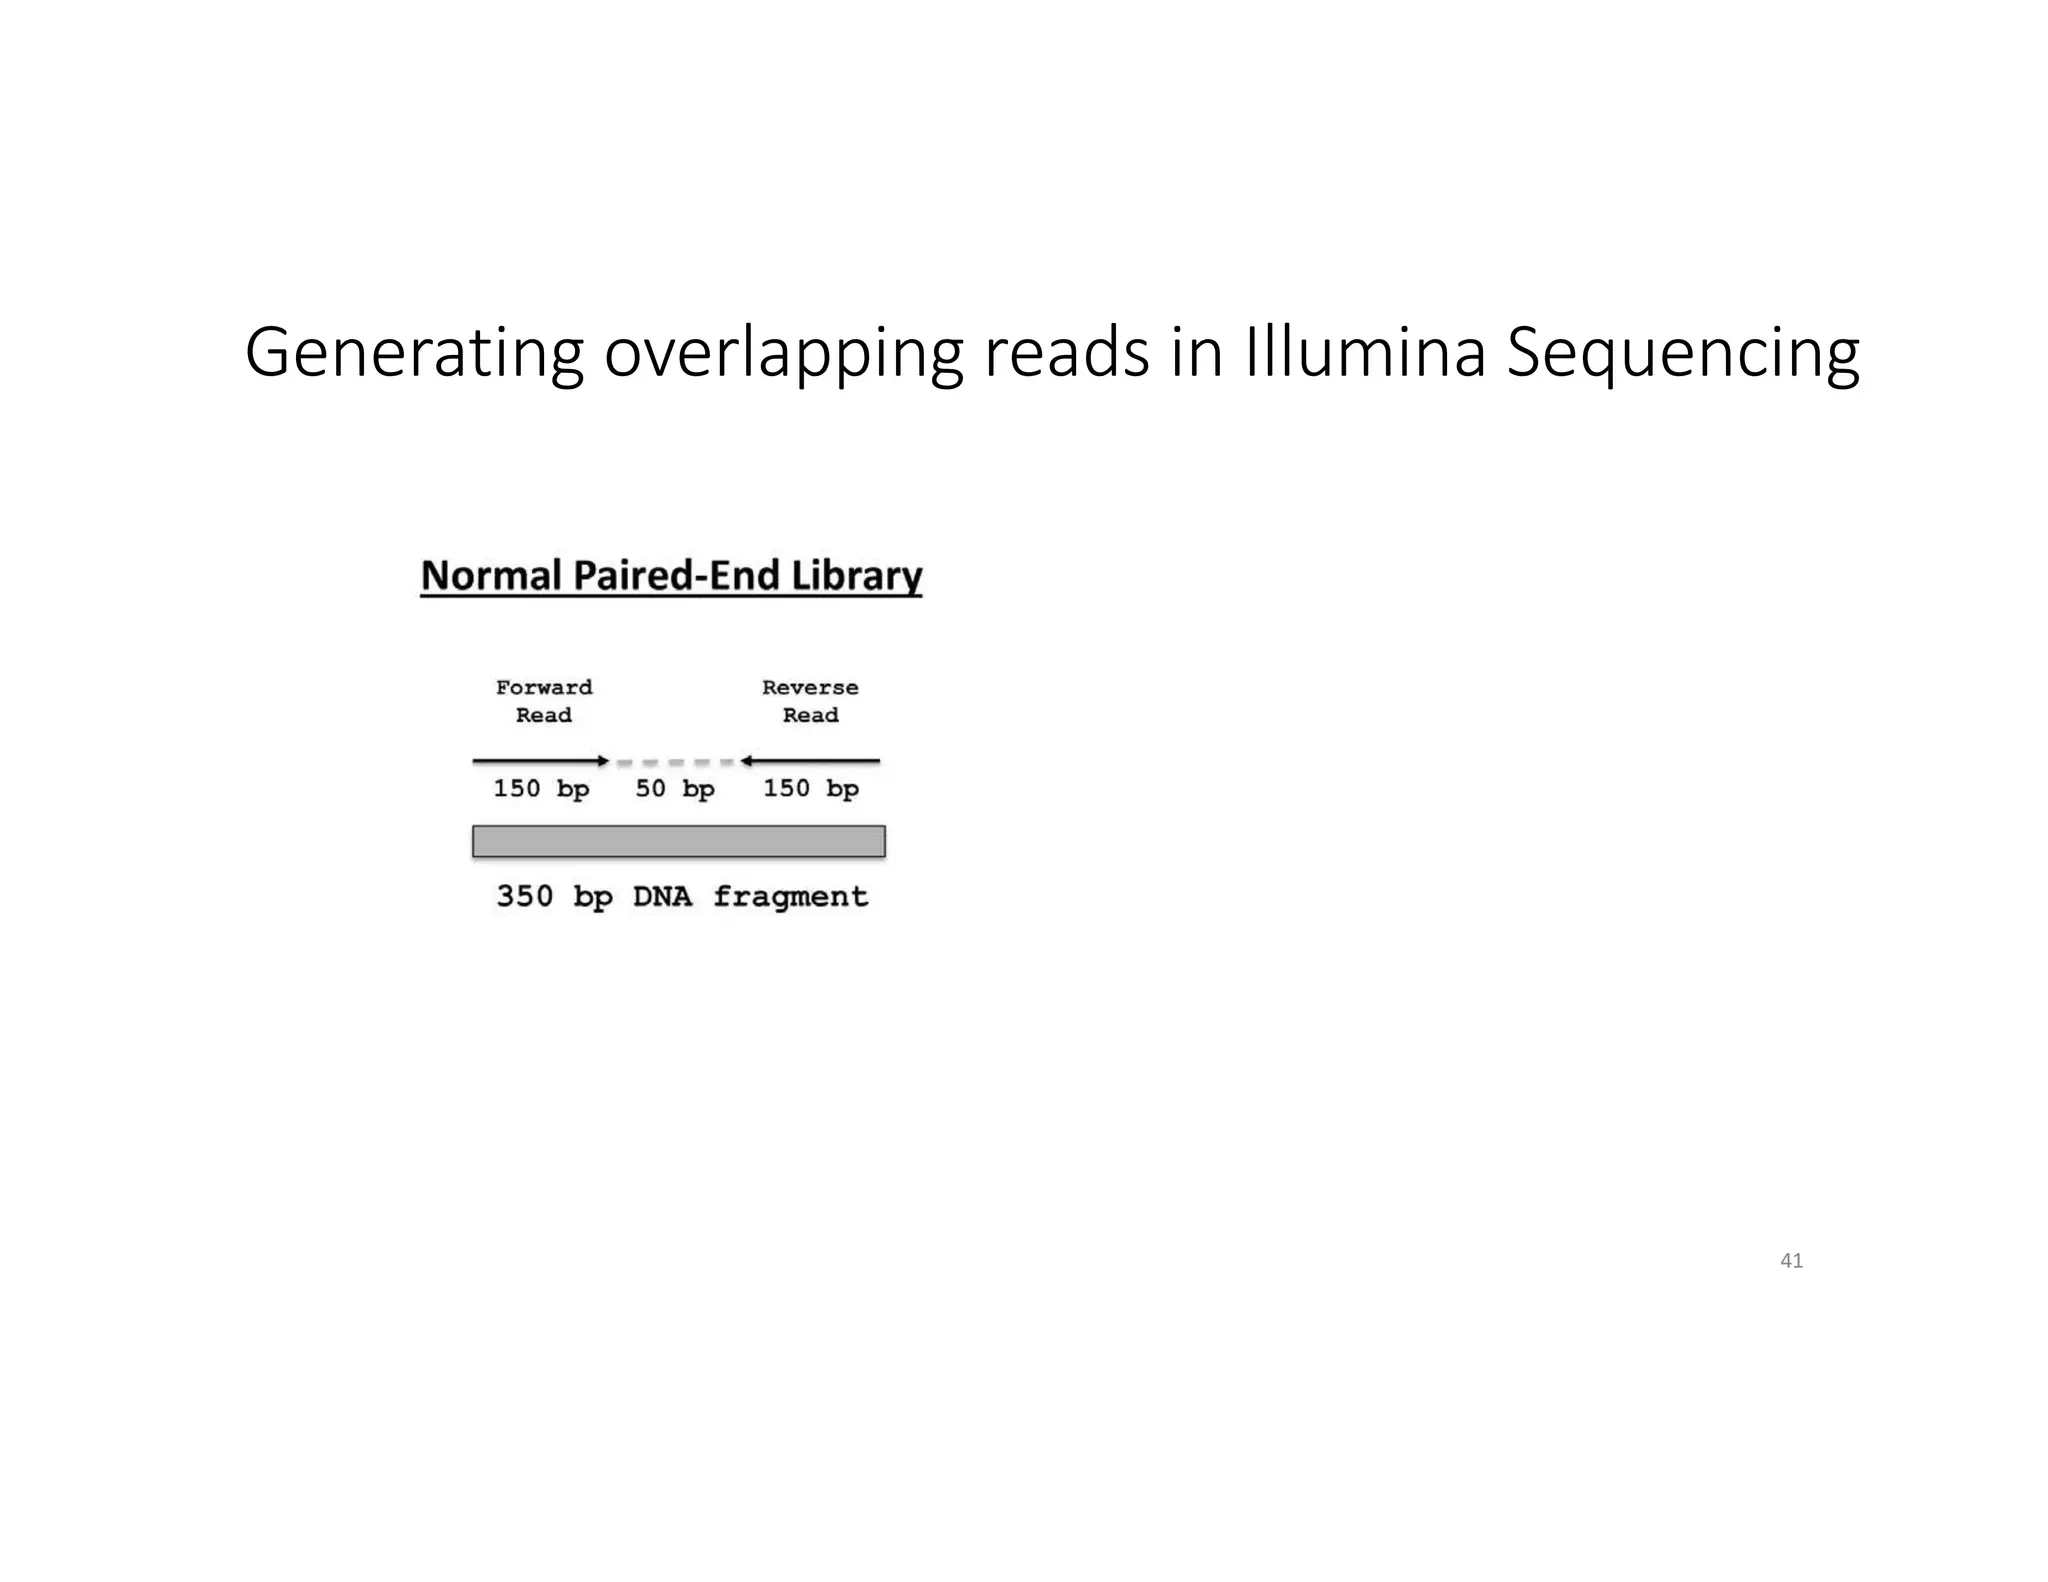

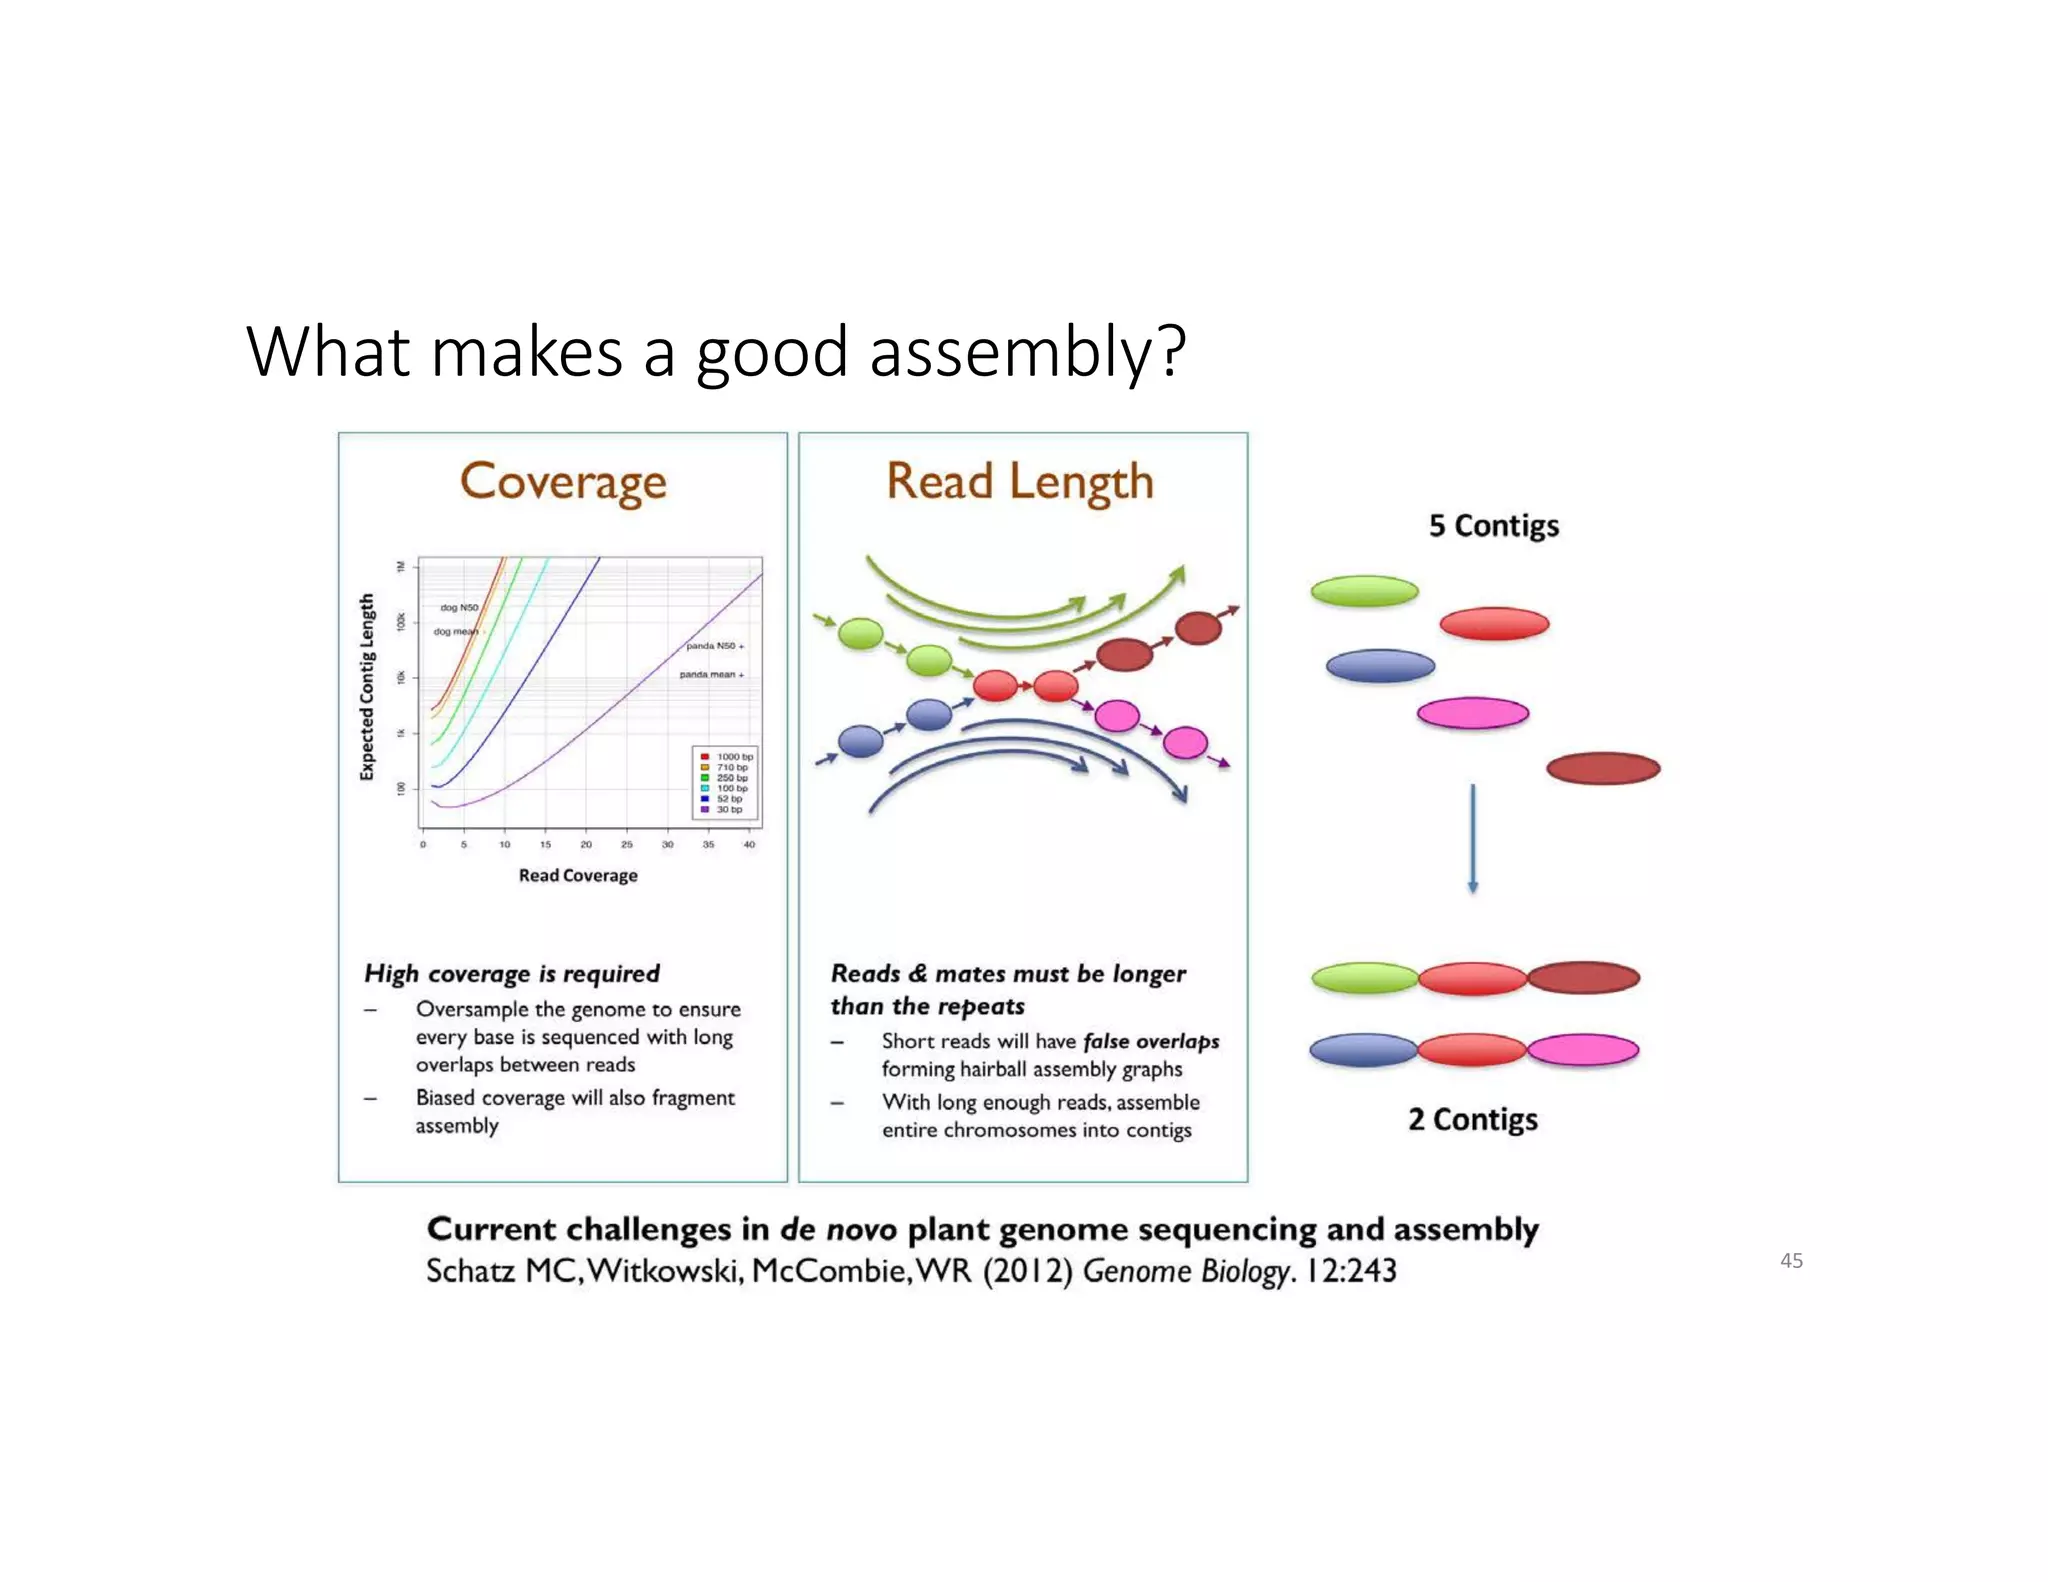
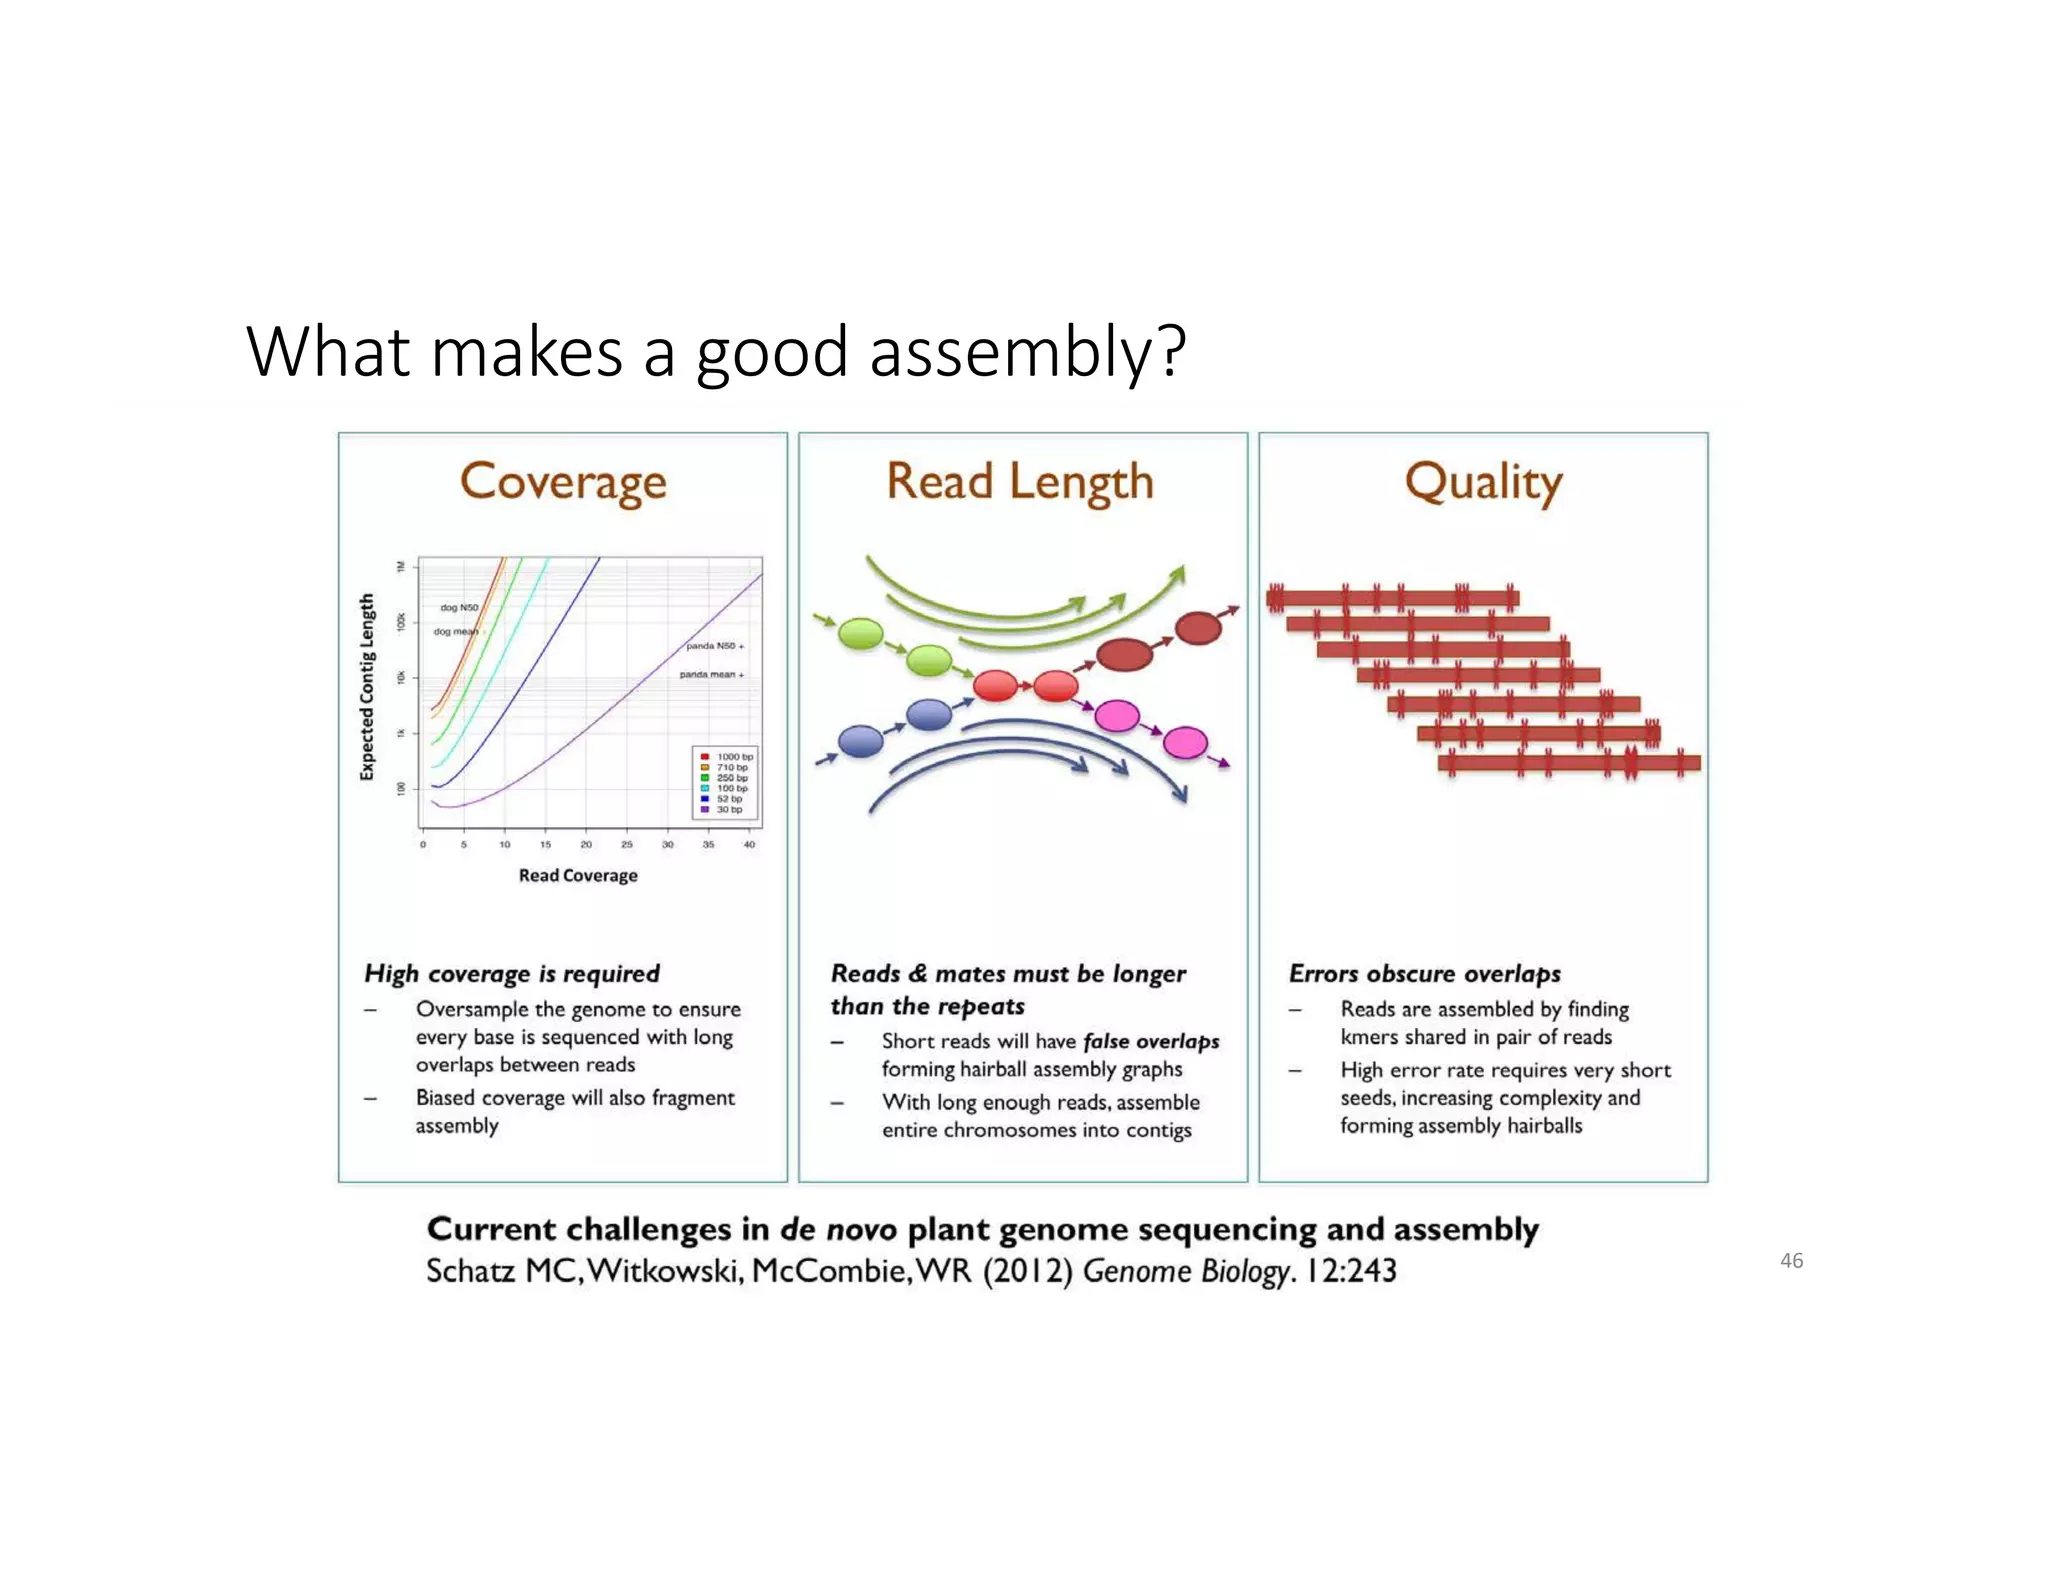

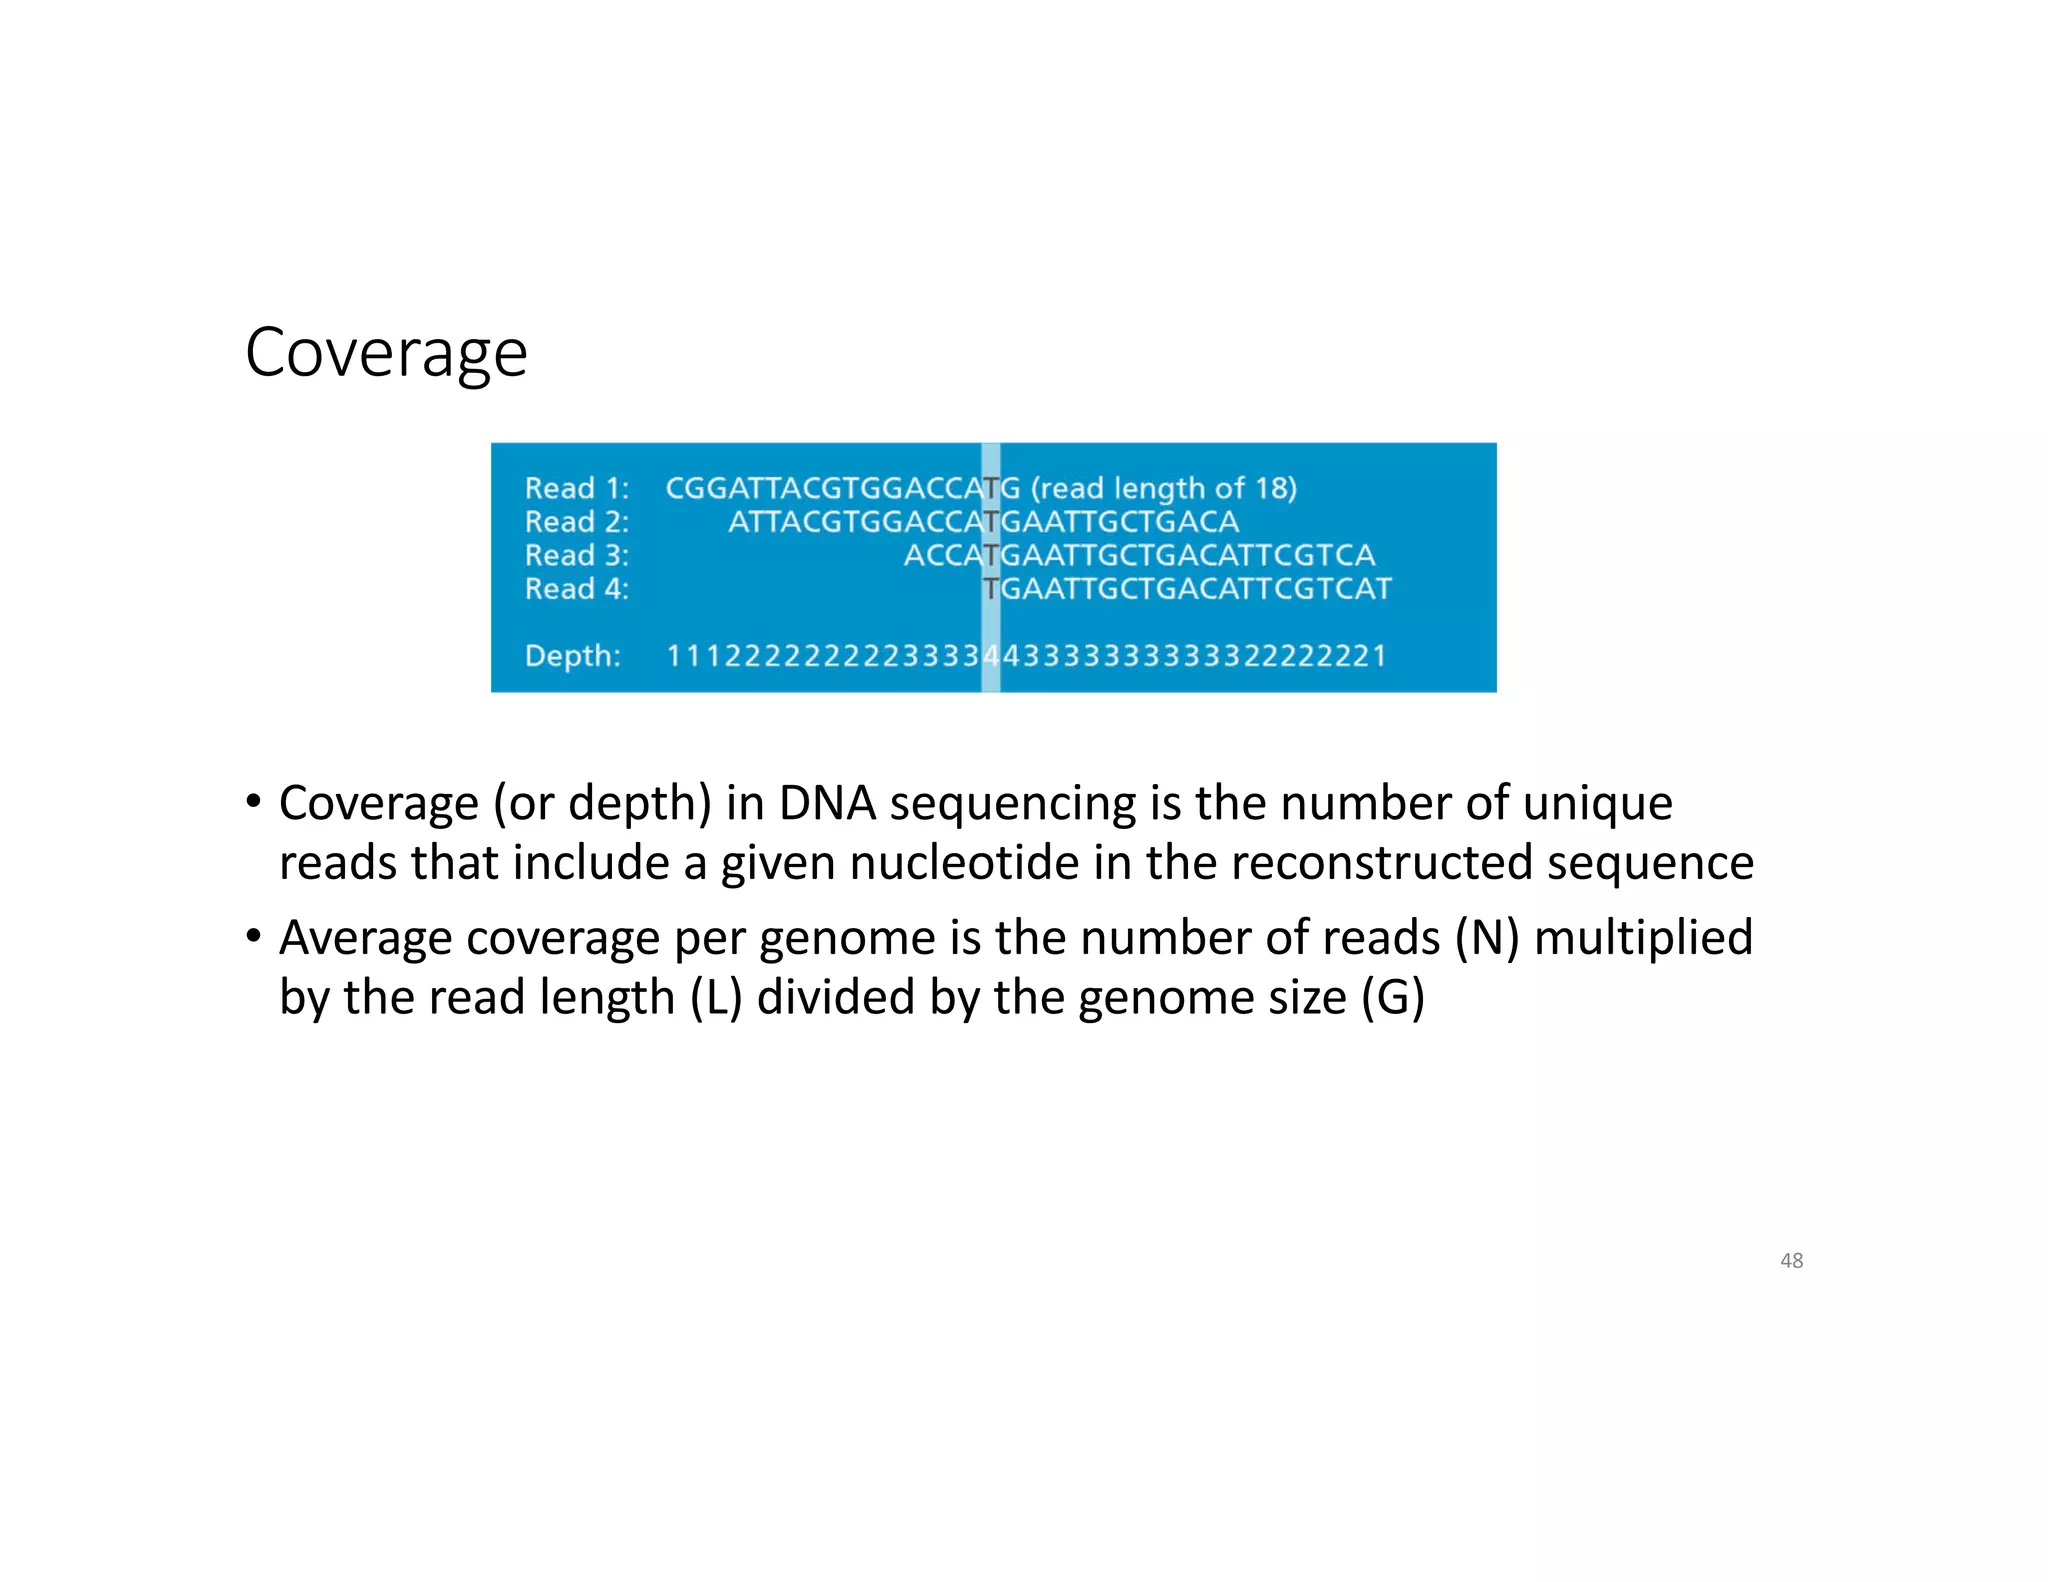
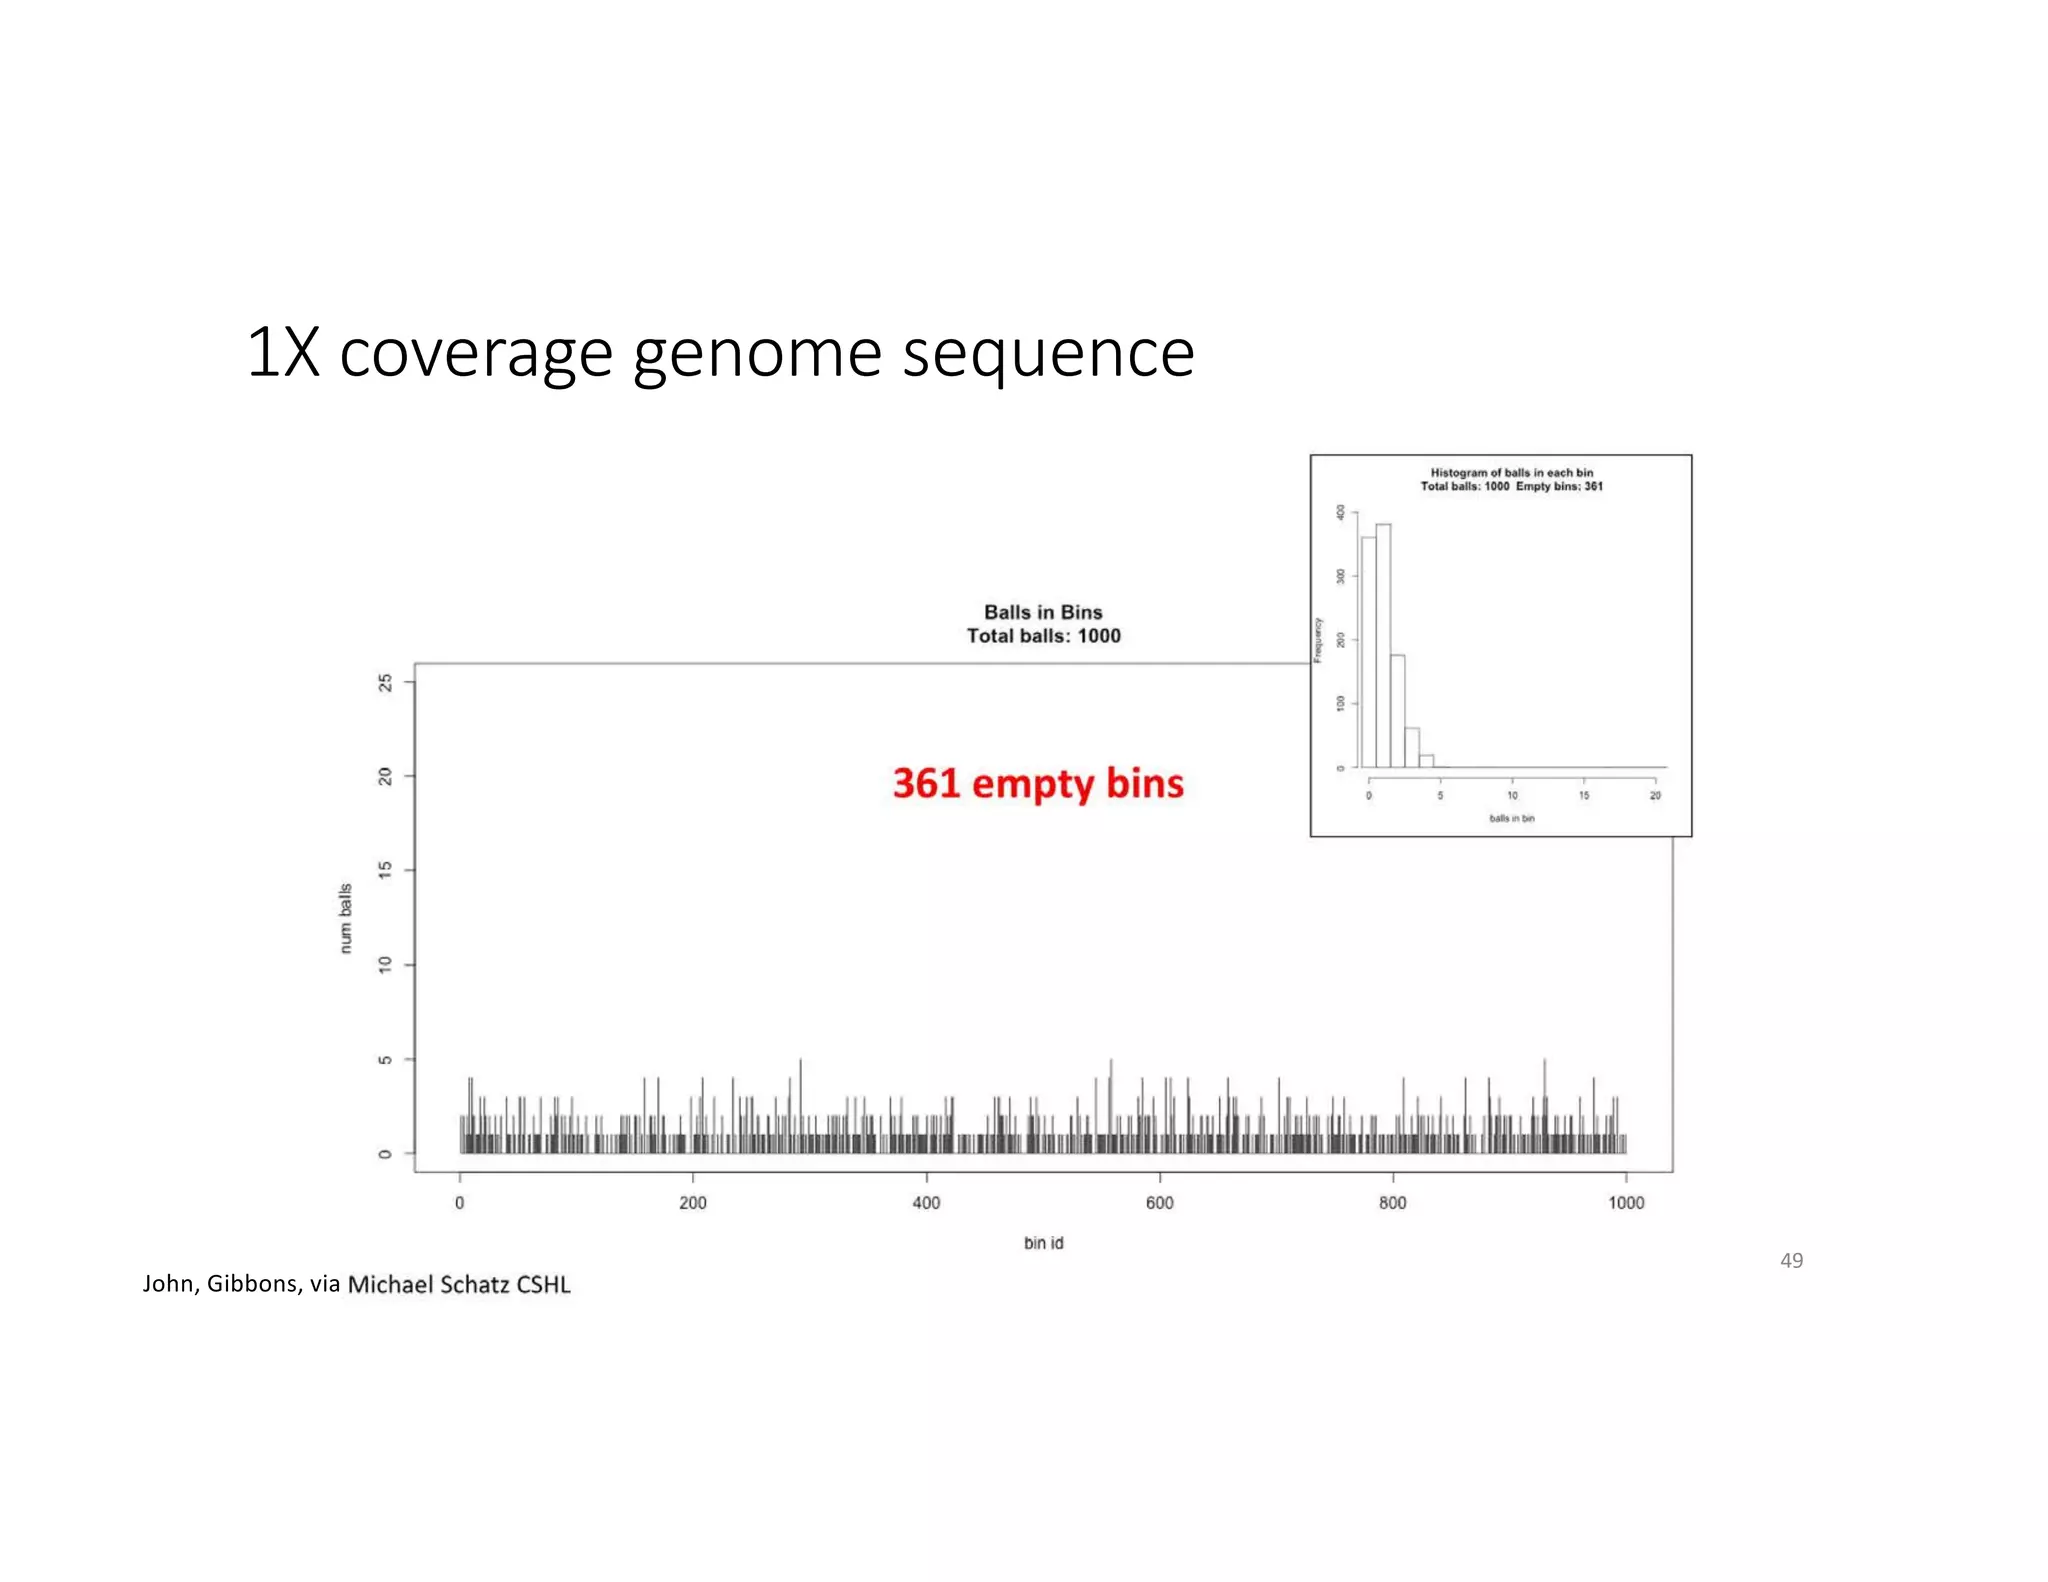
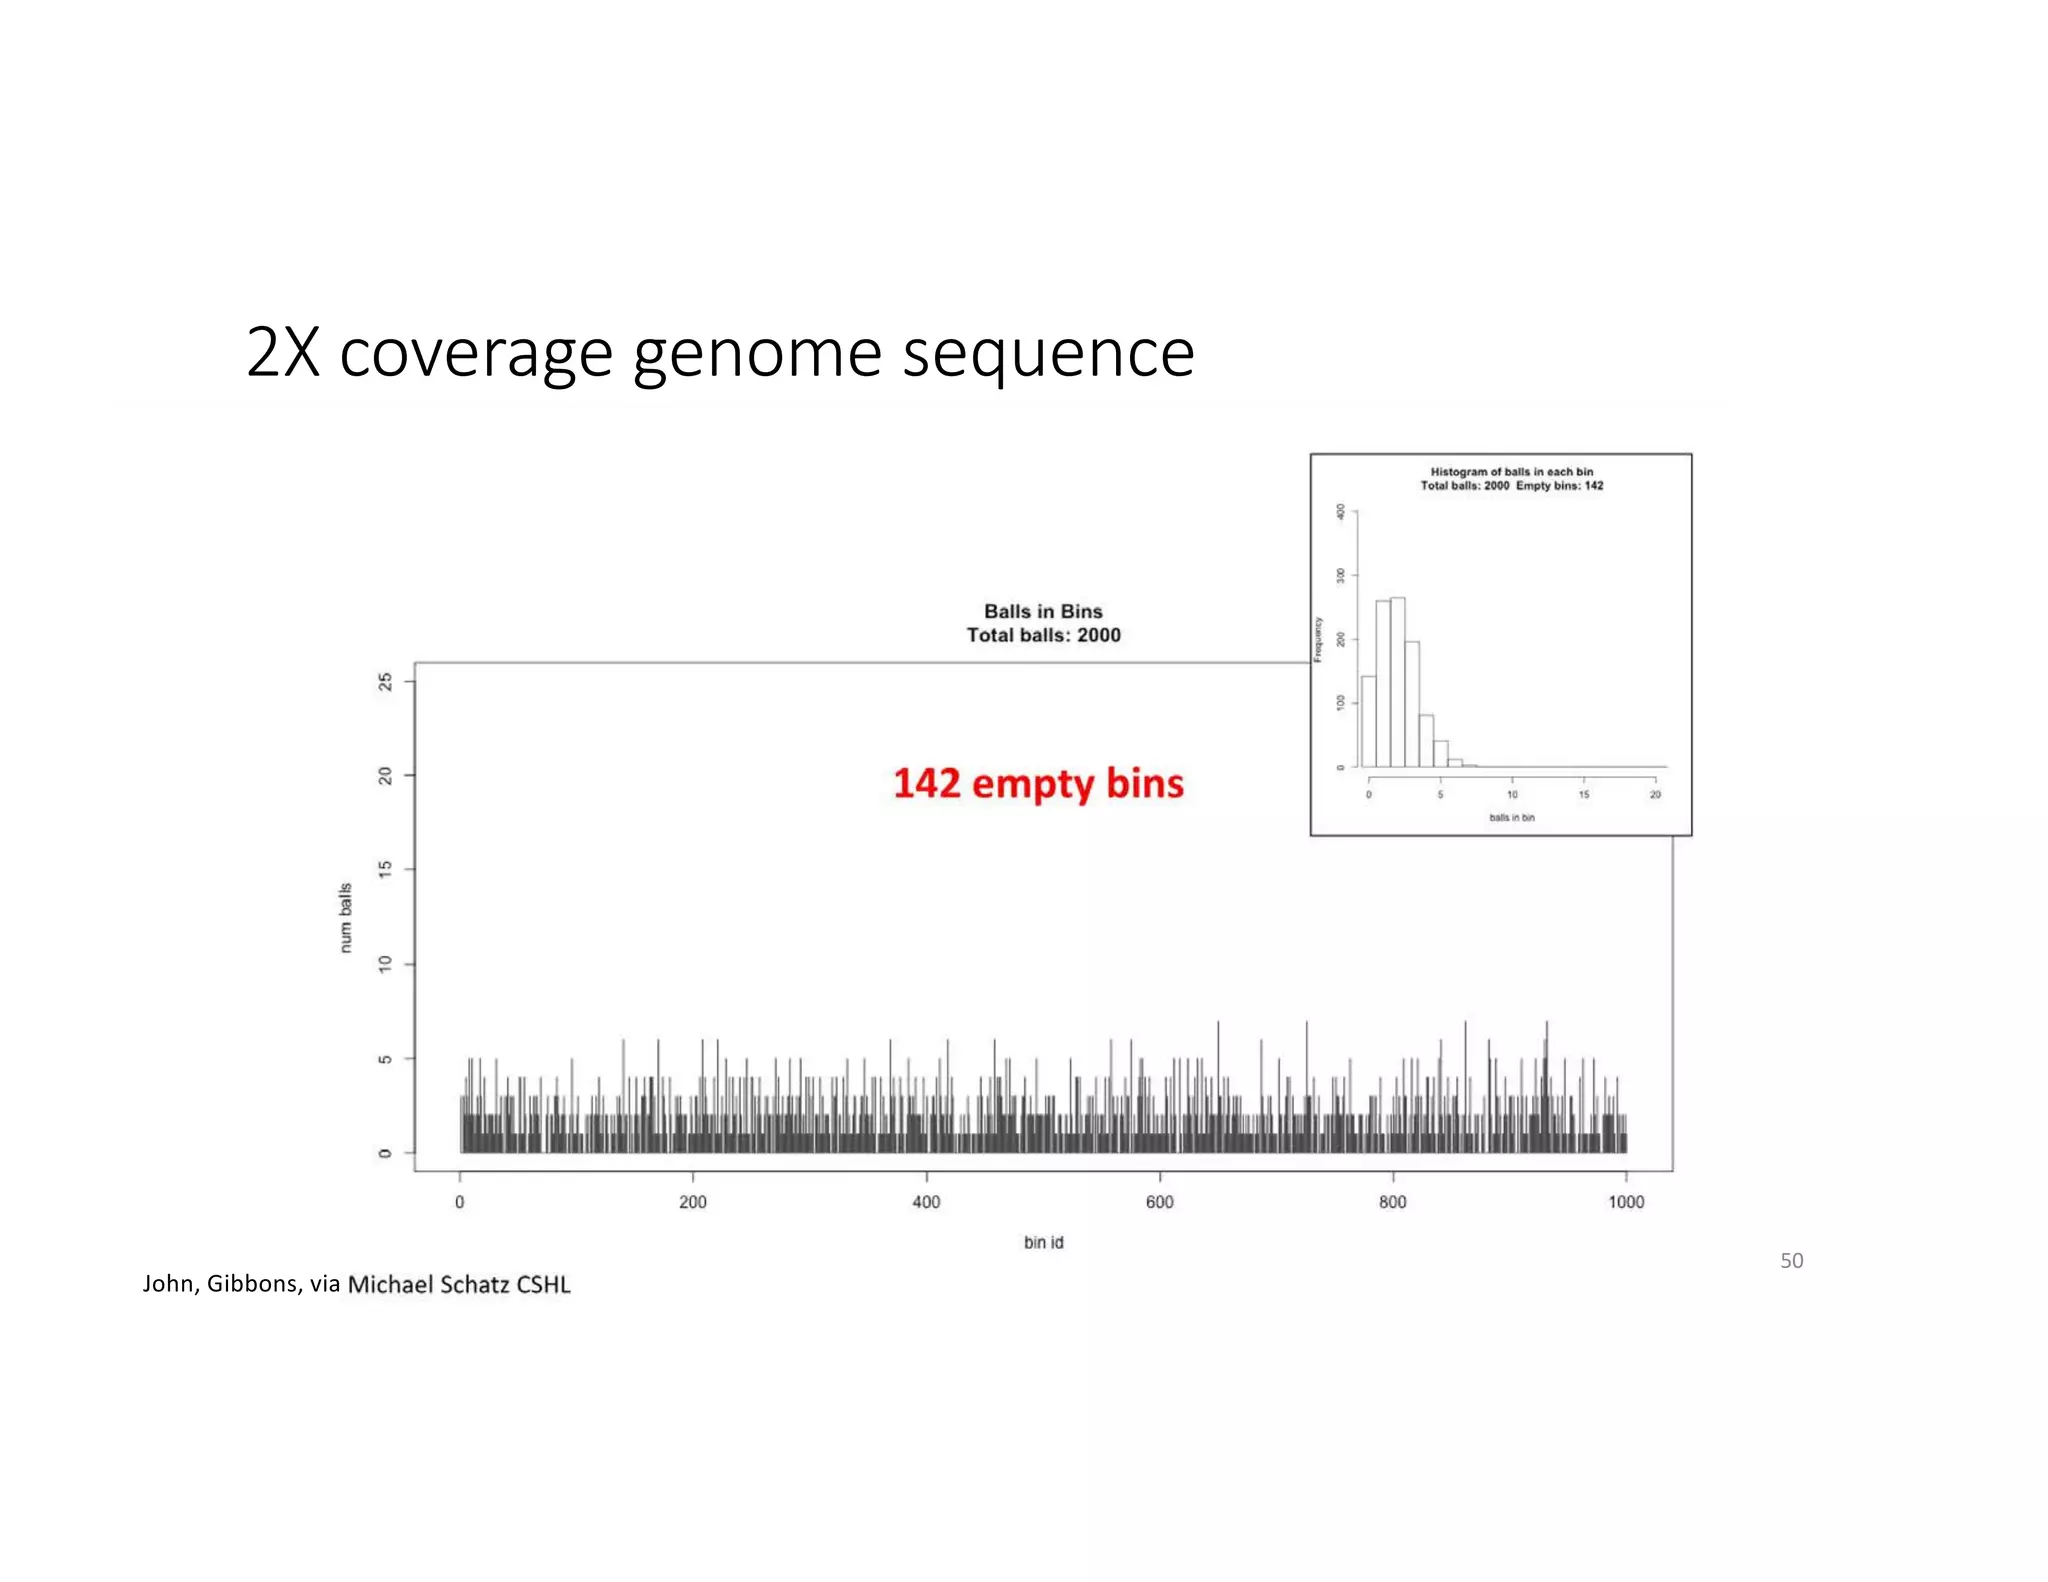
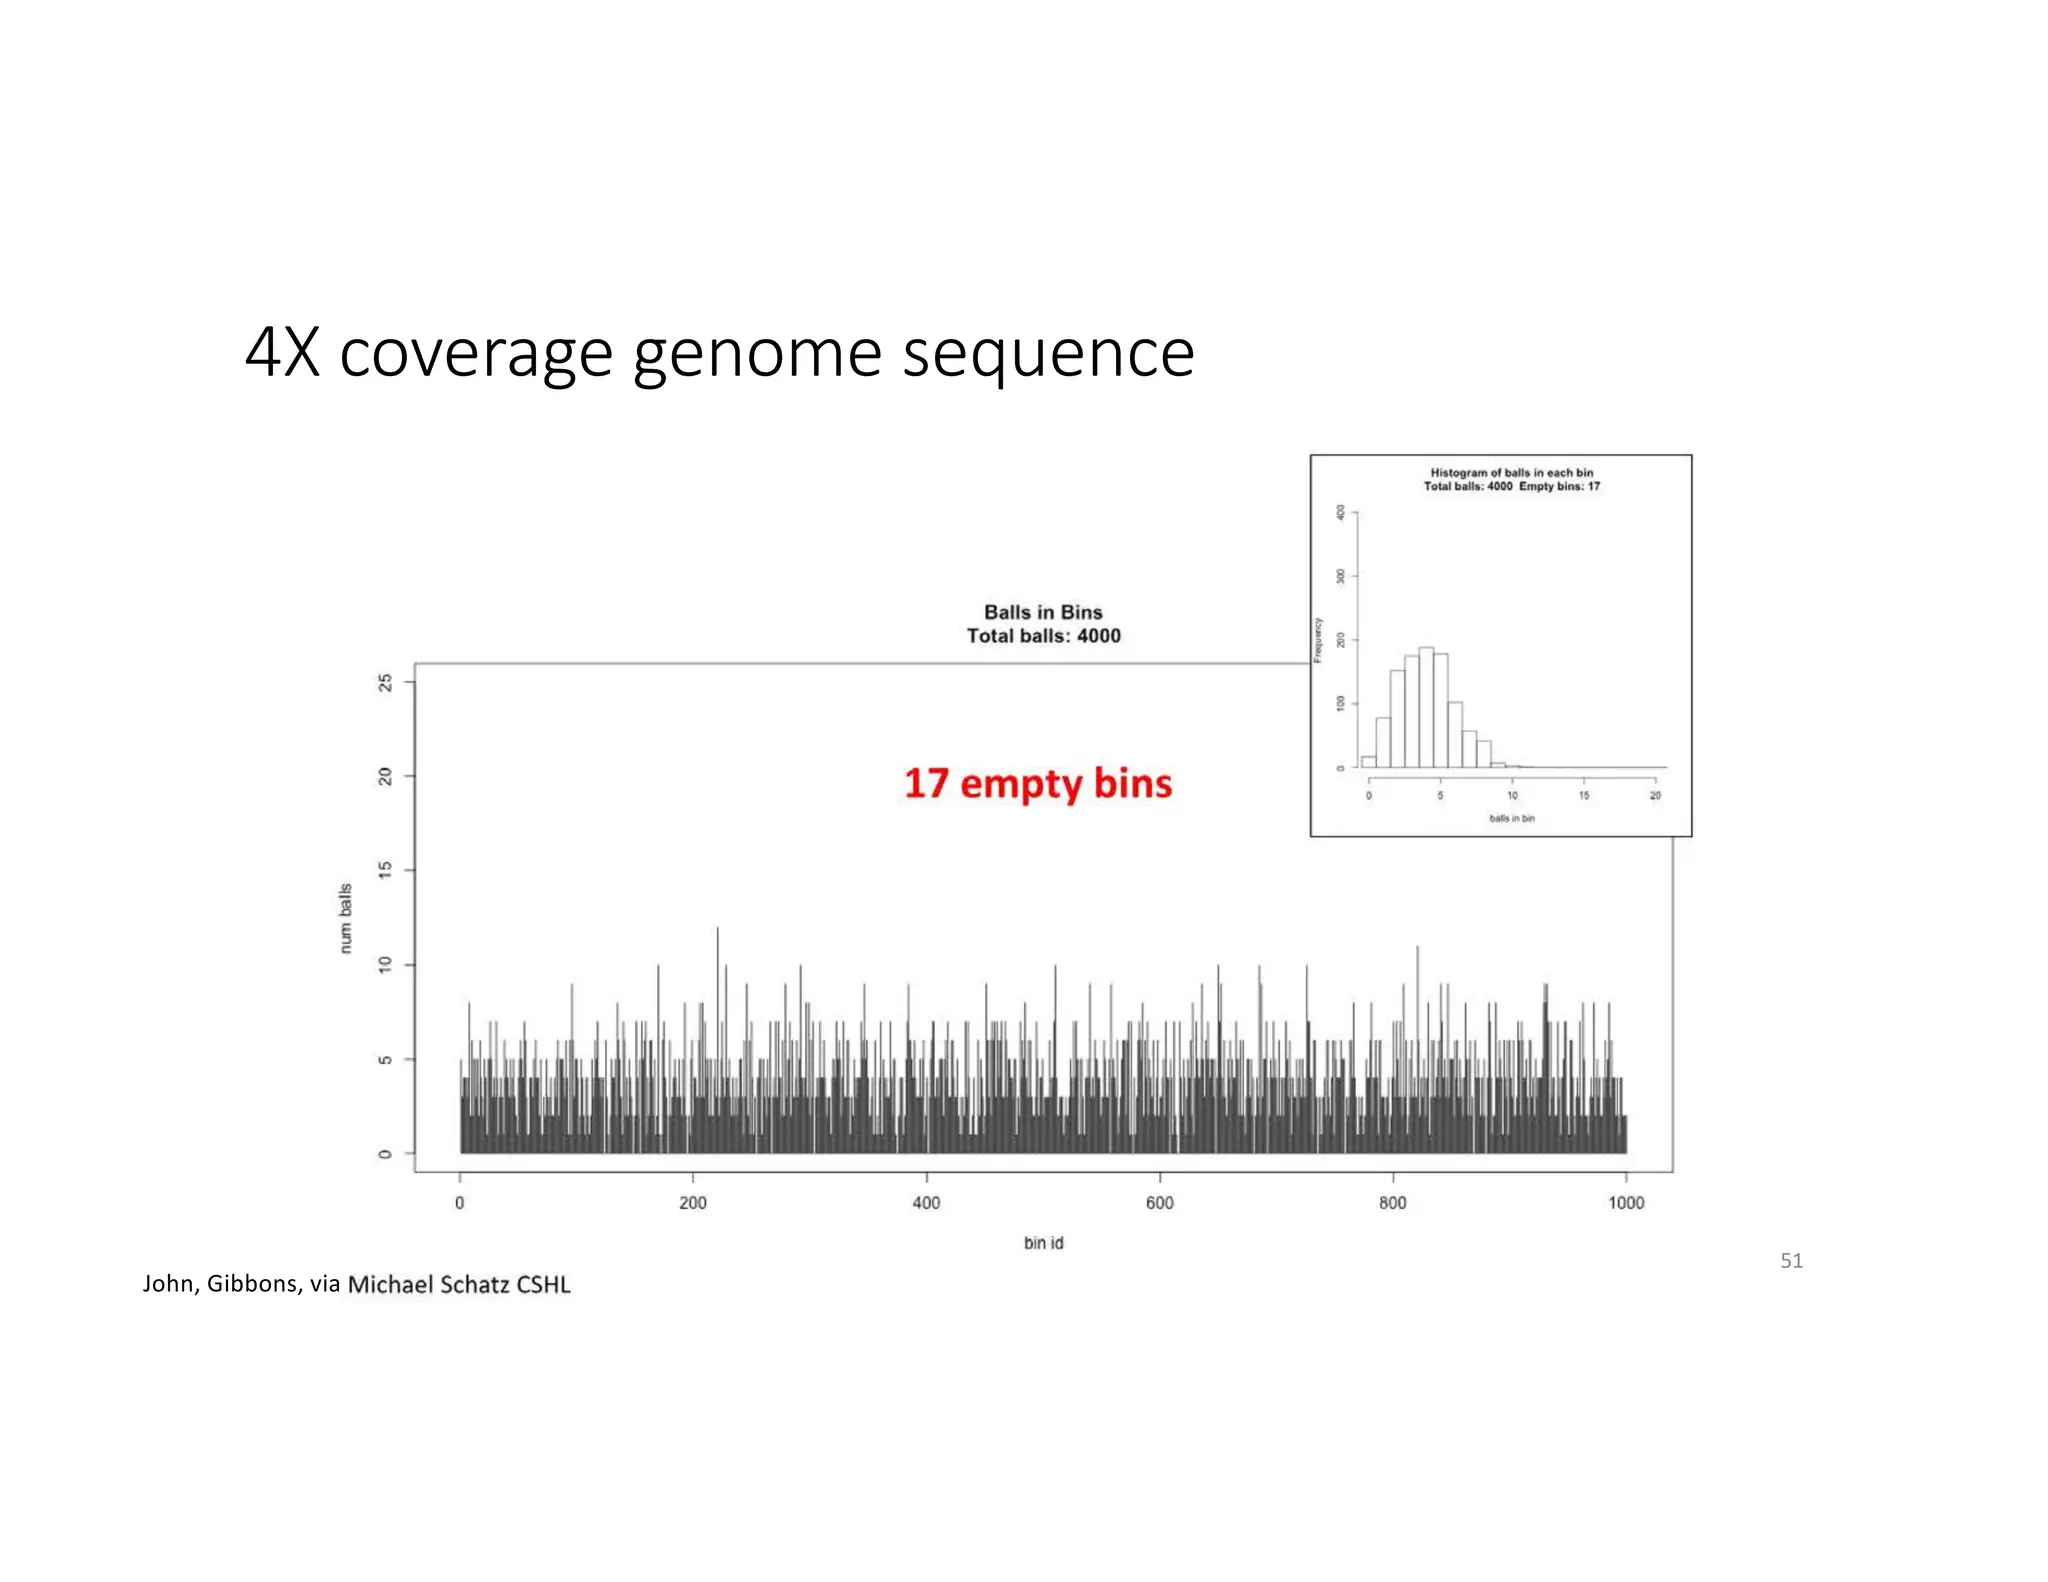

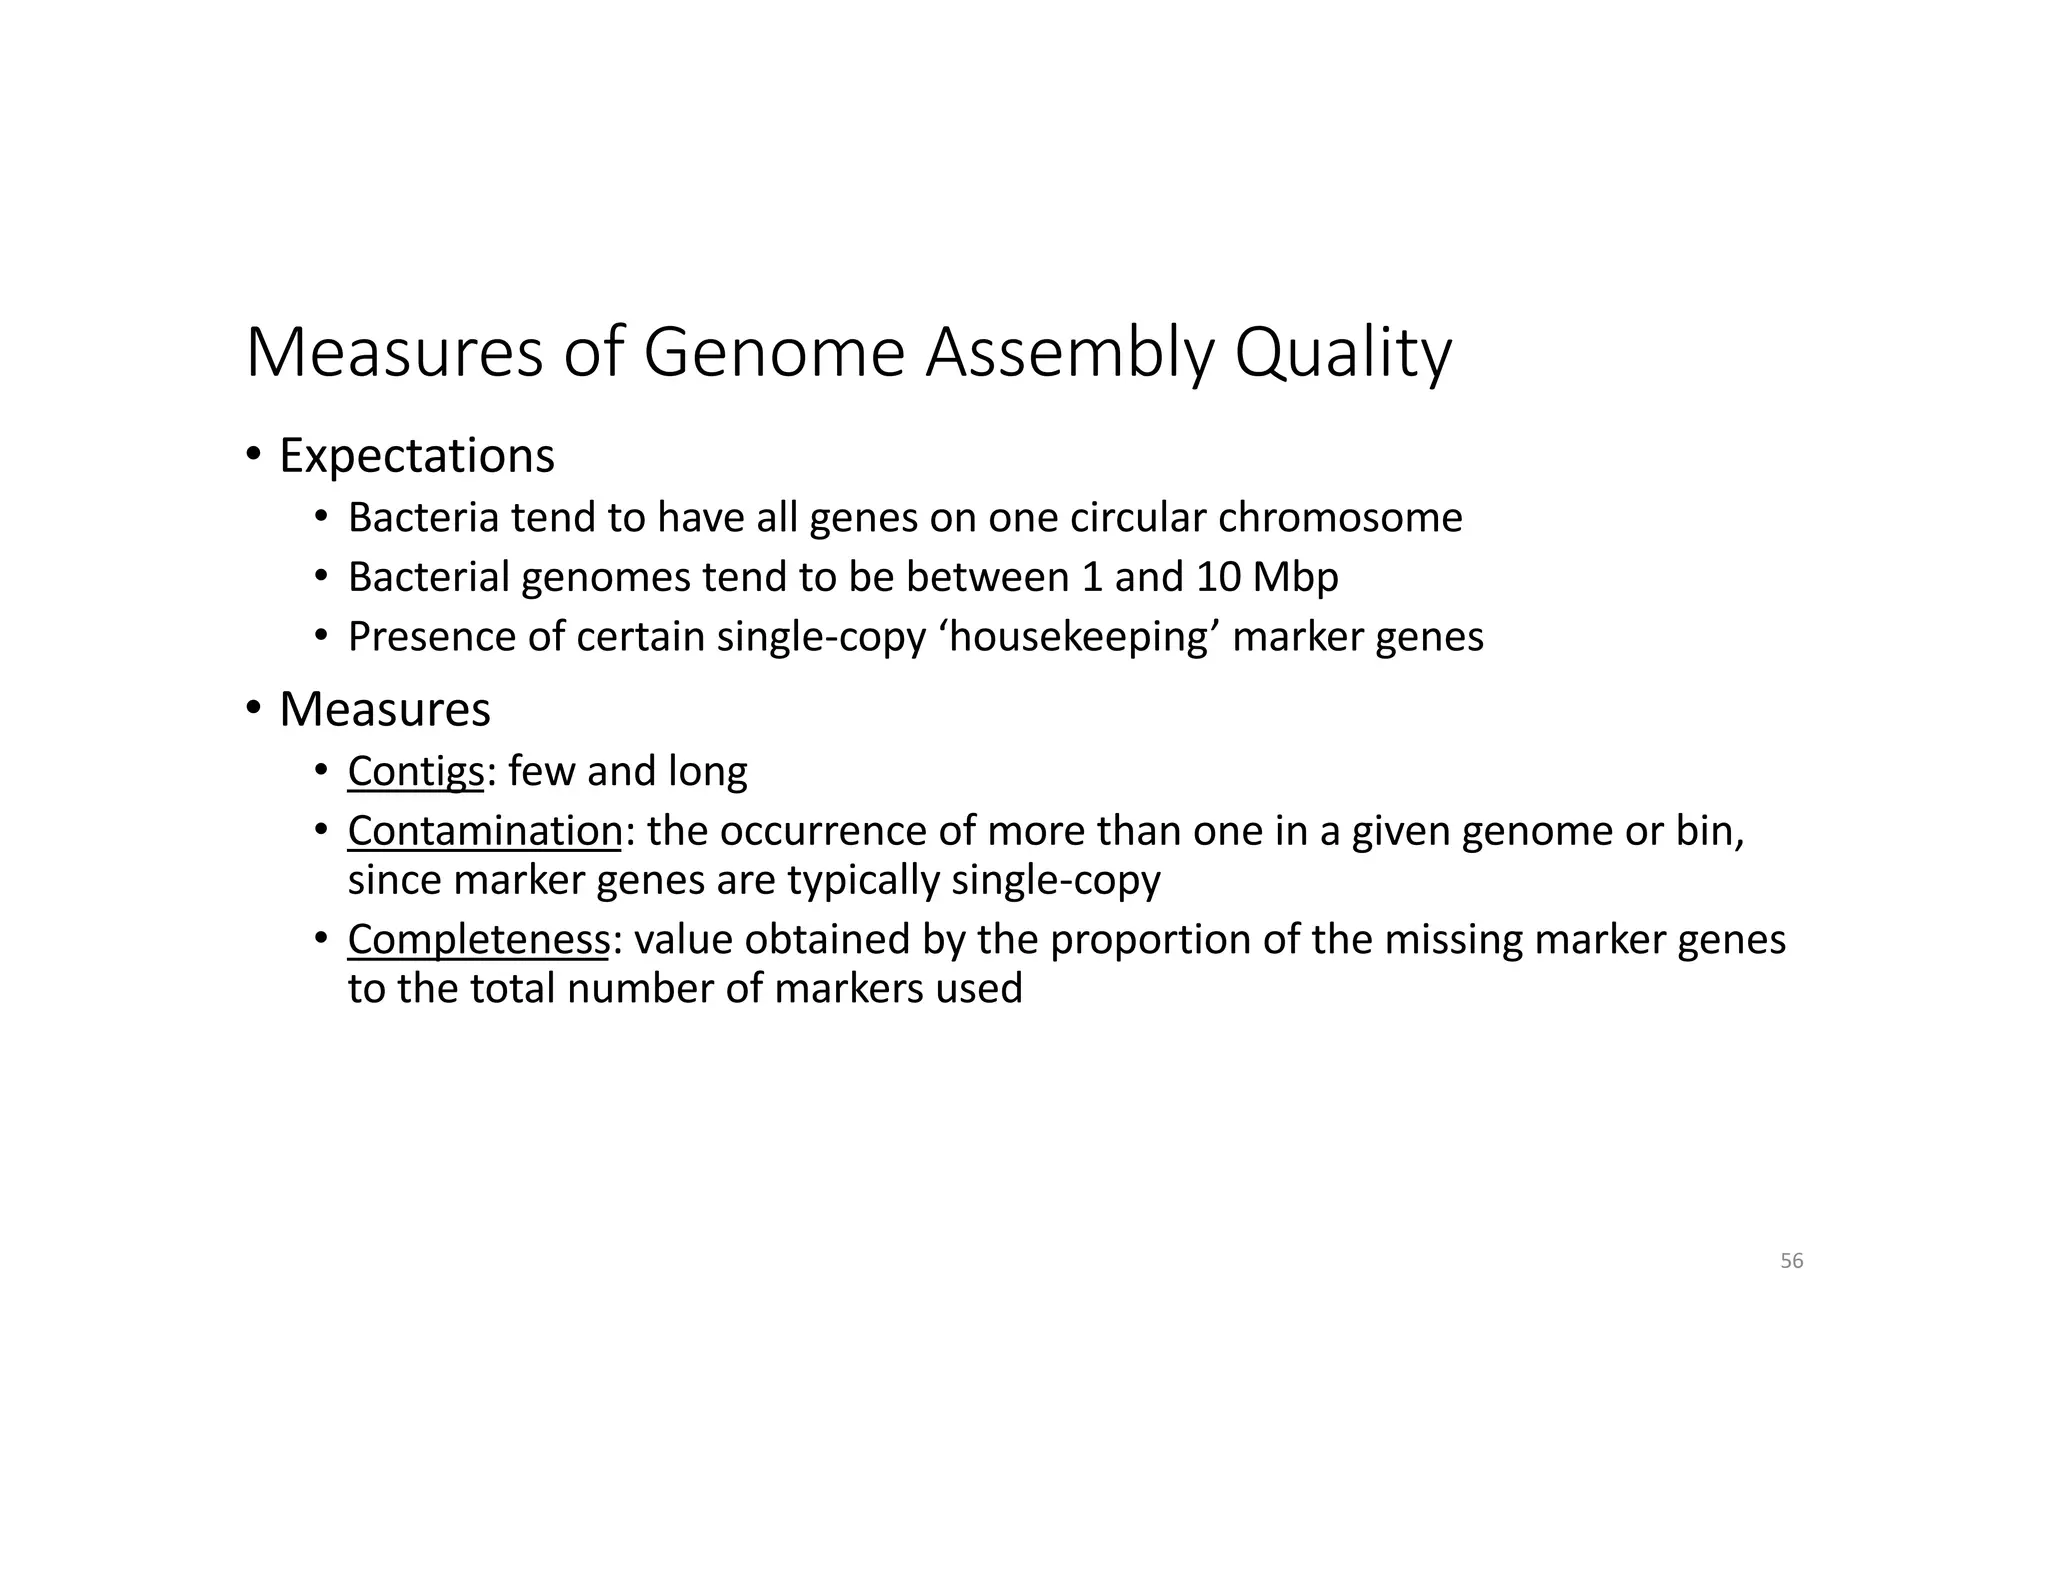
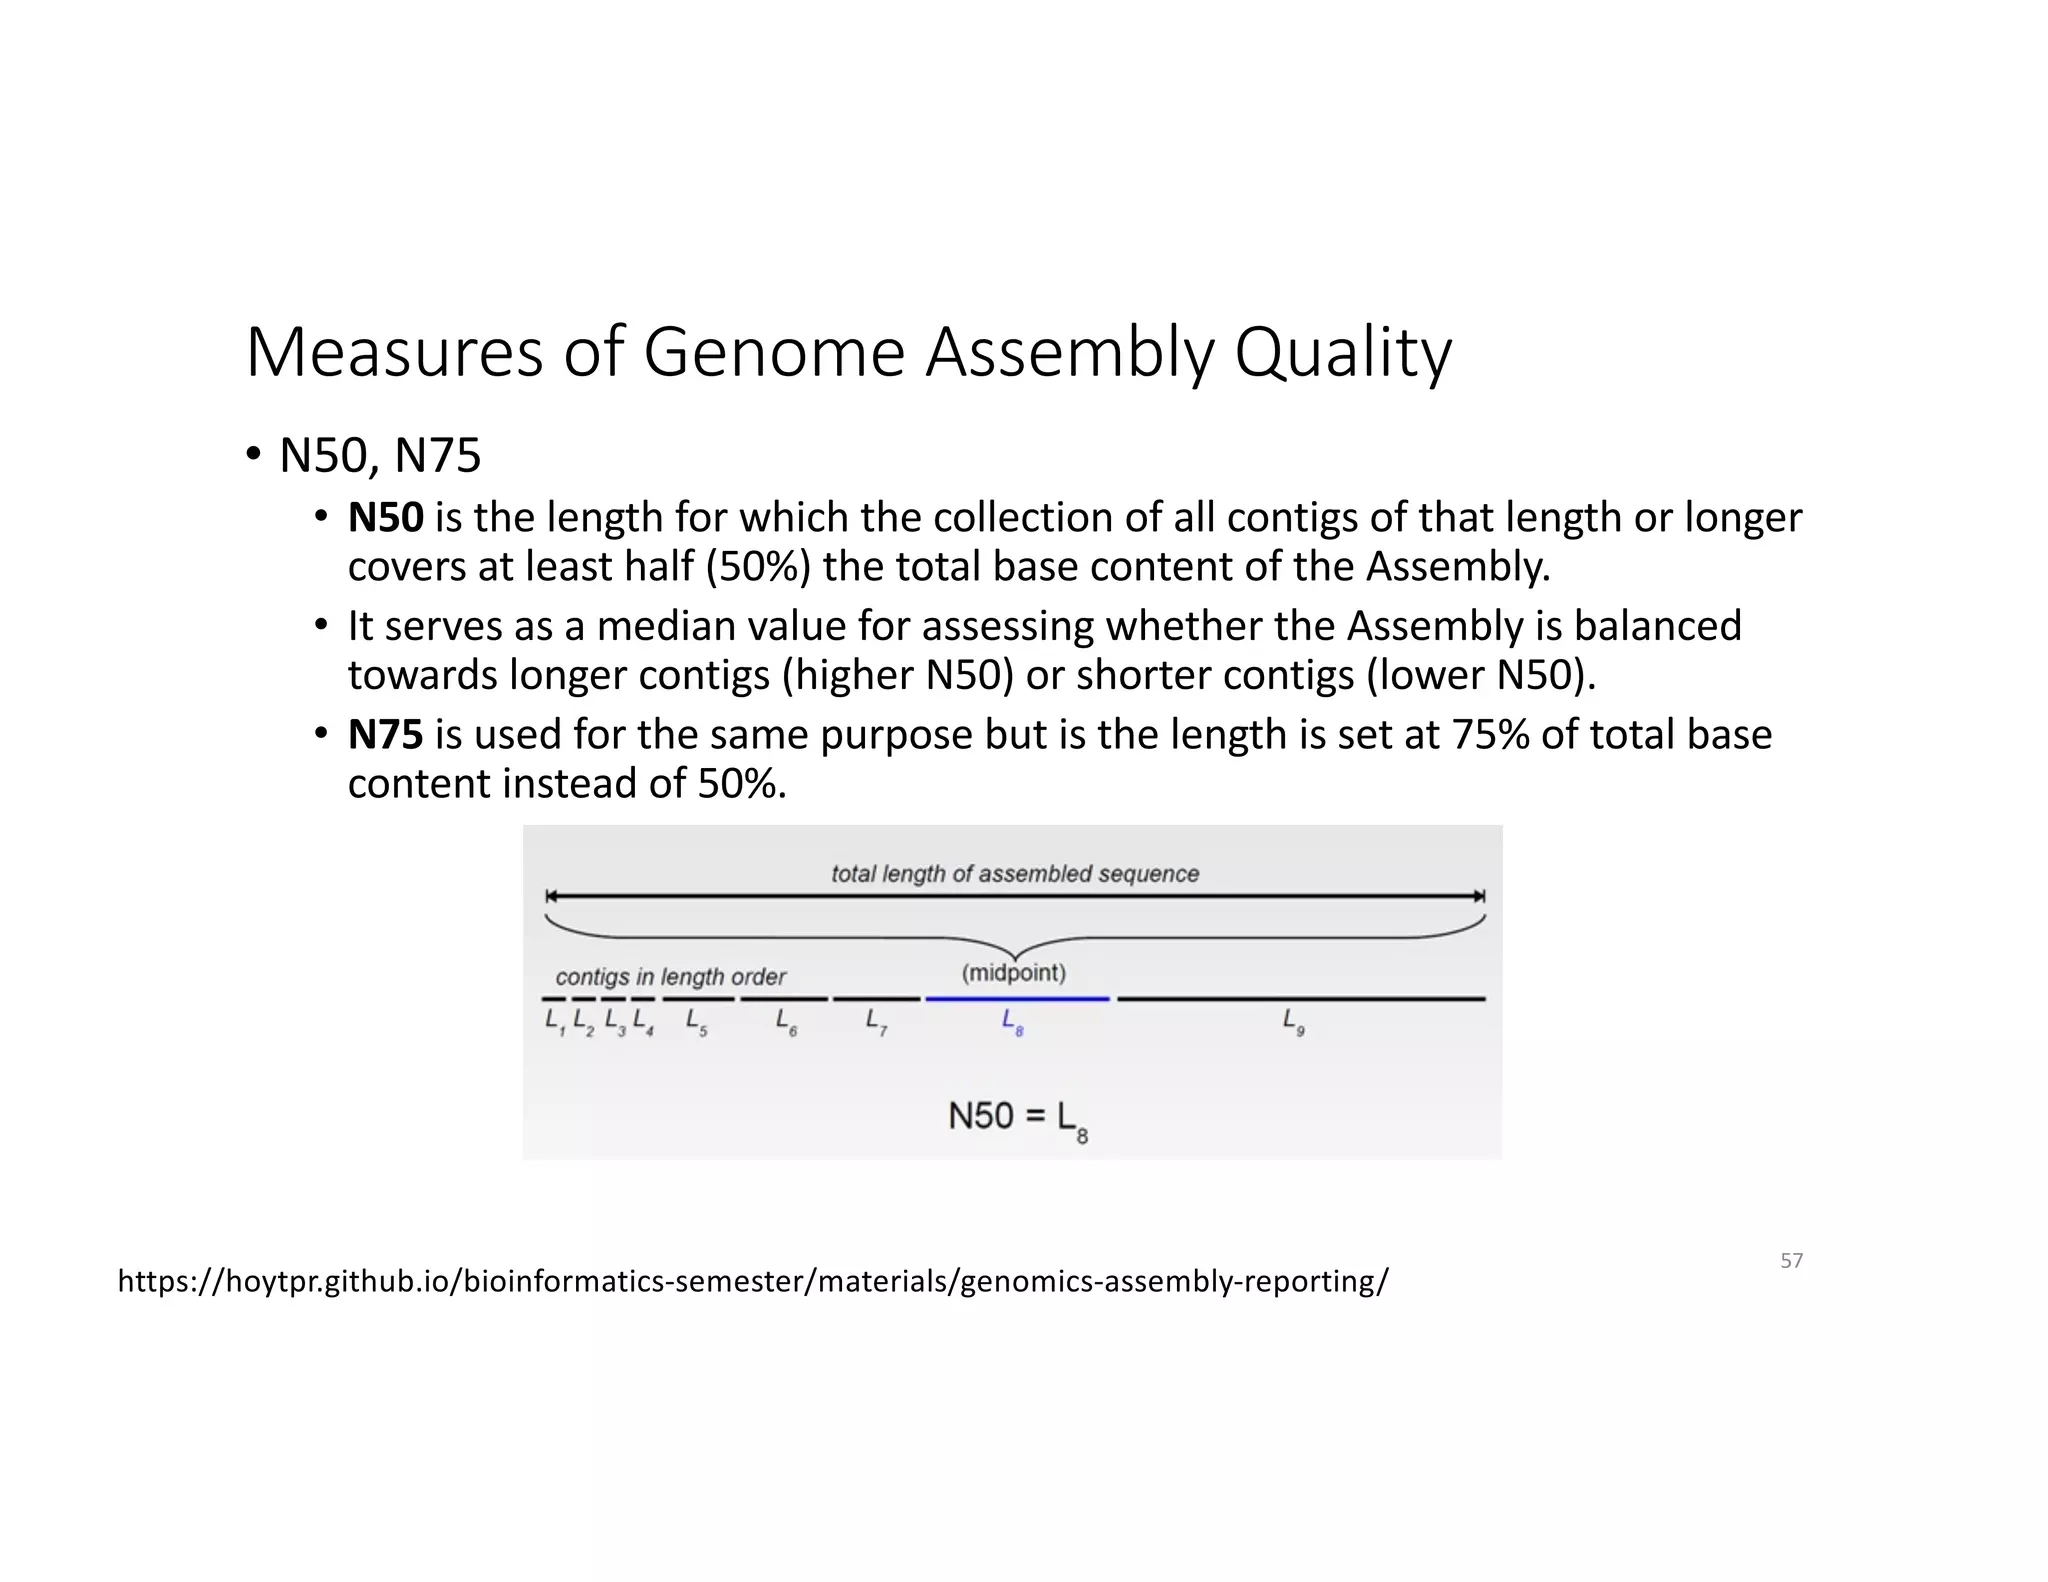

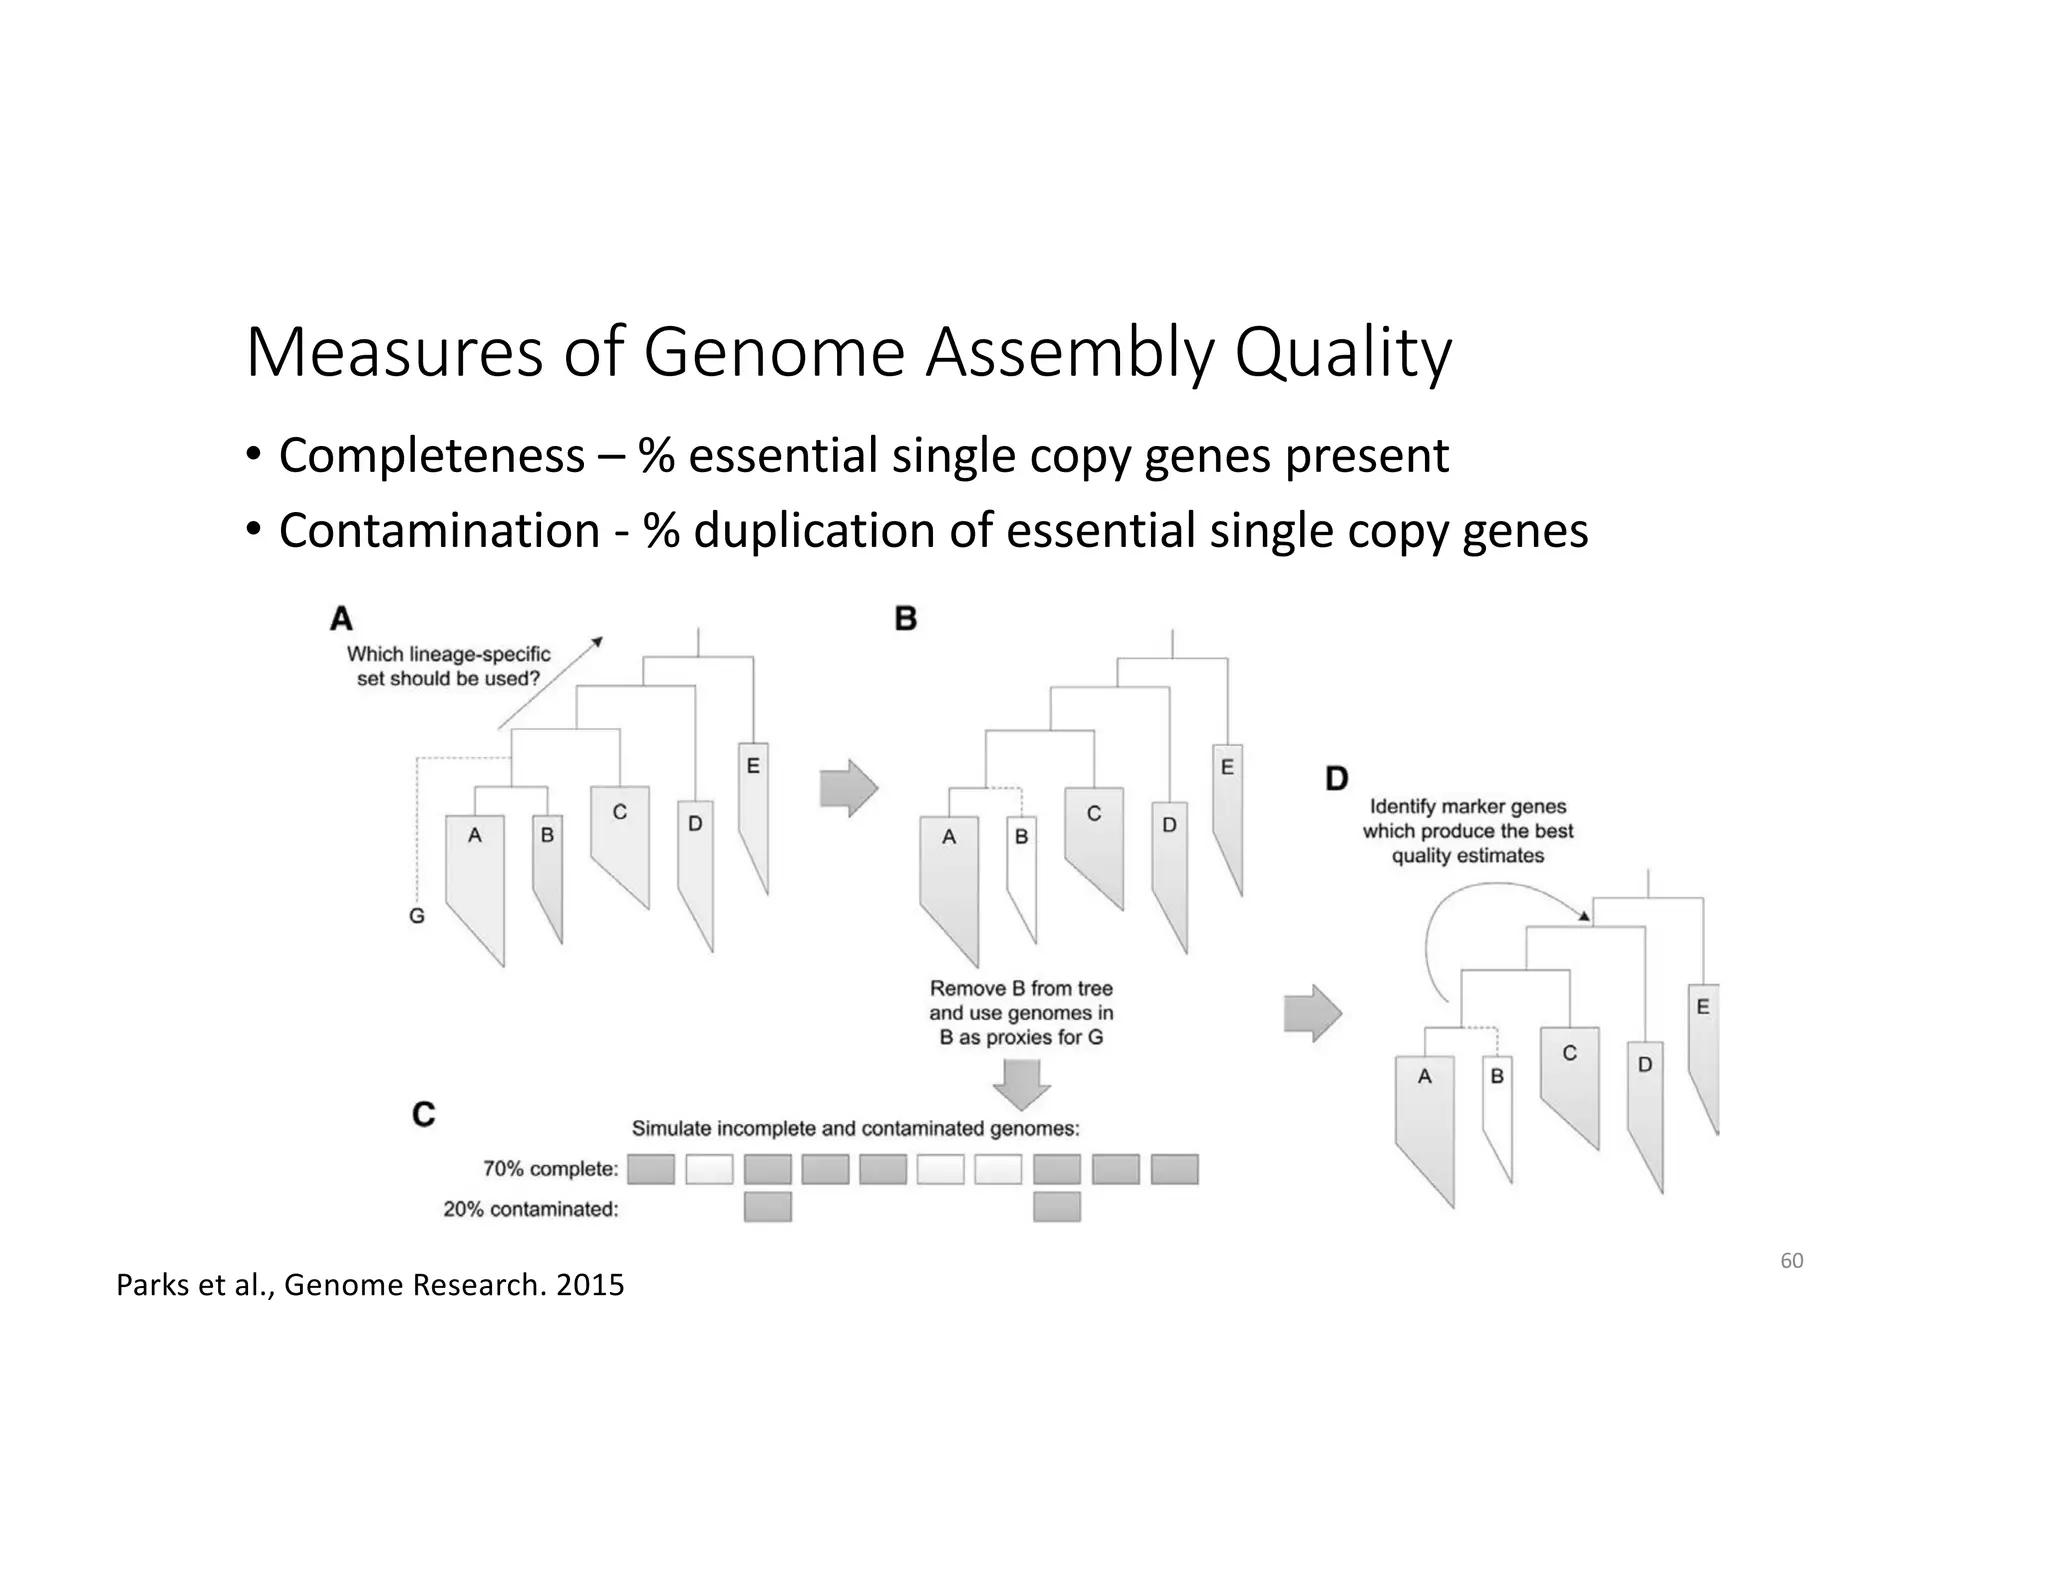
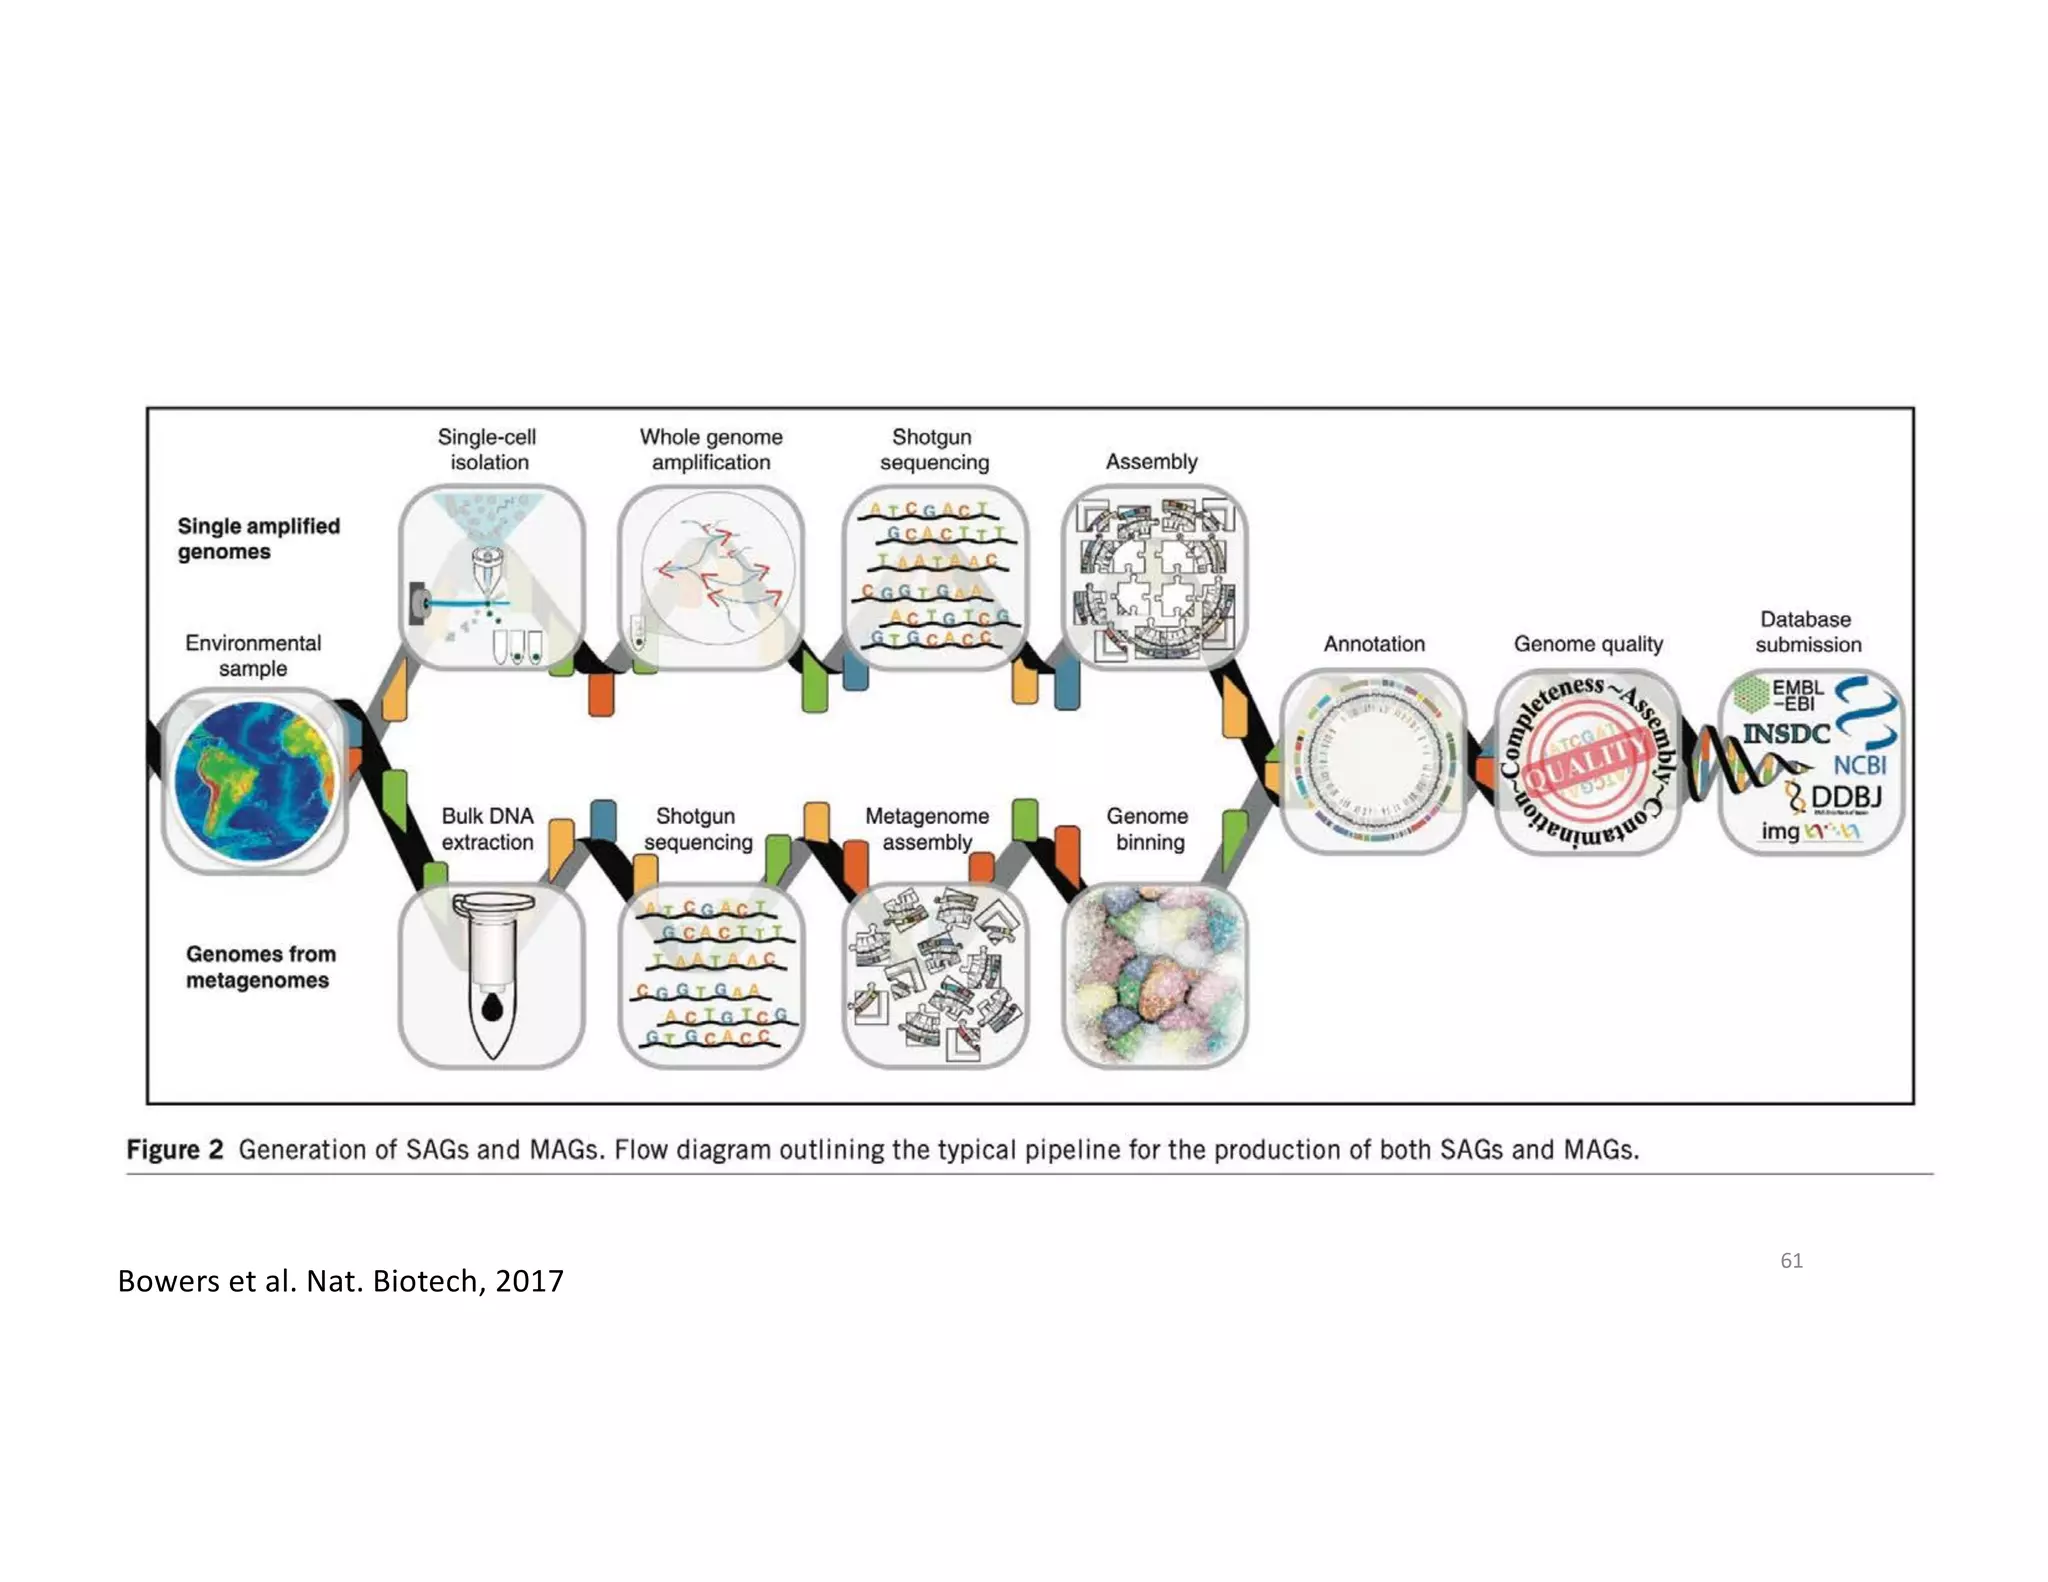


This document discusses genome assembly from metagenomic sequencing data. It defines key terms like metagenome assembled genomes (MAGs) and describes how genome assembly works, including using de Bruijn graphs to assemble short sequencing reads into longer contigs and scaffolds. The document also outlines several measures used to assess genome assembly quality, such as coverage, contig length metrics like N50 and N75, and completeness and contamination measurements.


