Downloaded 226 times
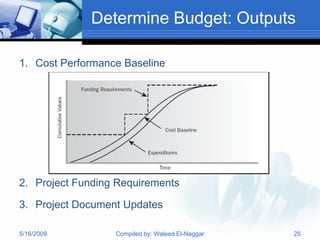
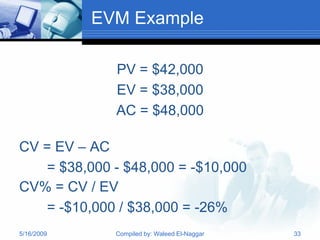
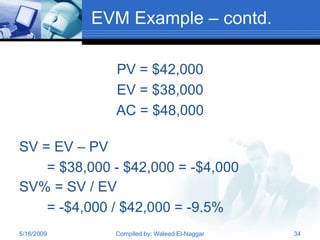
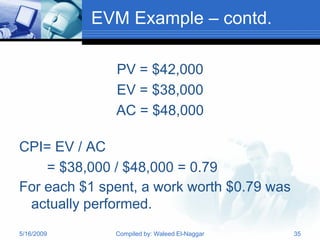

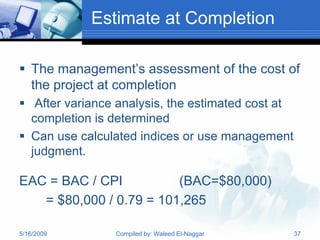
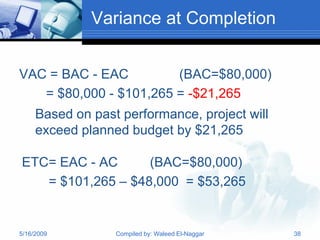
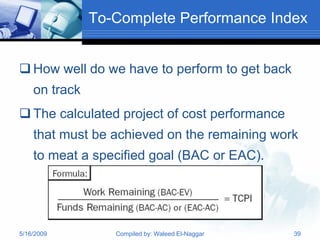
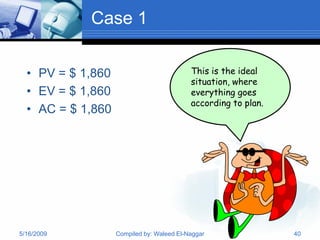
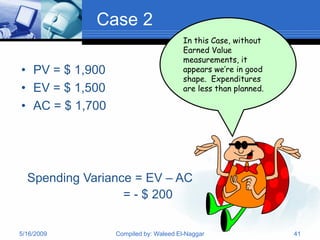


This document provides an overview of project cost management. It covers definitions of key cost management terms, techniques for estimating costs such as analogous estimating, determining a project budget, and controlling costs over the lifetime of a project. The main techniques discussed are estimating costs, setting a cost performance baseline budget, monitoring project performance against the baseline through earned value management, and analyzing variances to manage project costs.


