Downloaded 115 times
![Take away of Project - Commercial
SUPPLIER 1st Indian Supplier to develop & supply >80% of
CUSTOMER requirements of hub & main frame castings in fully
finished condition
During Project at SUPPLIER, important numbers (Cummulative)
[Average Casting weight considered-12MT]
– Details Qty. Weight %
– Castings Produced : 2653 Nos. 31836 MT 100
– Castings Direct OK : 1859 Nos. 22308 MT 70
– Castings Conc OK : 288 Nos. 3456 MT 11
– Castings Rejected : 506 Nos. 6072 MT 19
Castings direct OK in last quarter of Project – 93.36%
Development at SUPPLIER
– Main Frame & Hub for all CUSTOMER WTG models, Total 4 models](https://image.slidesharecdn.com/01aacastingdpr-selforupload-130731115902-phpapp02/75/Casting-manufacturing-process-improvement-15-2048.jpg)
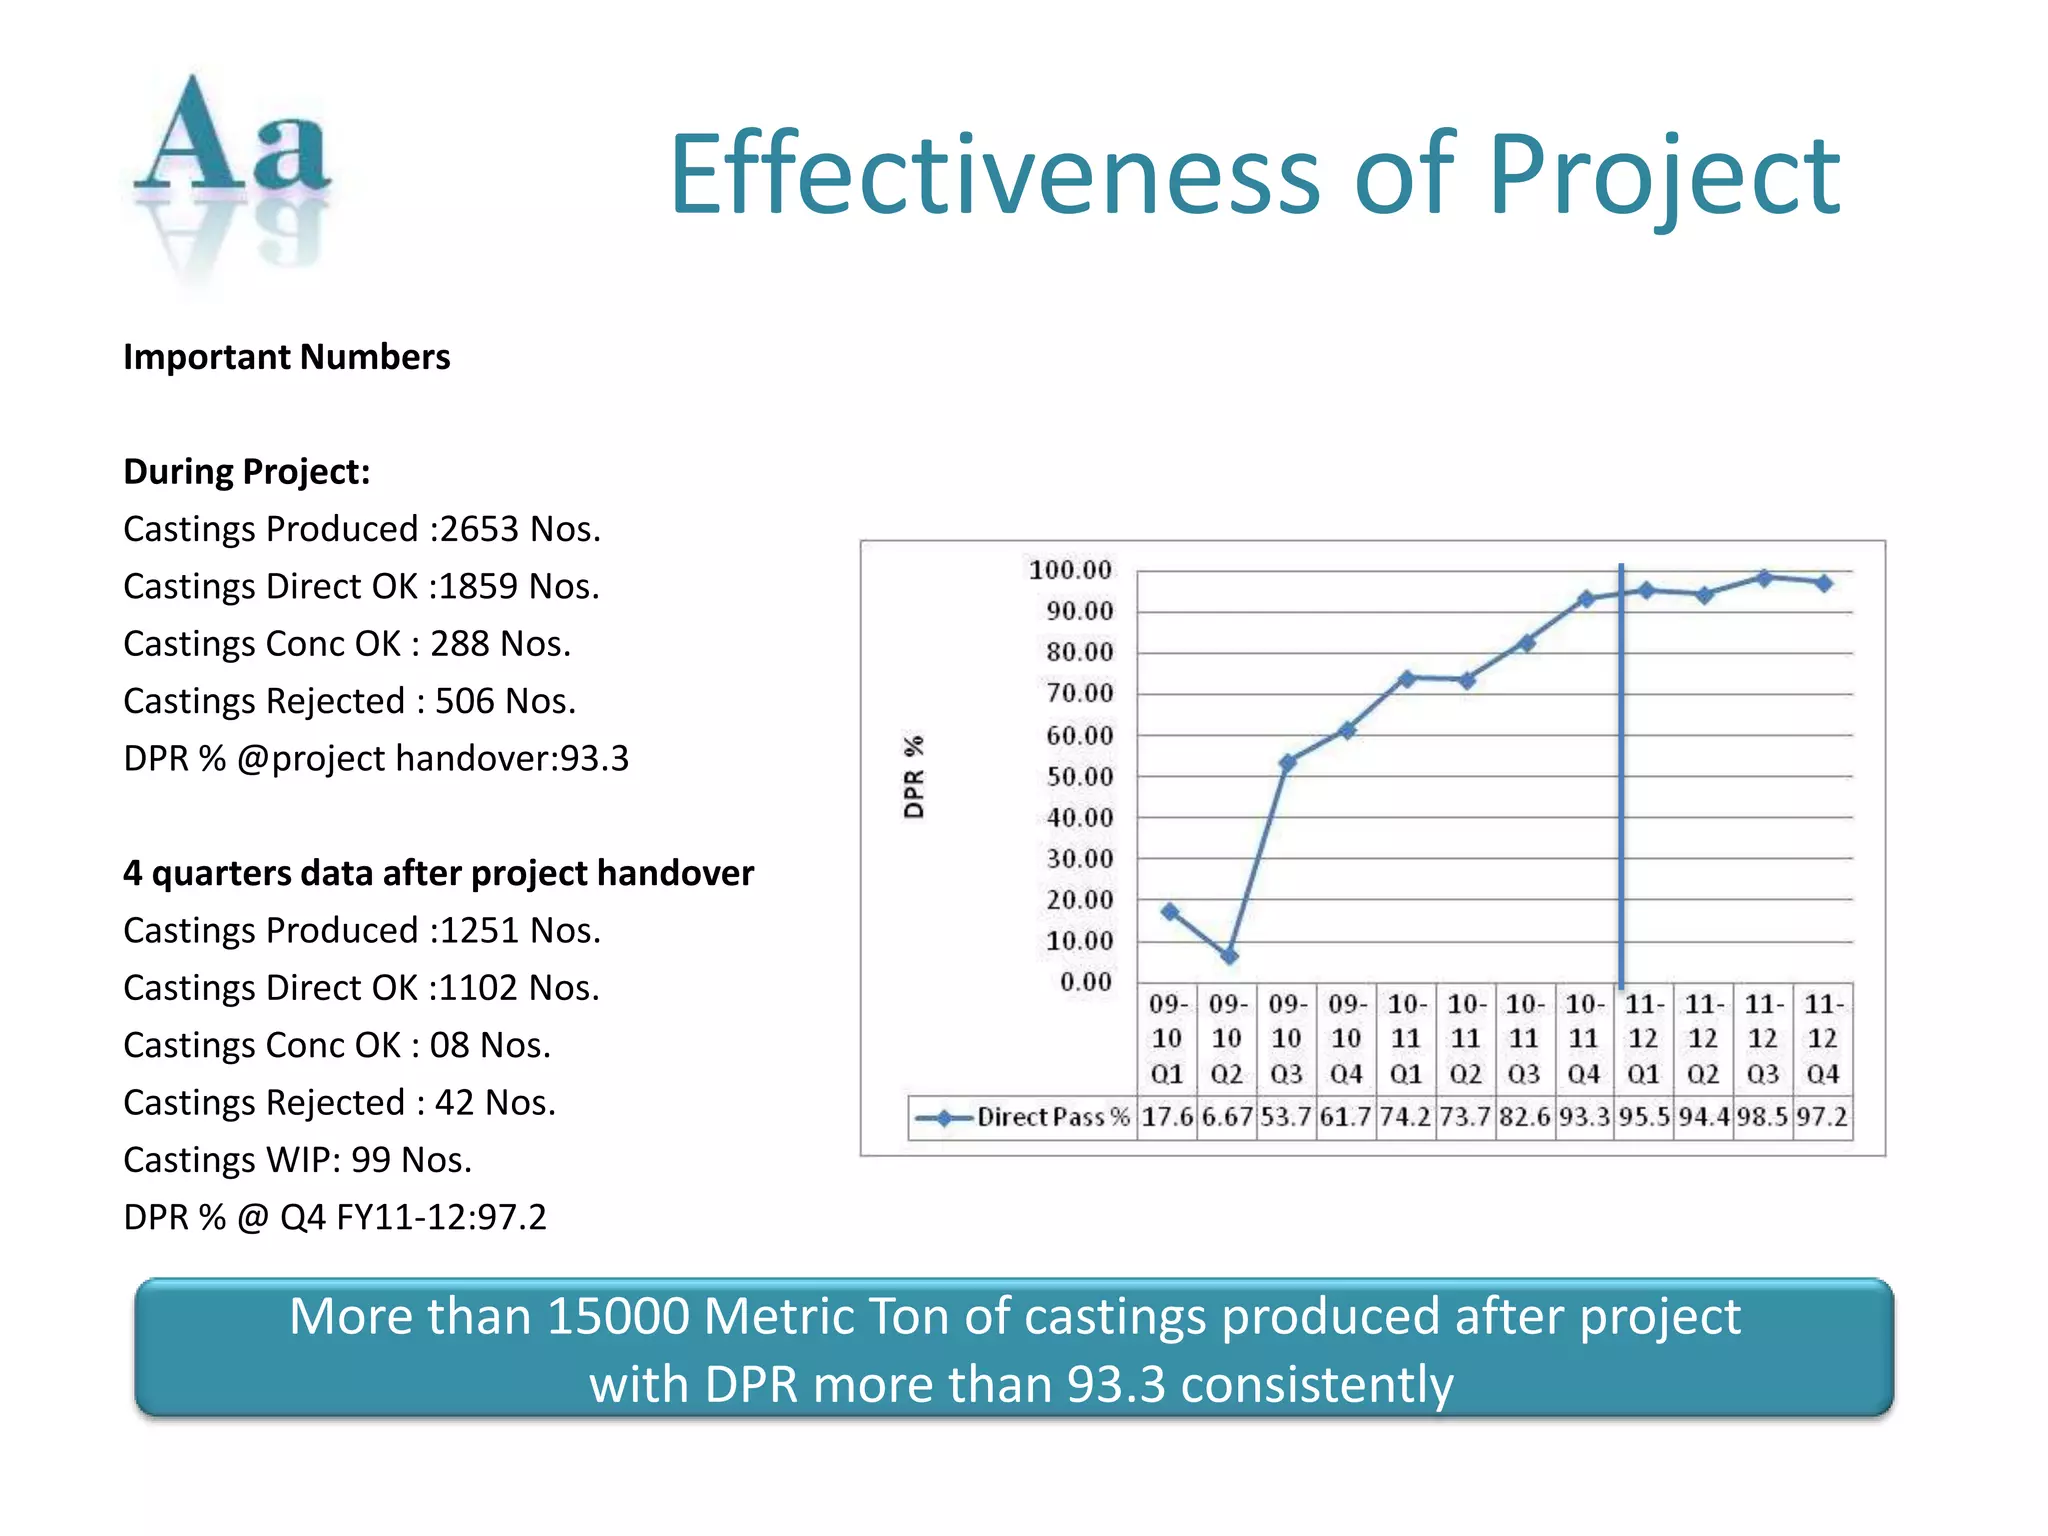

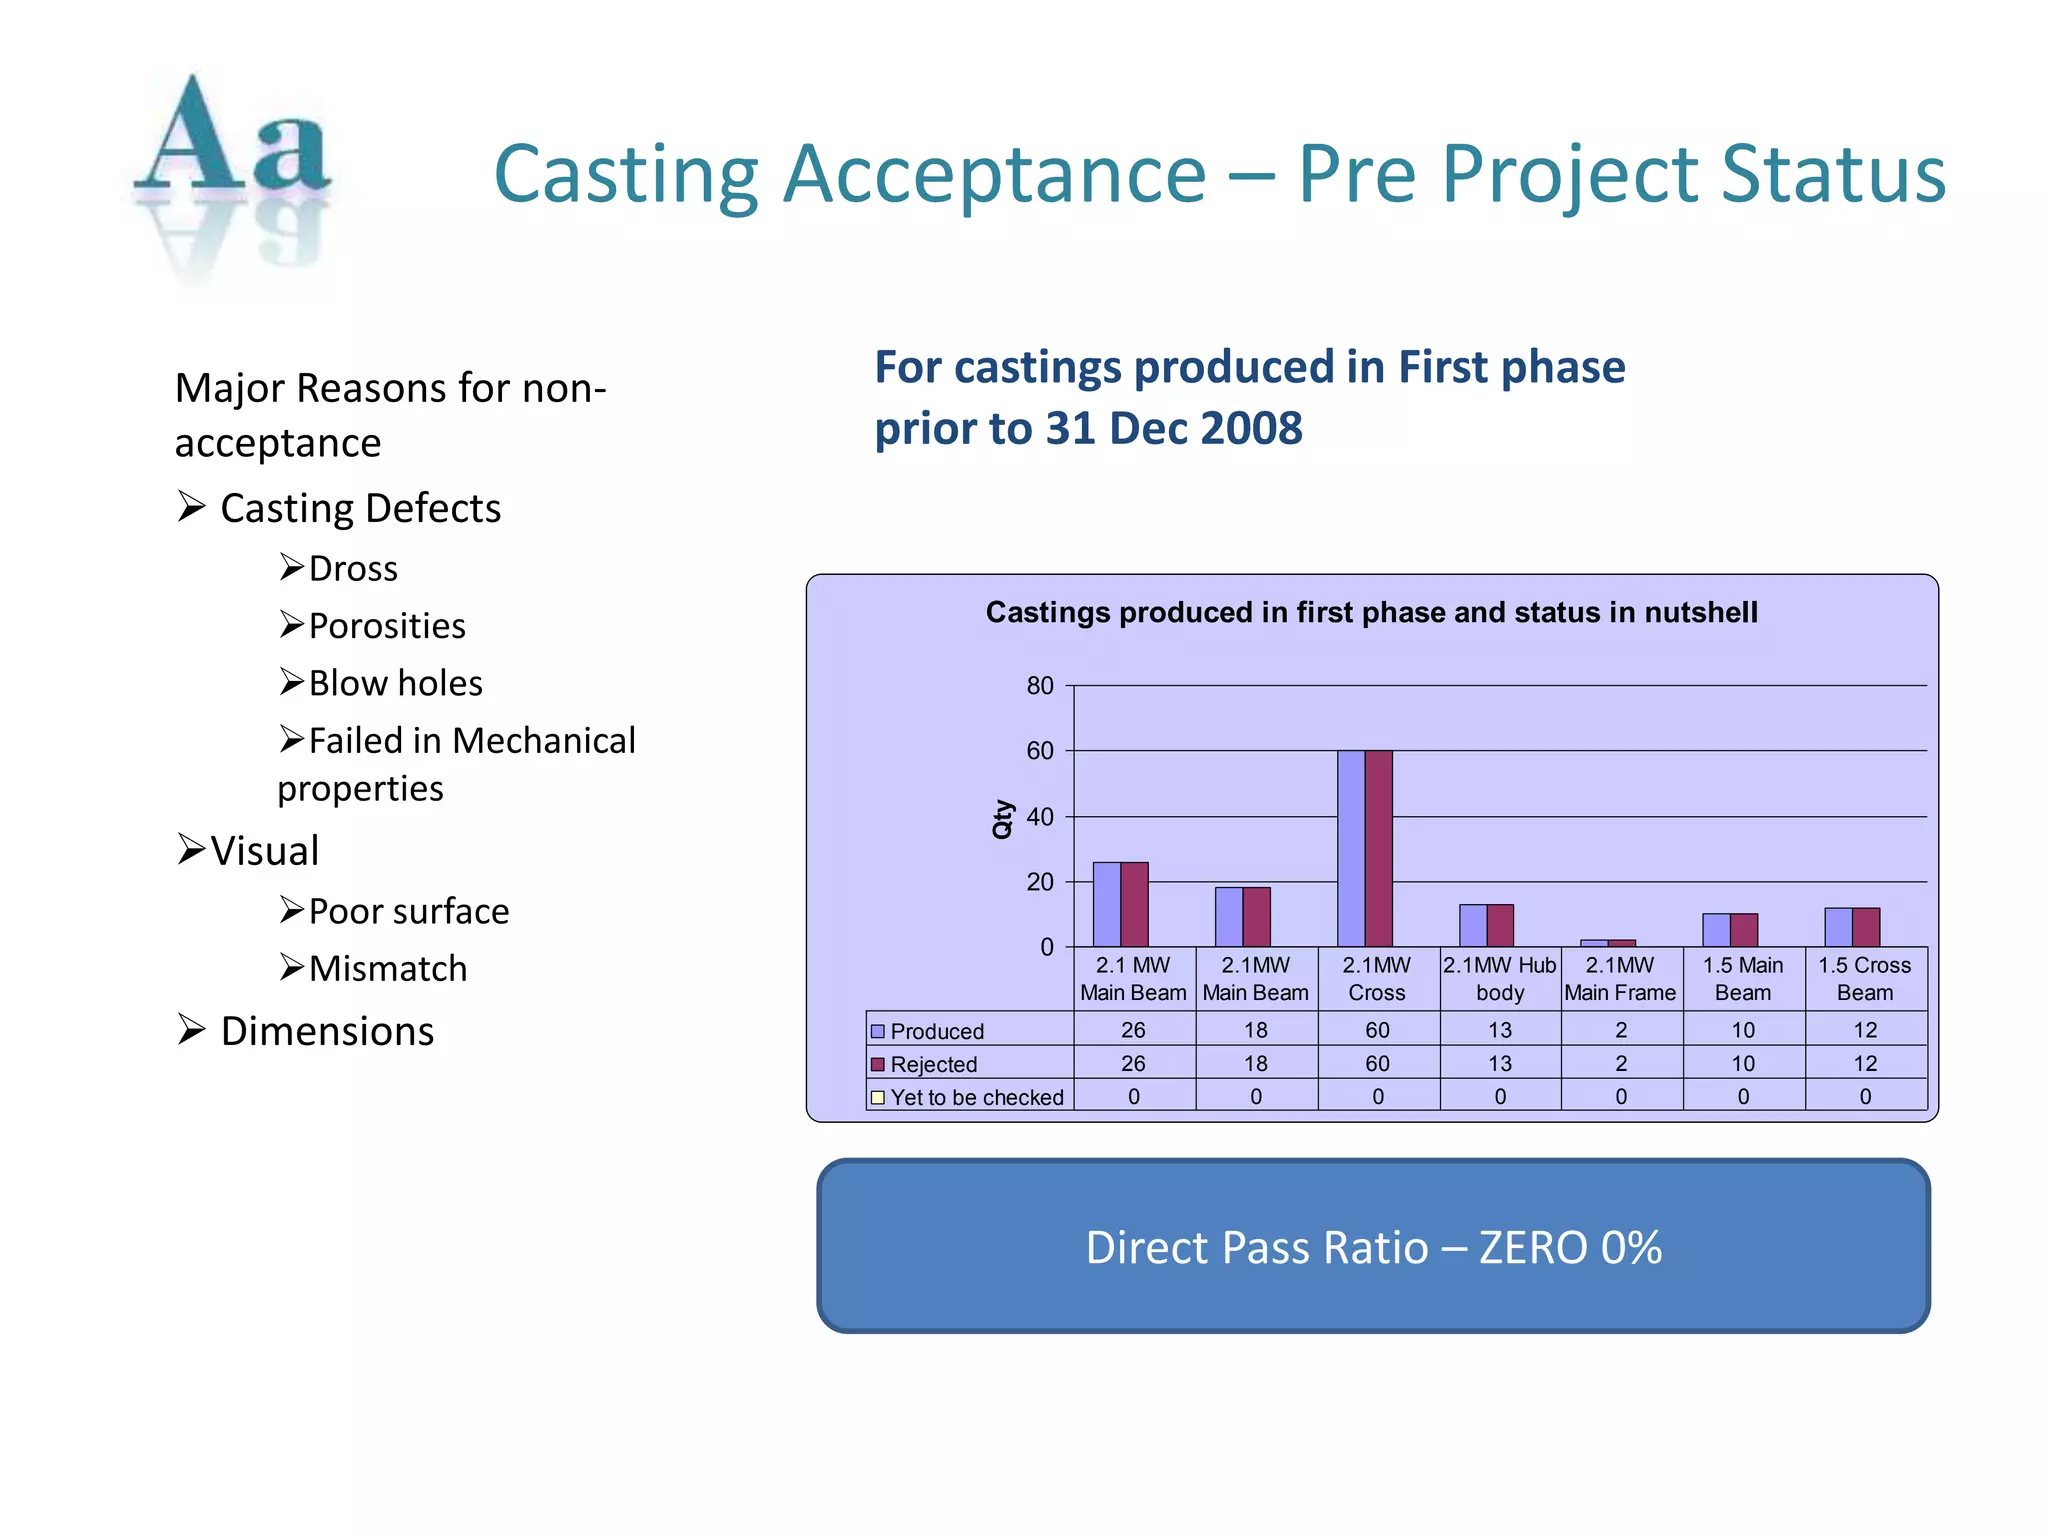
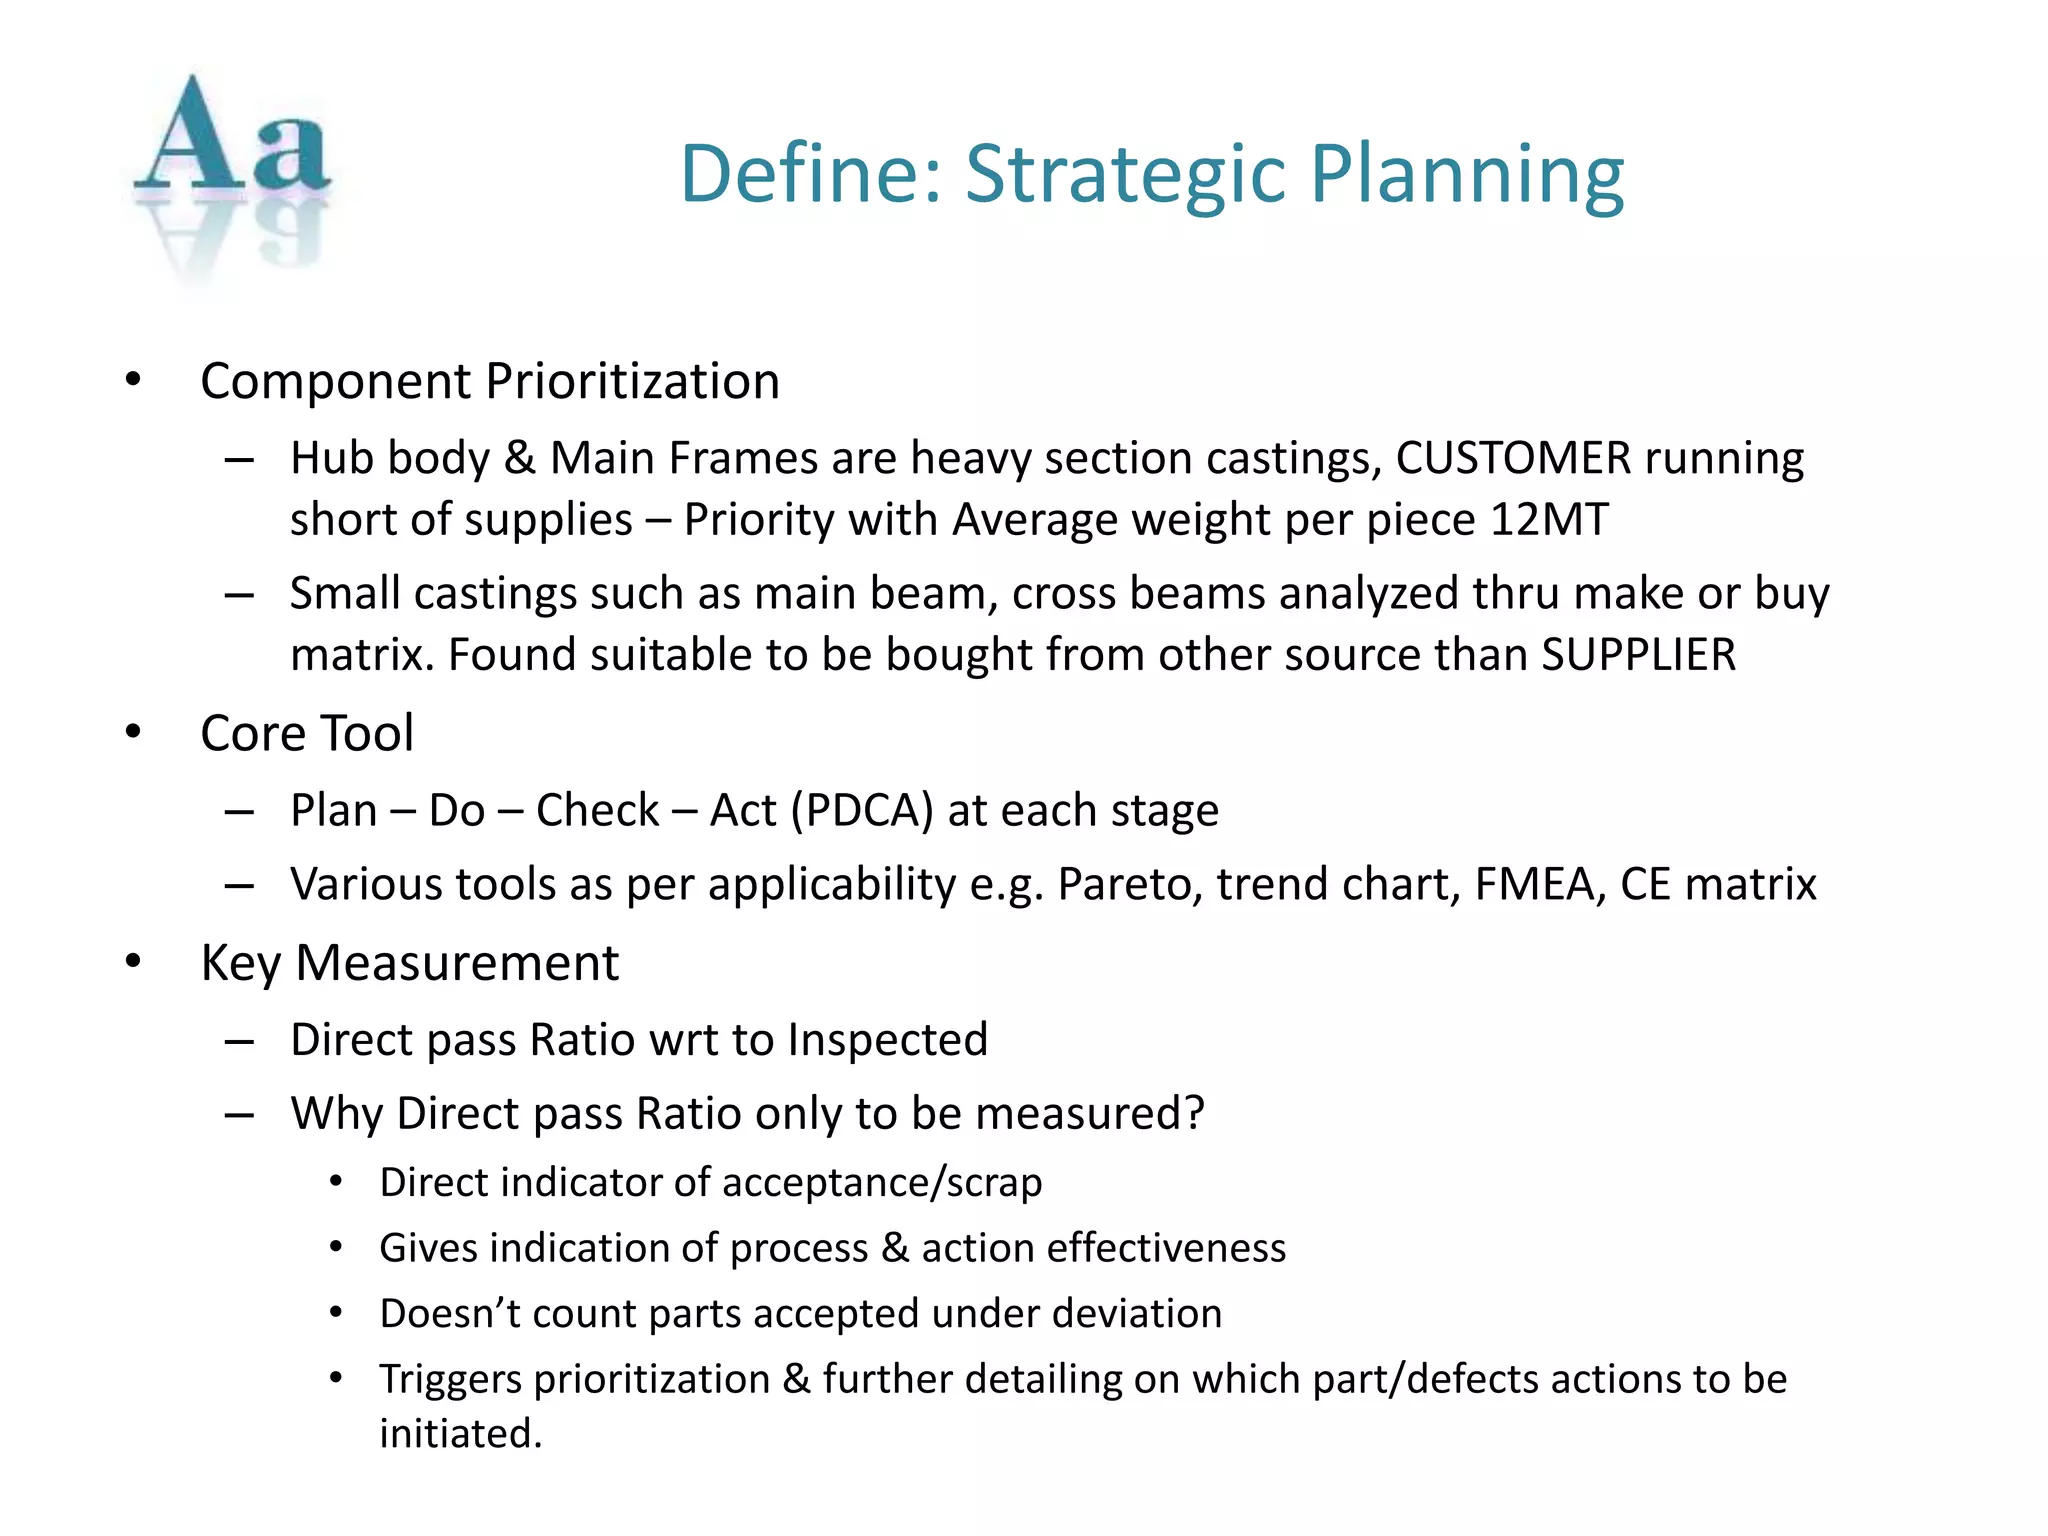
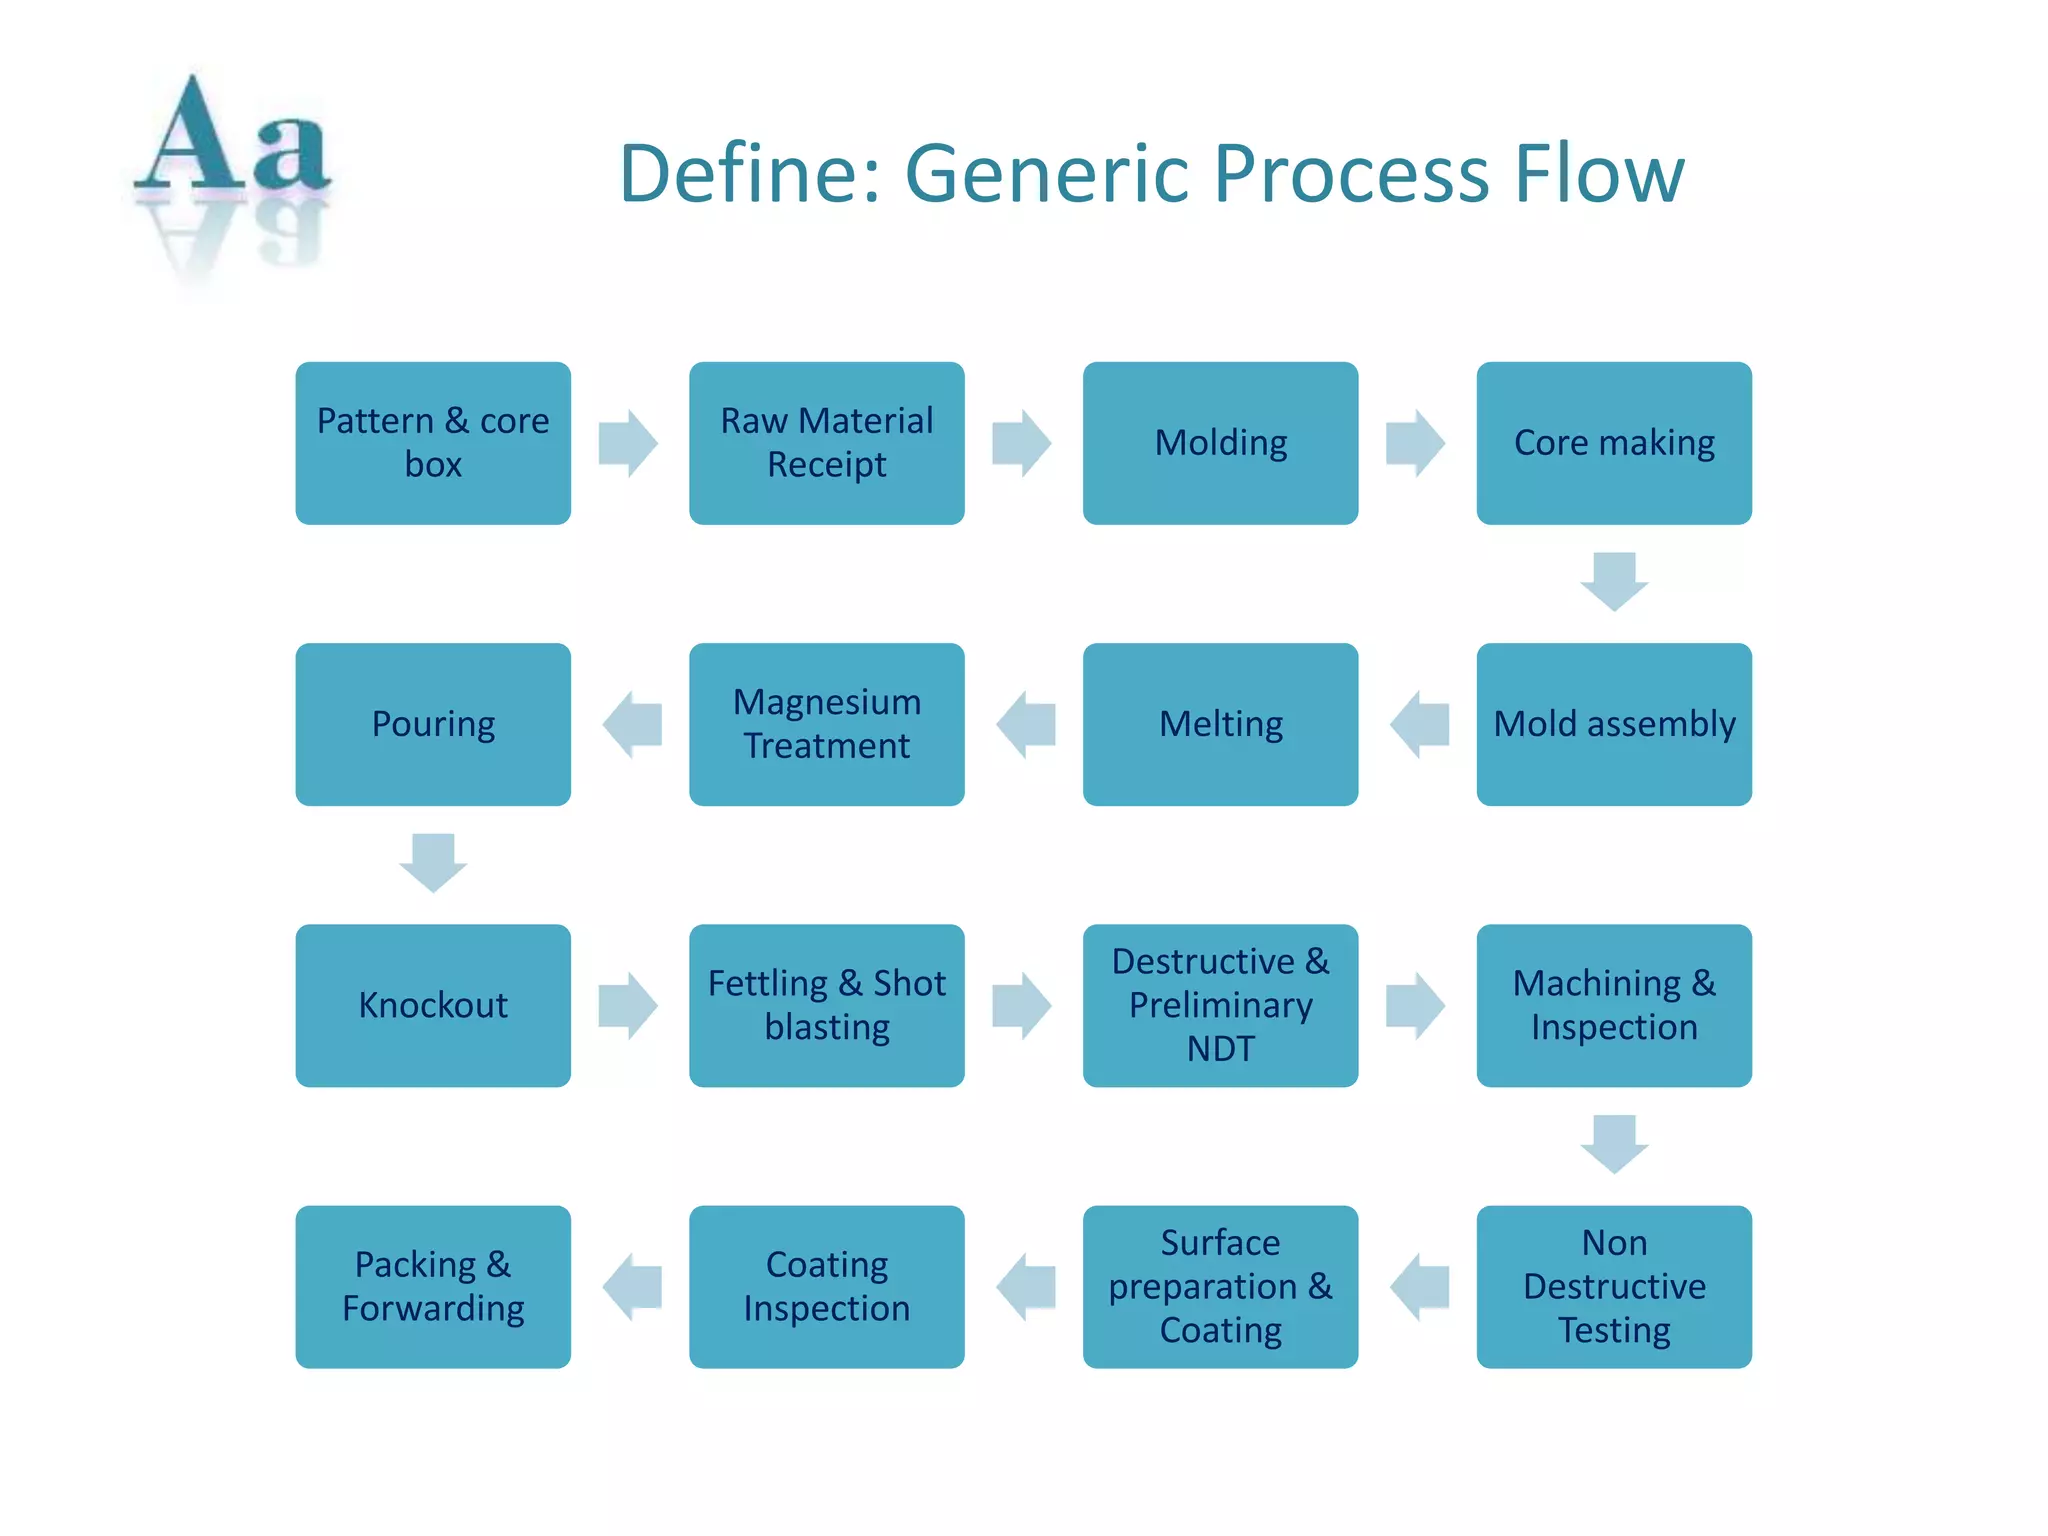
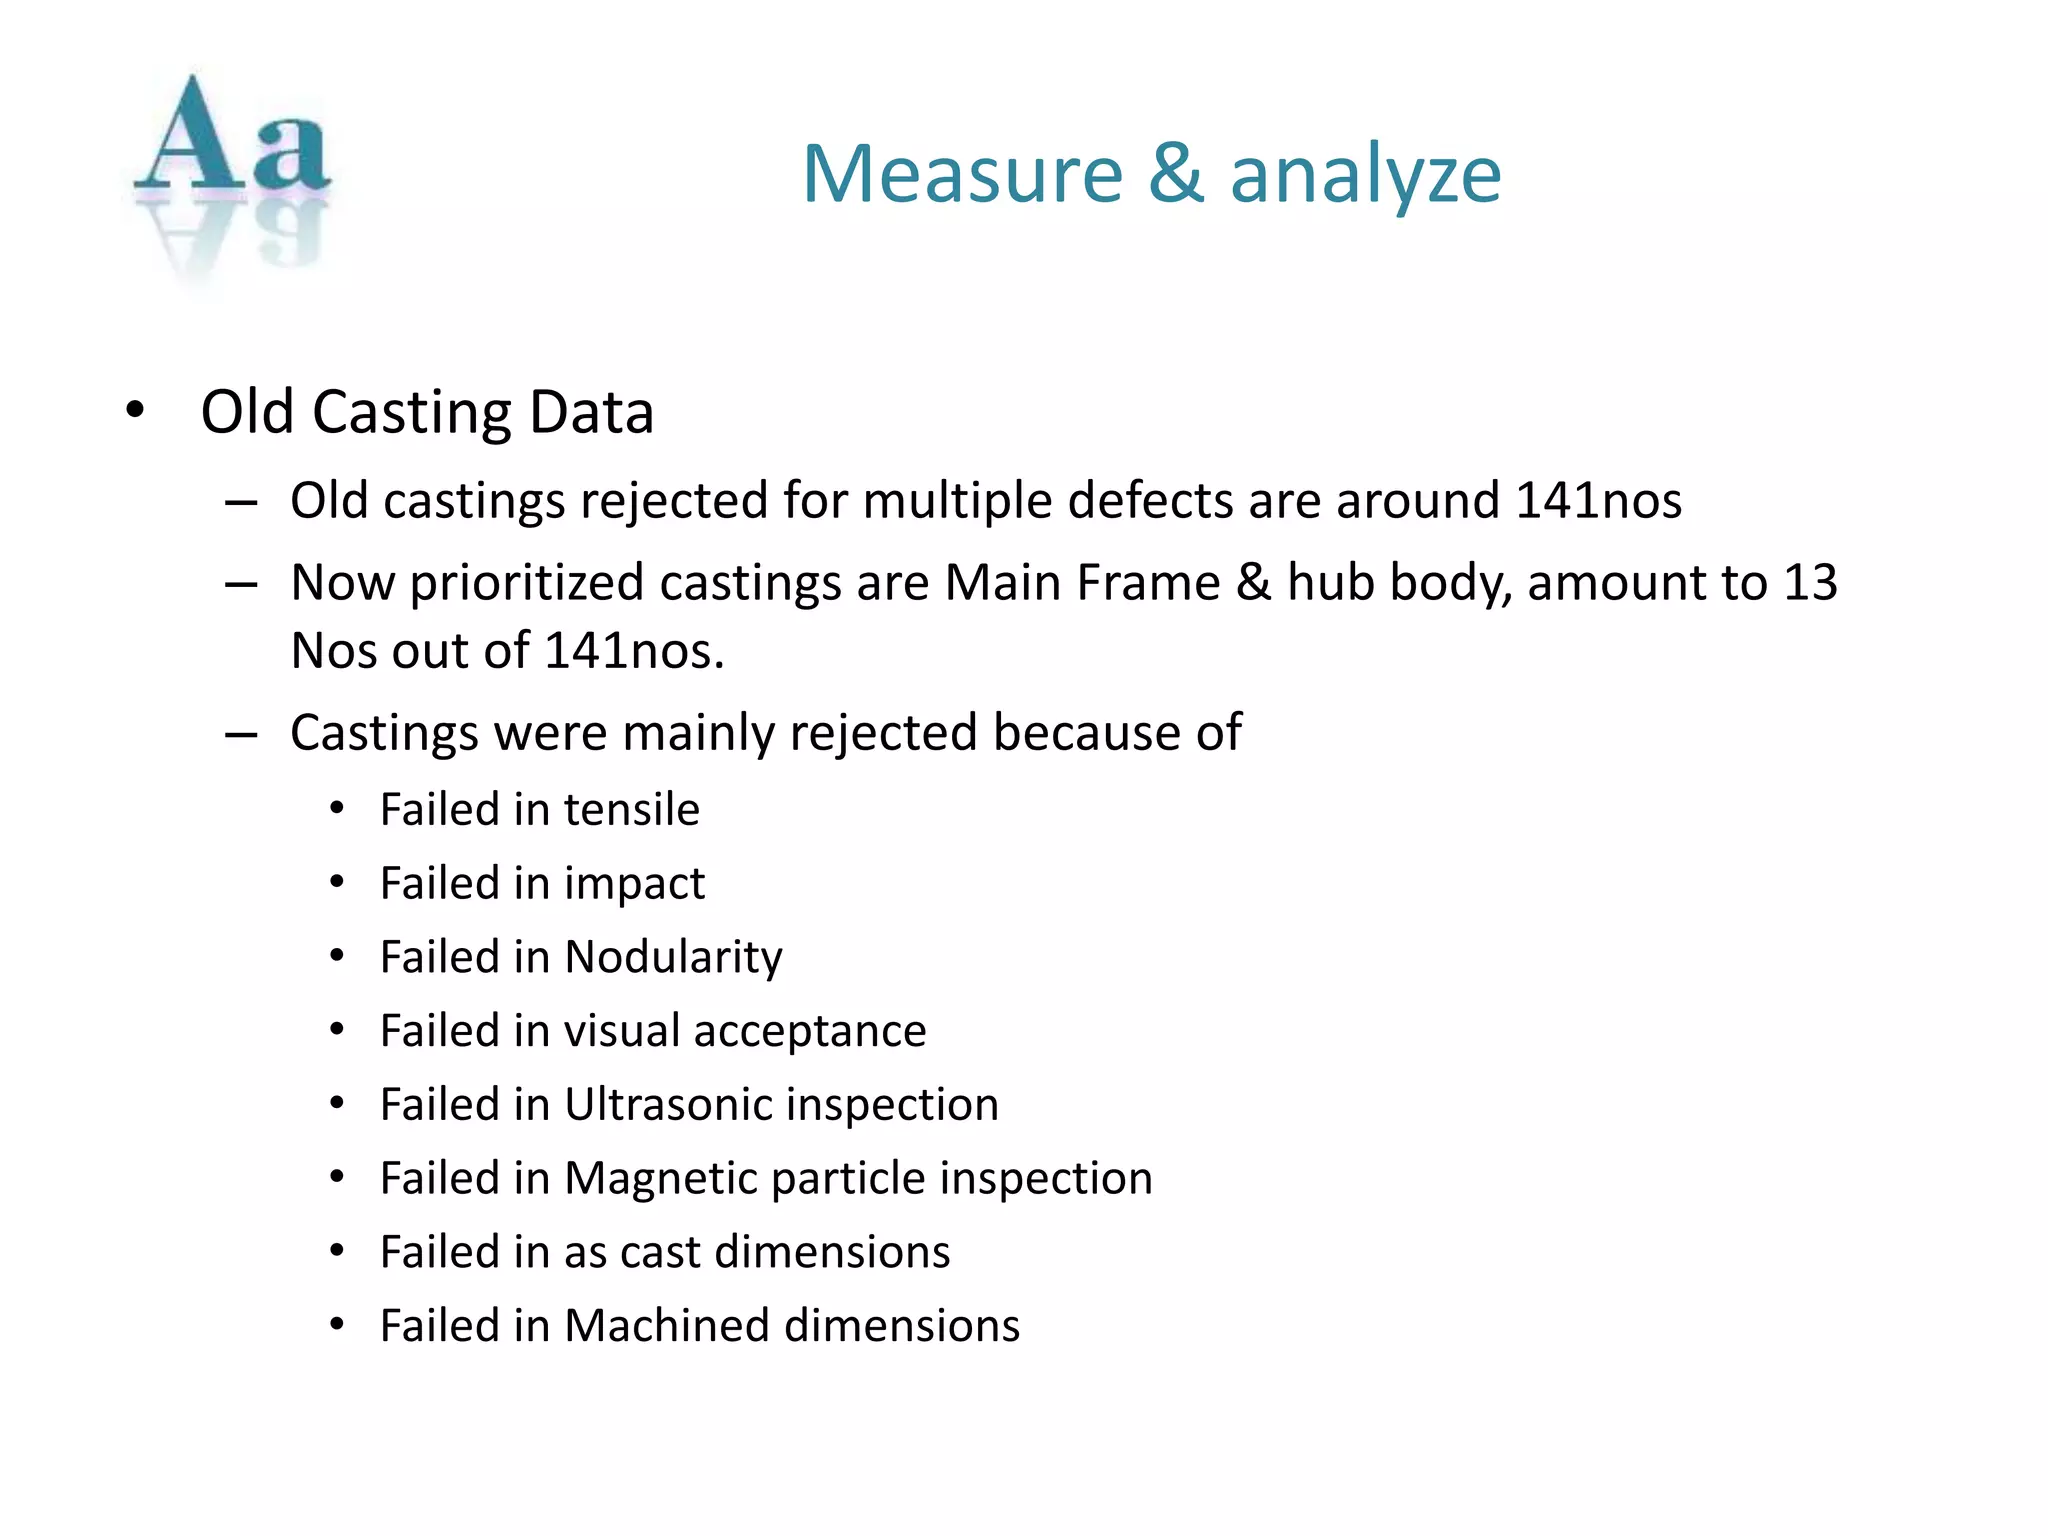
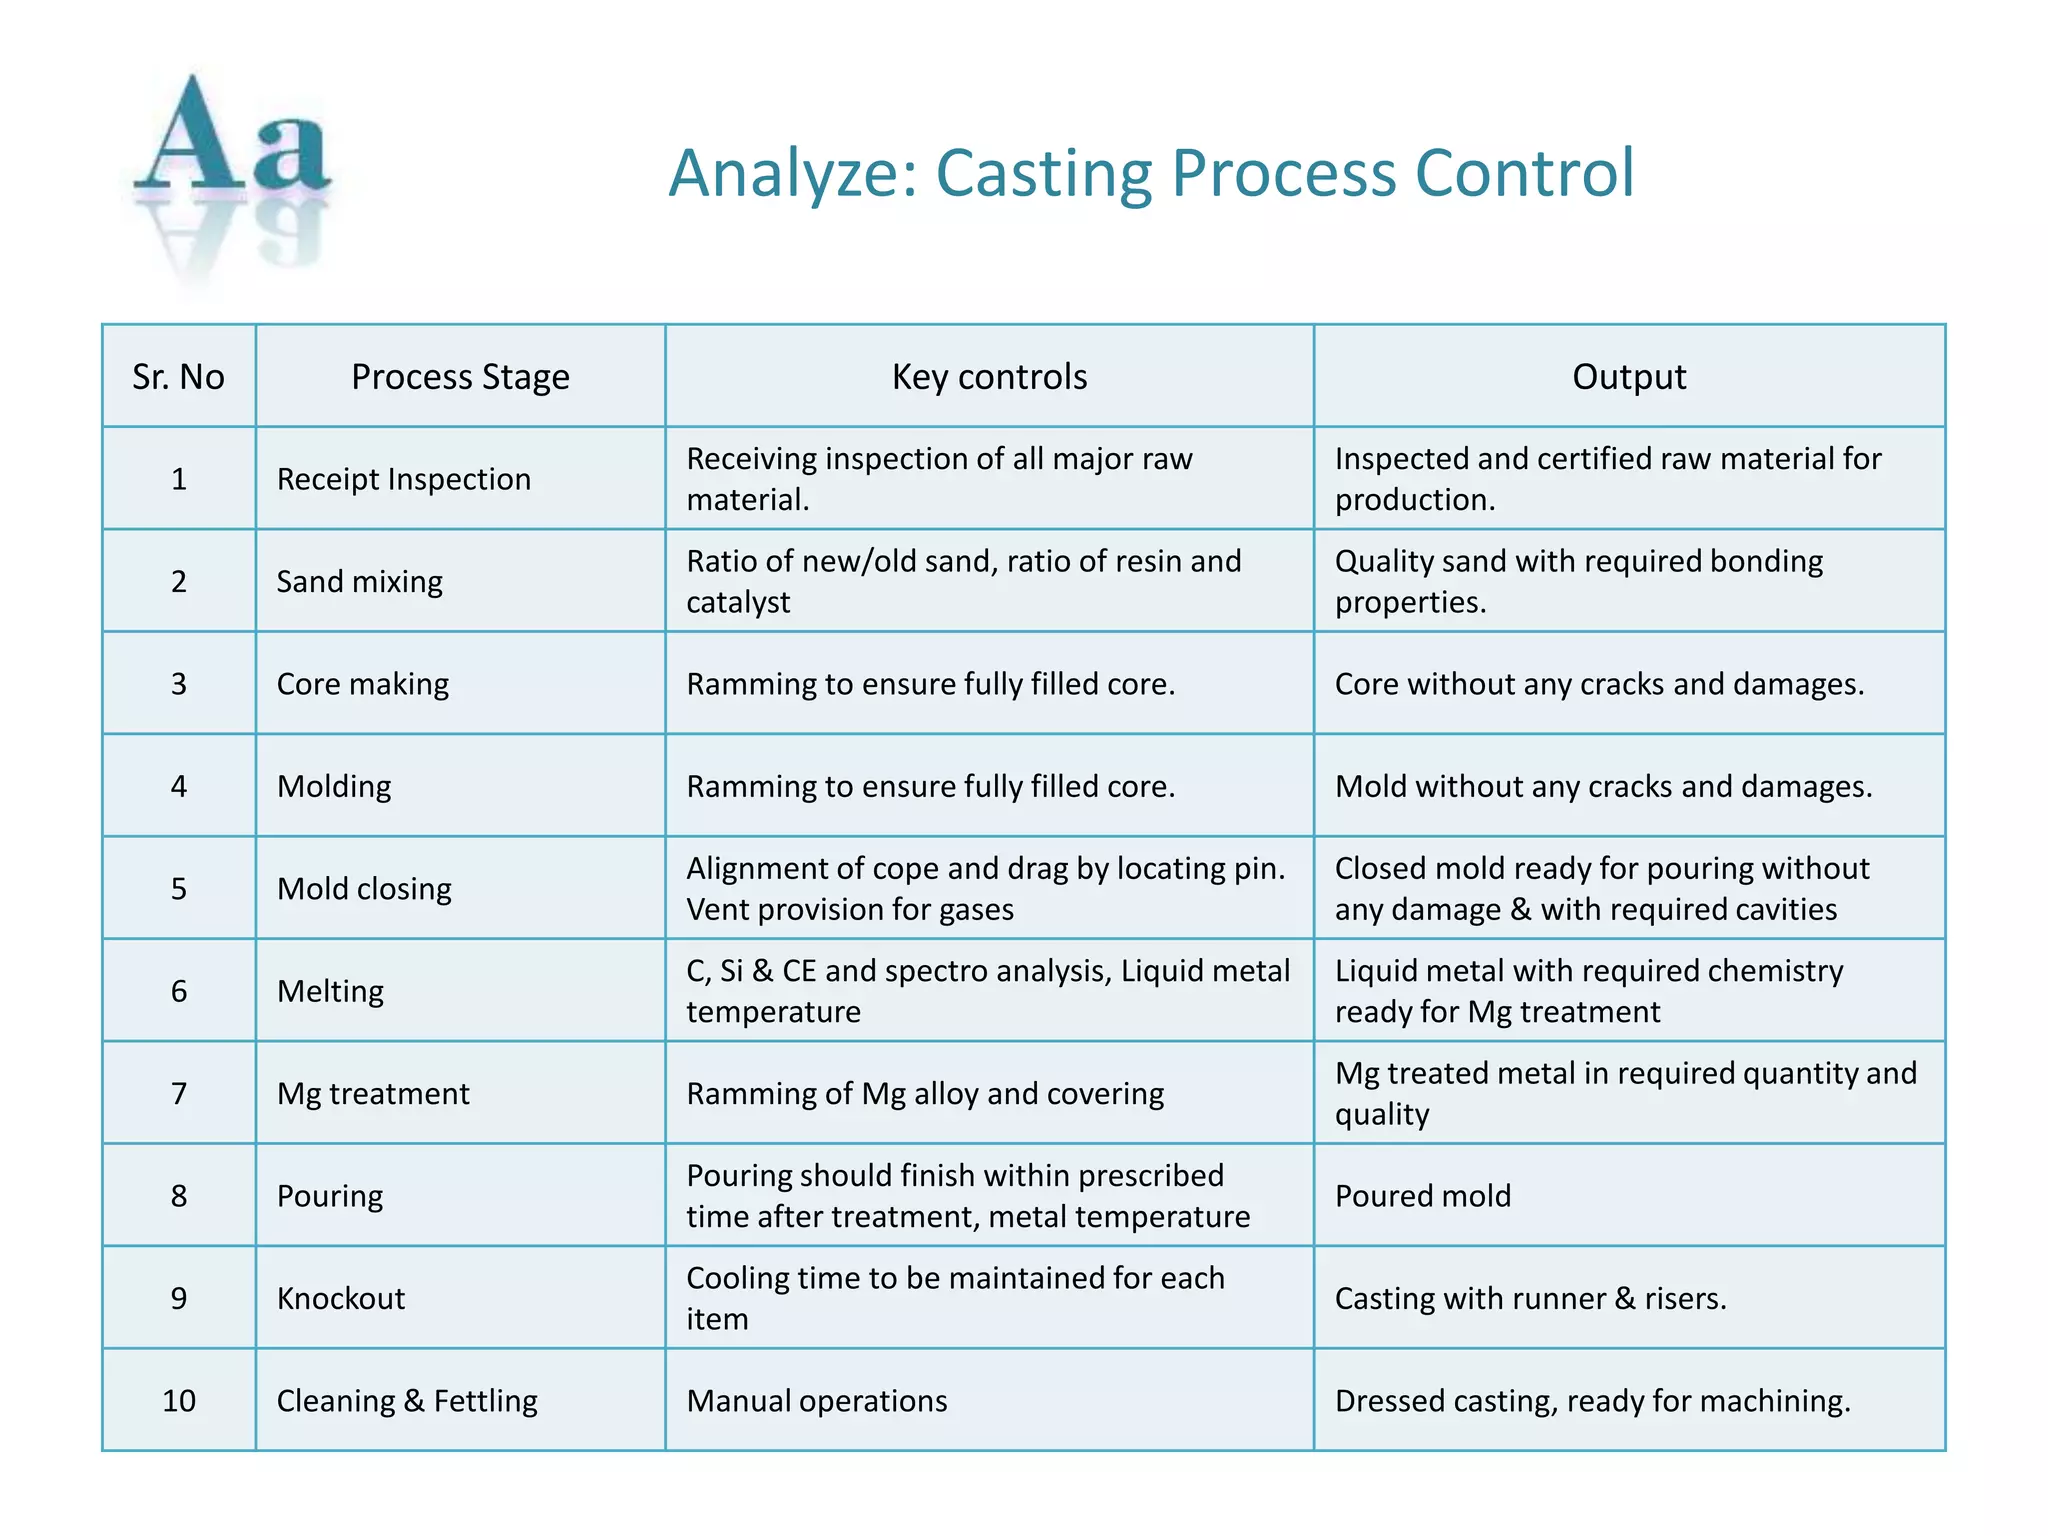
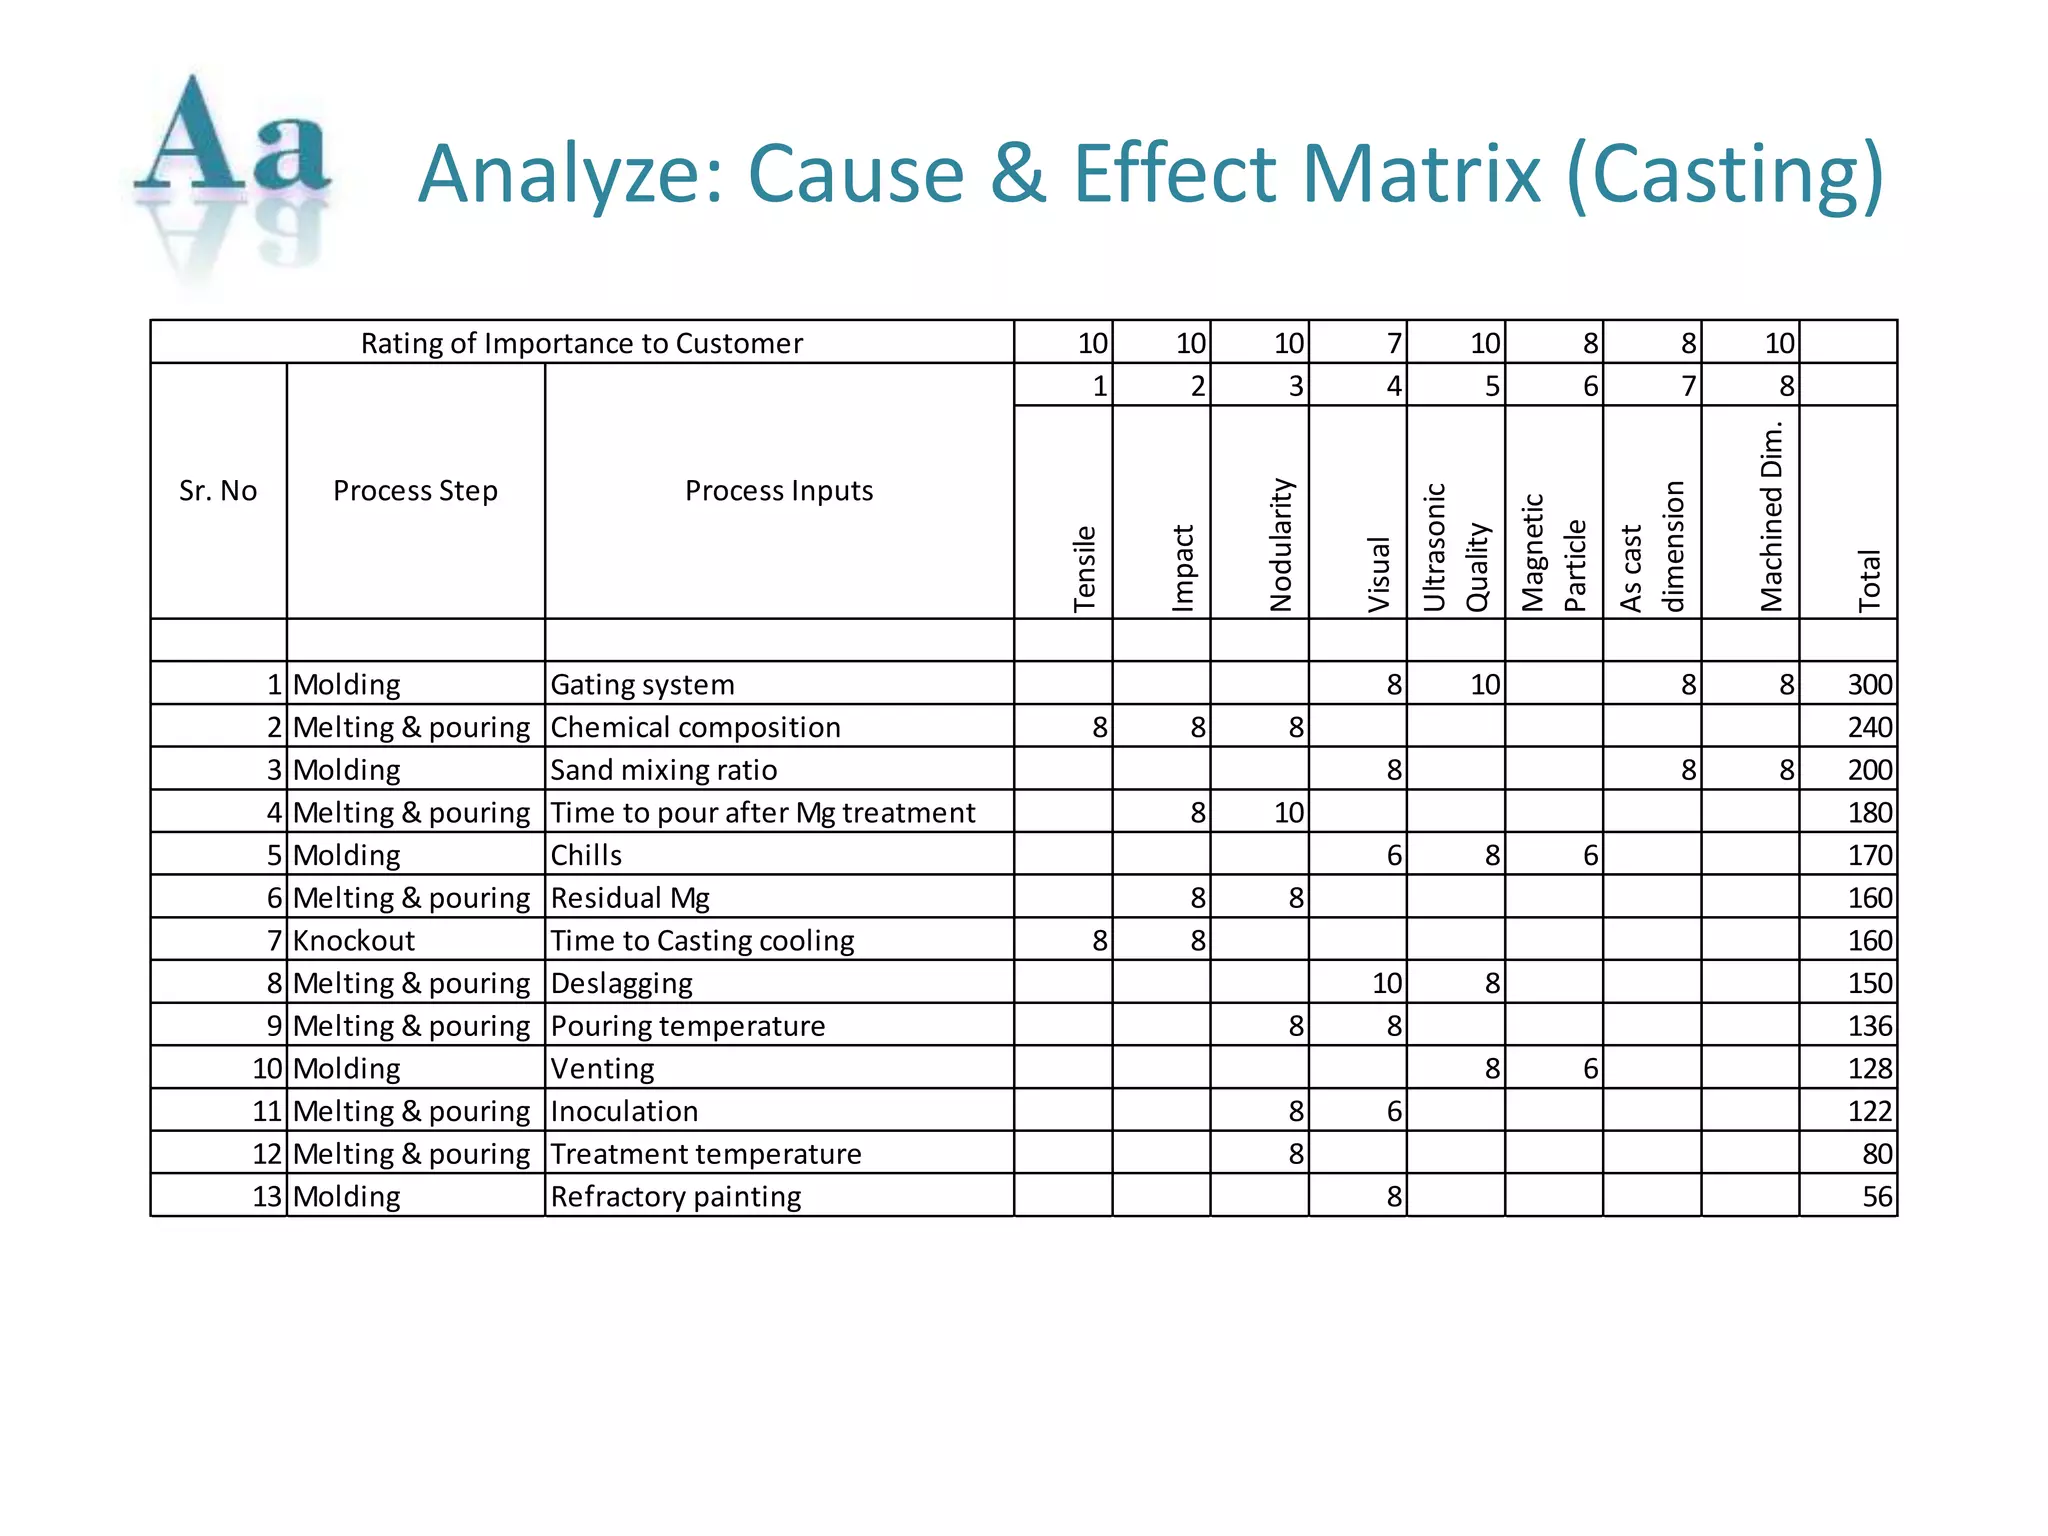
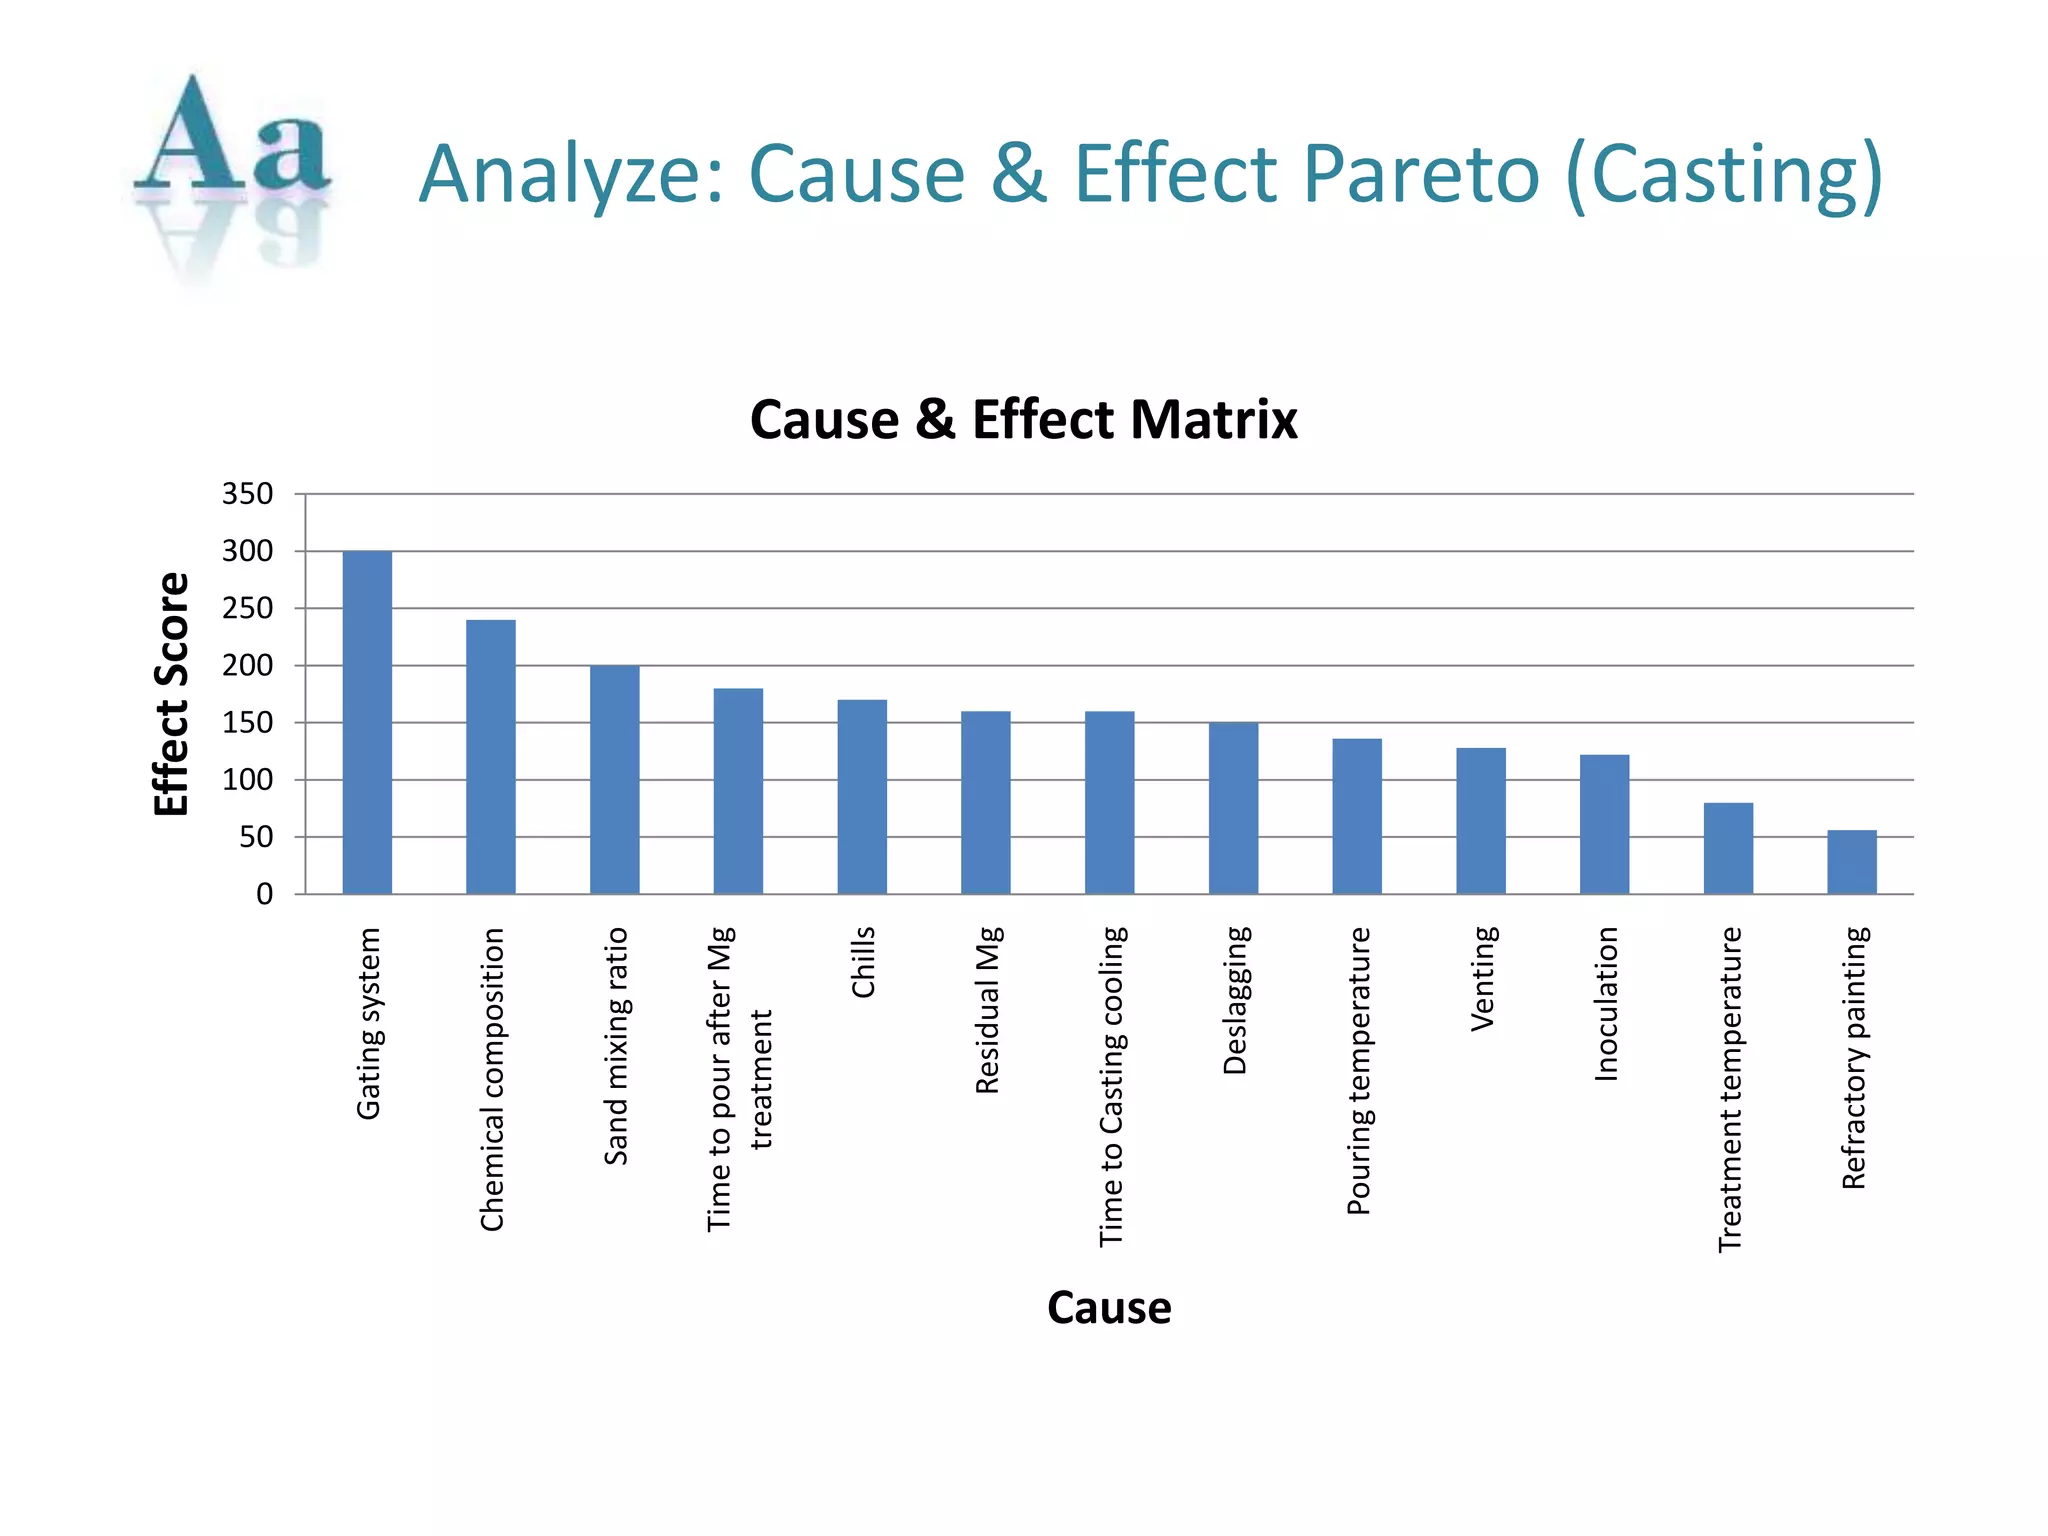
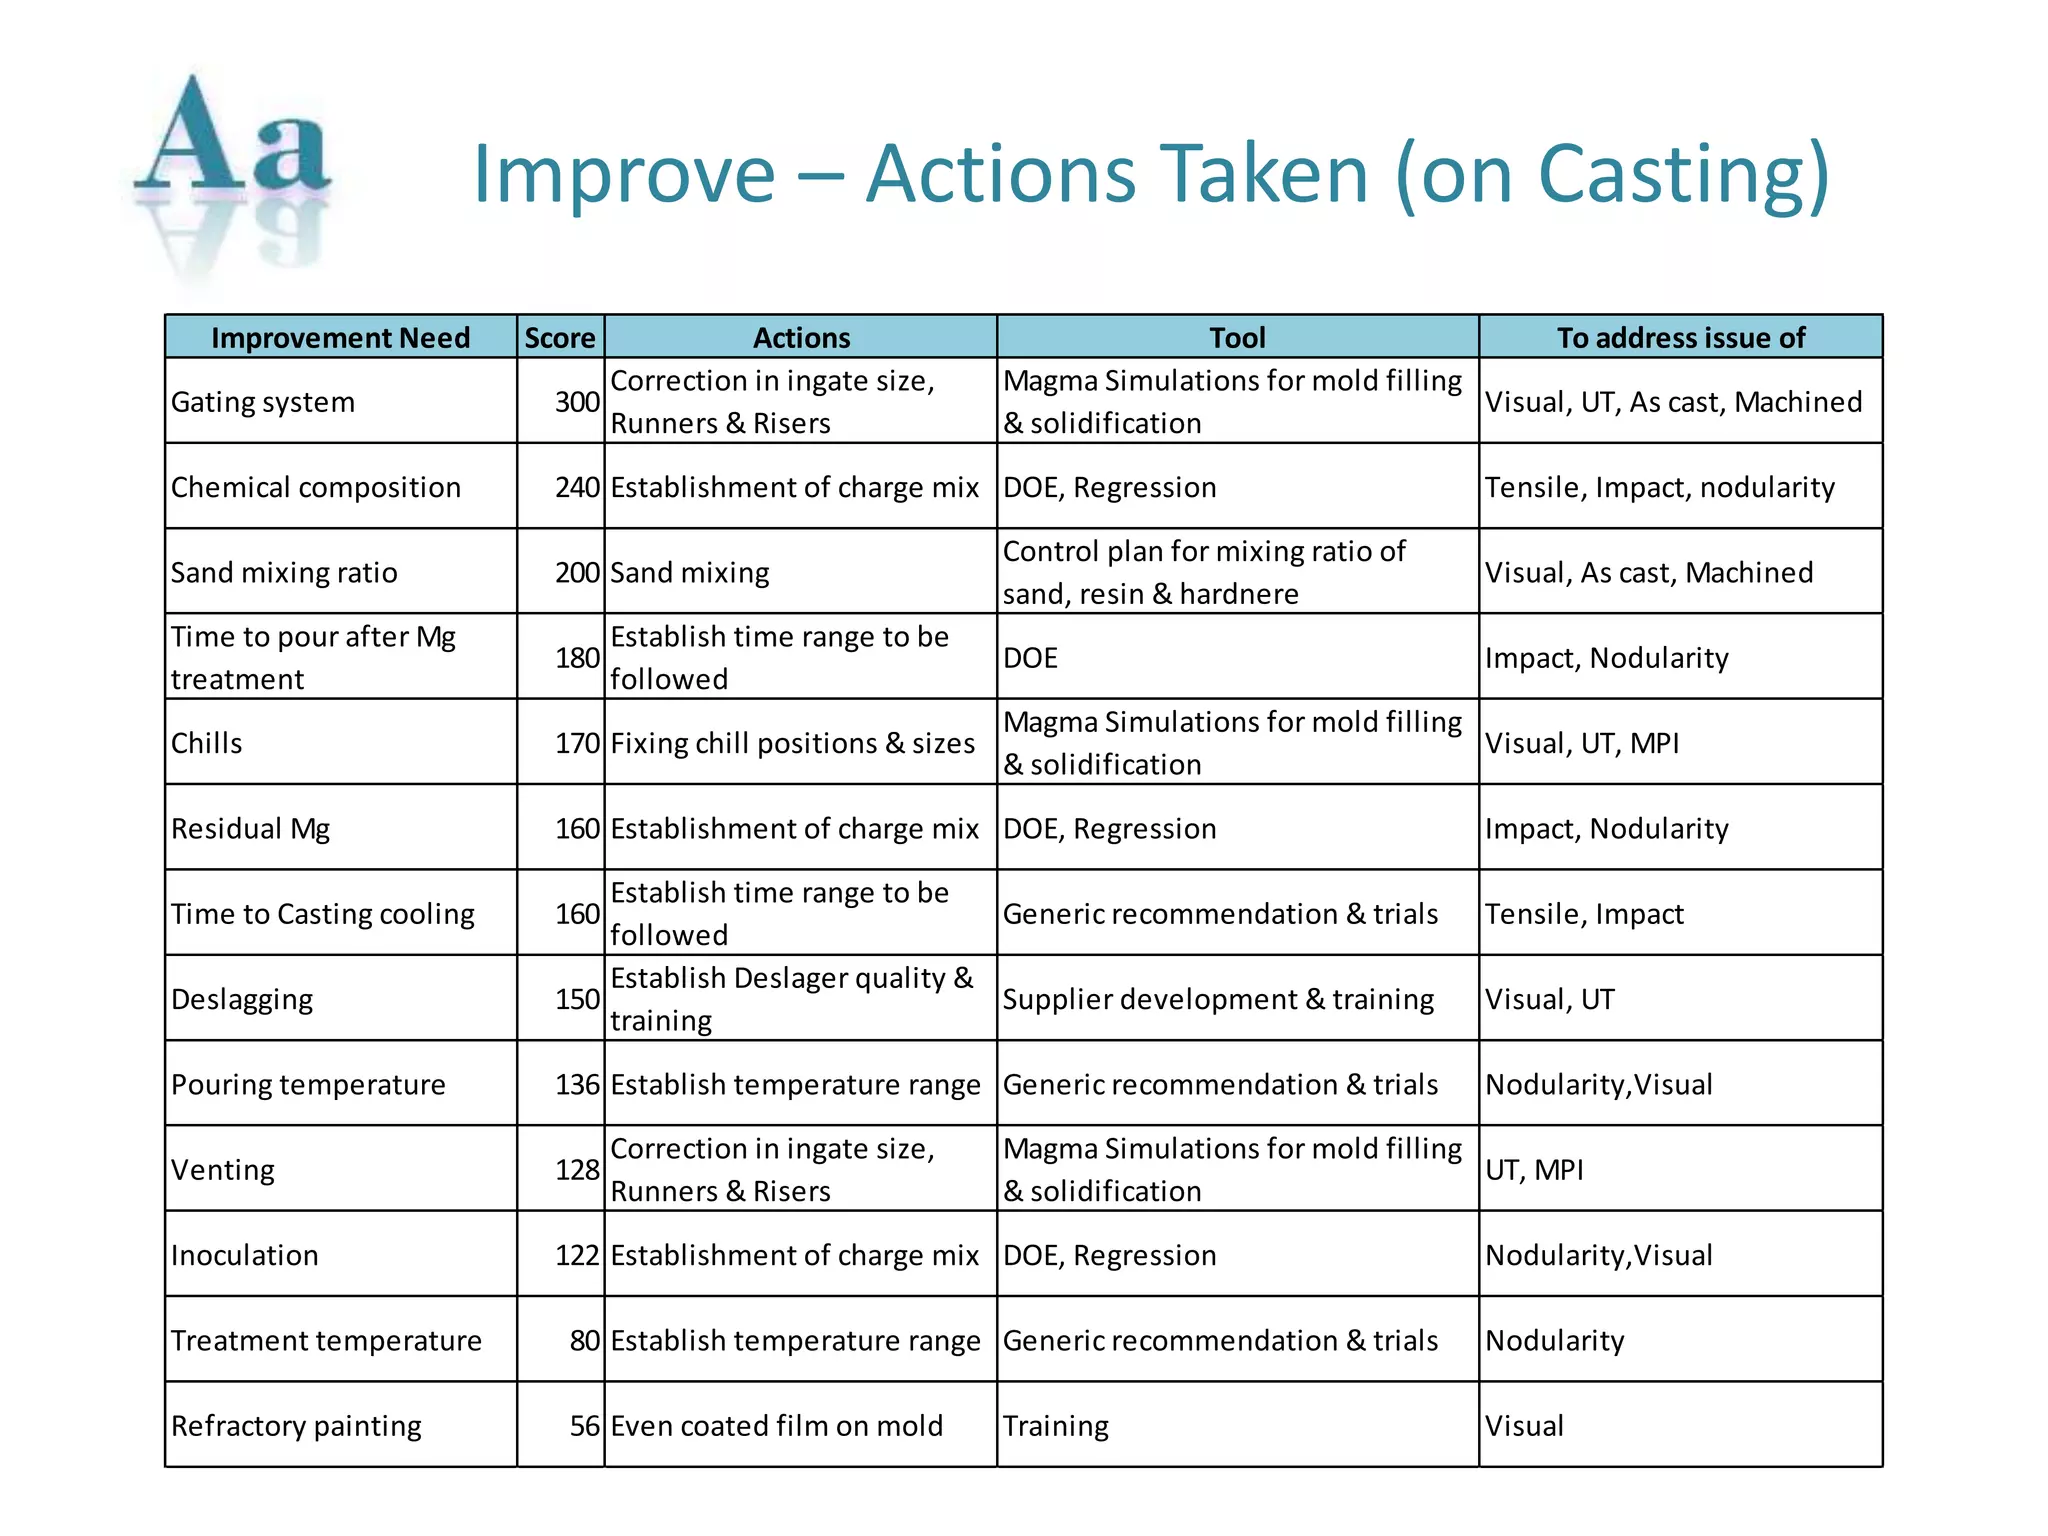
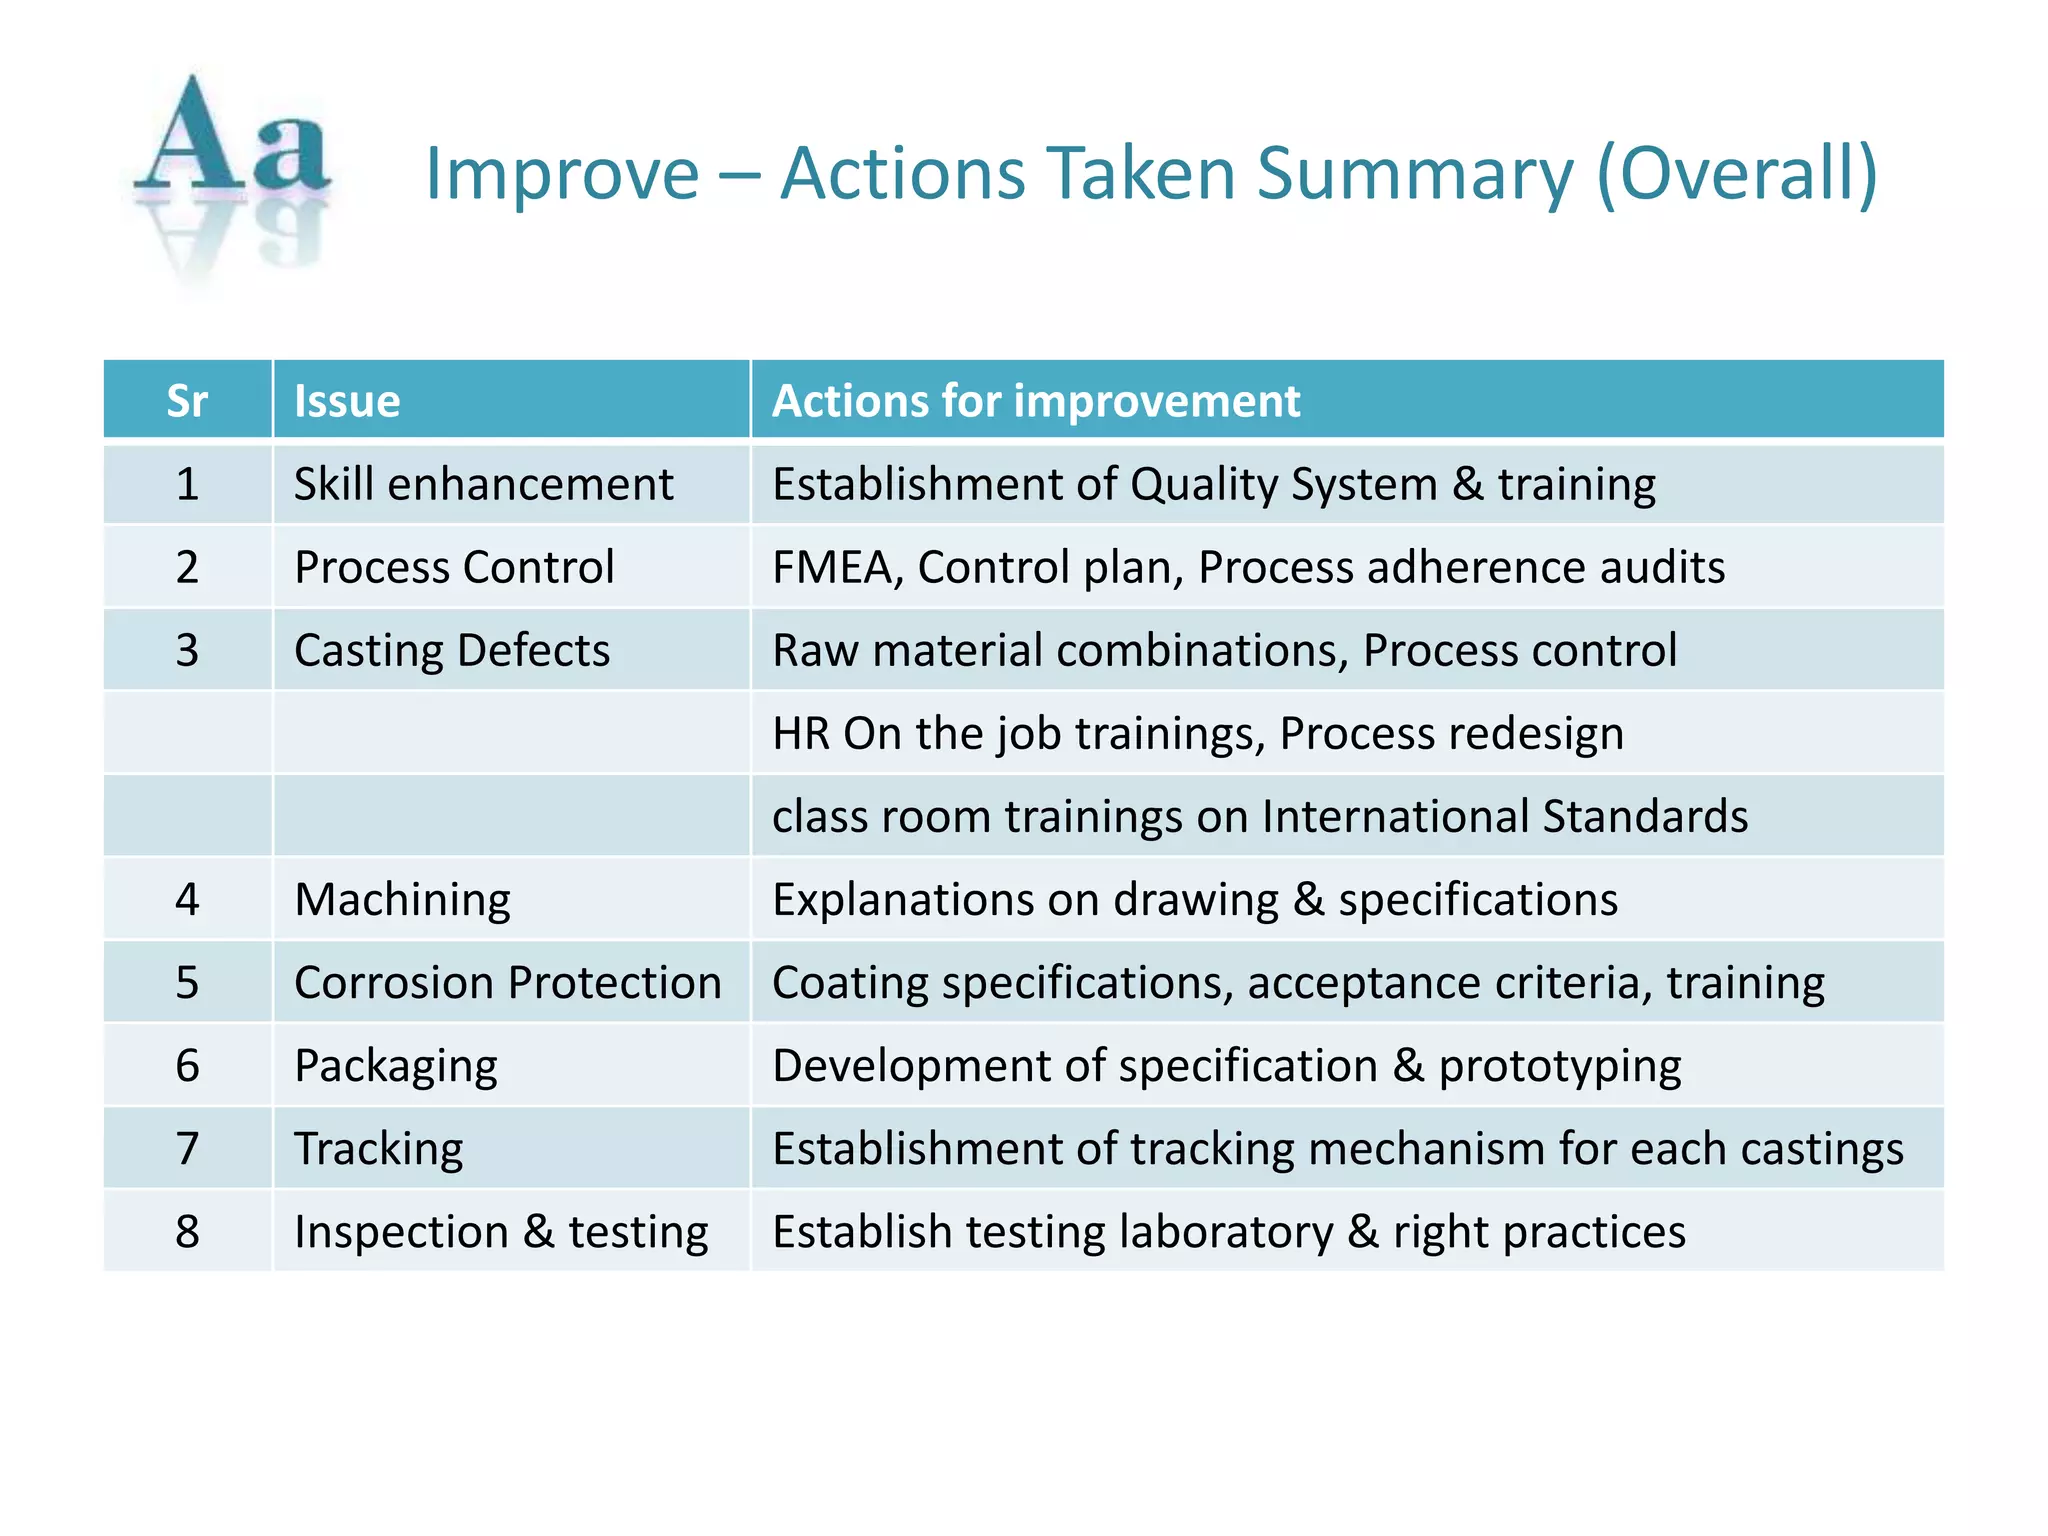
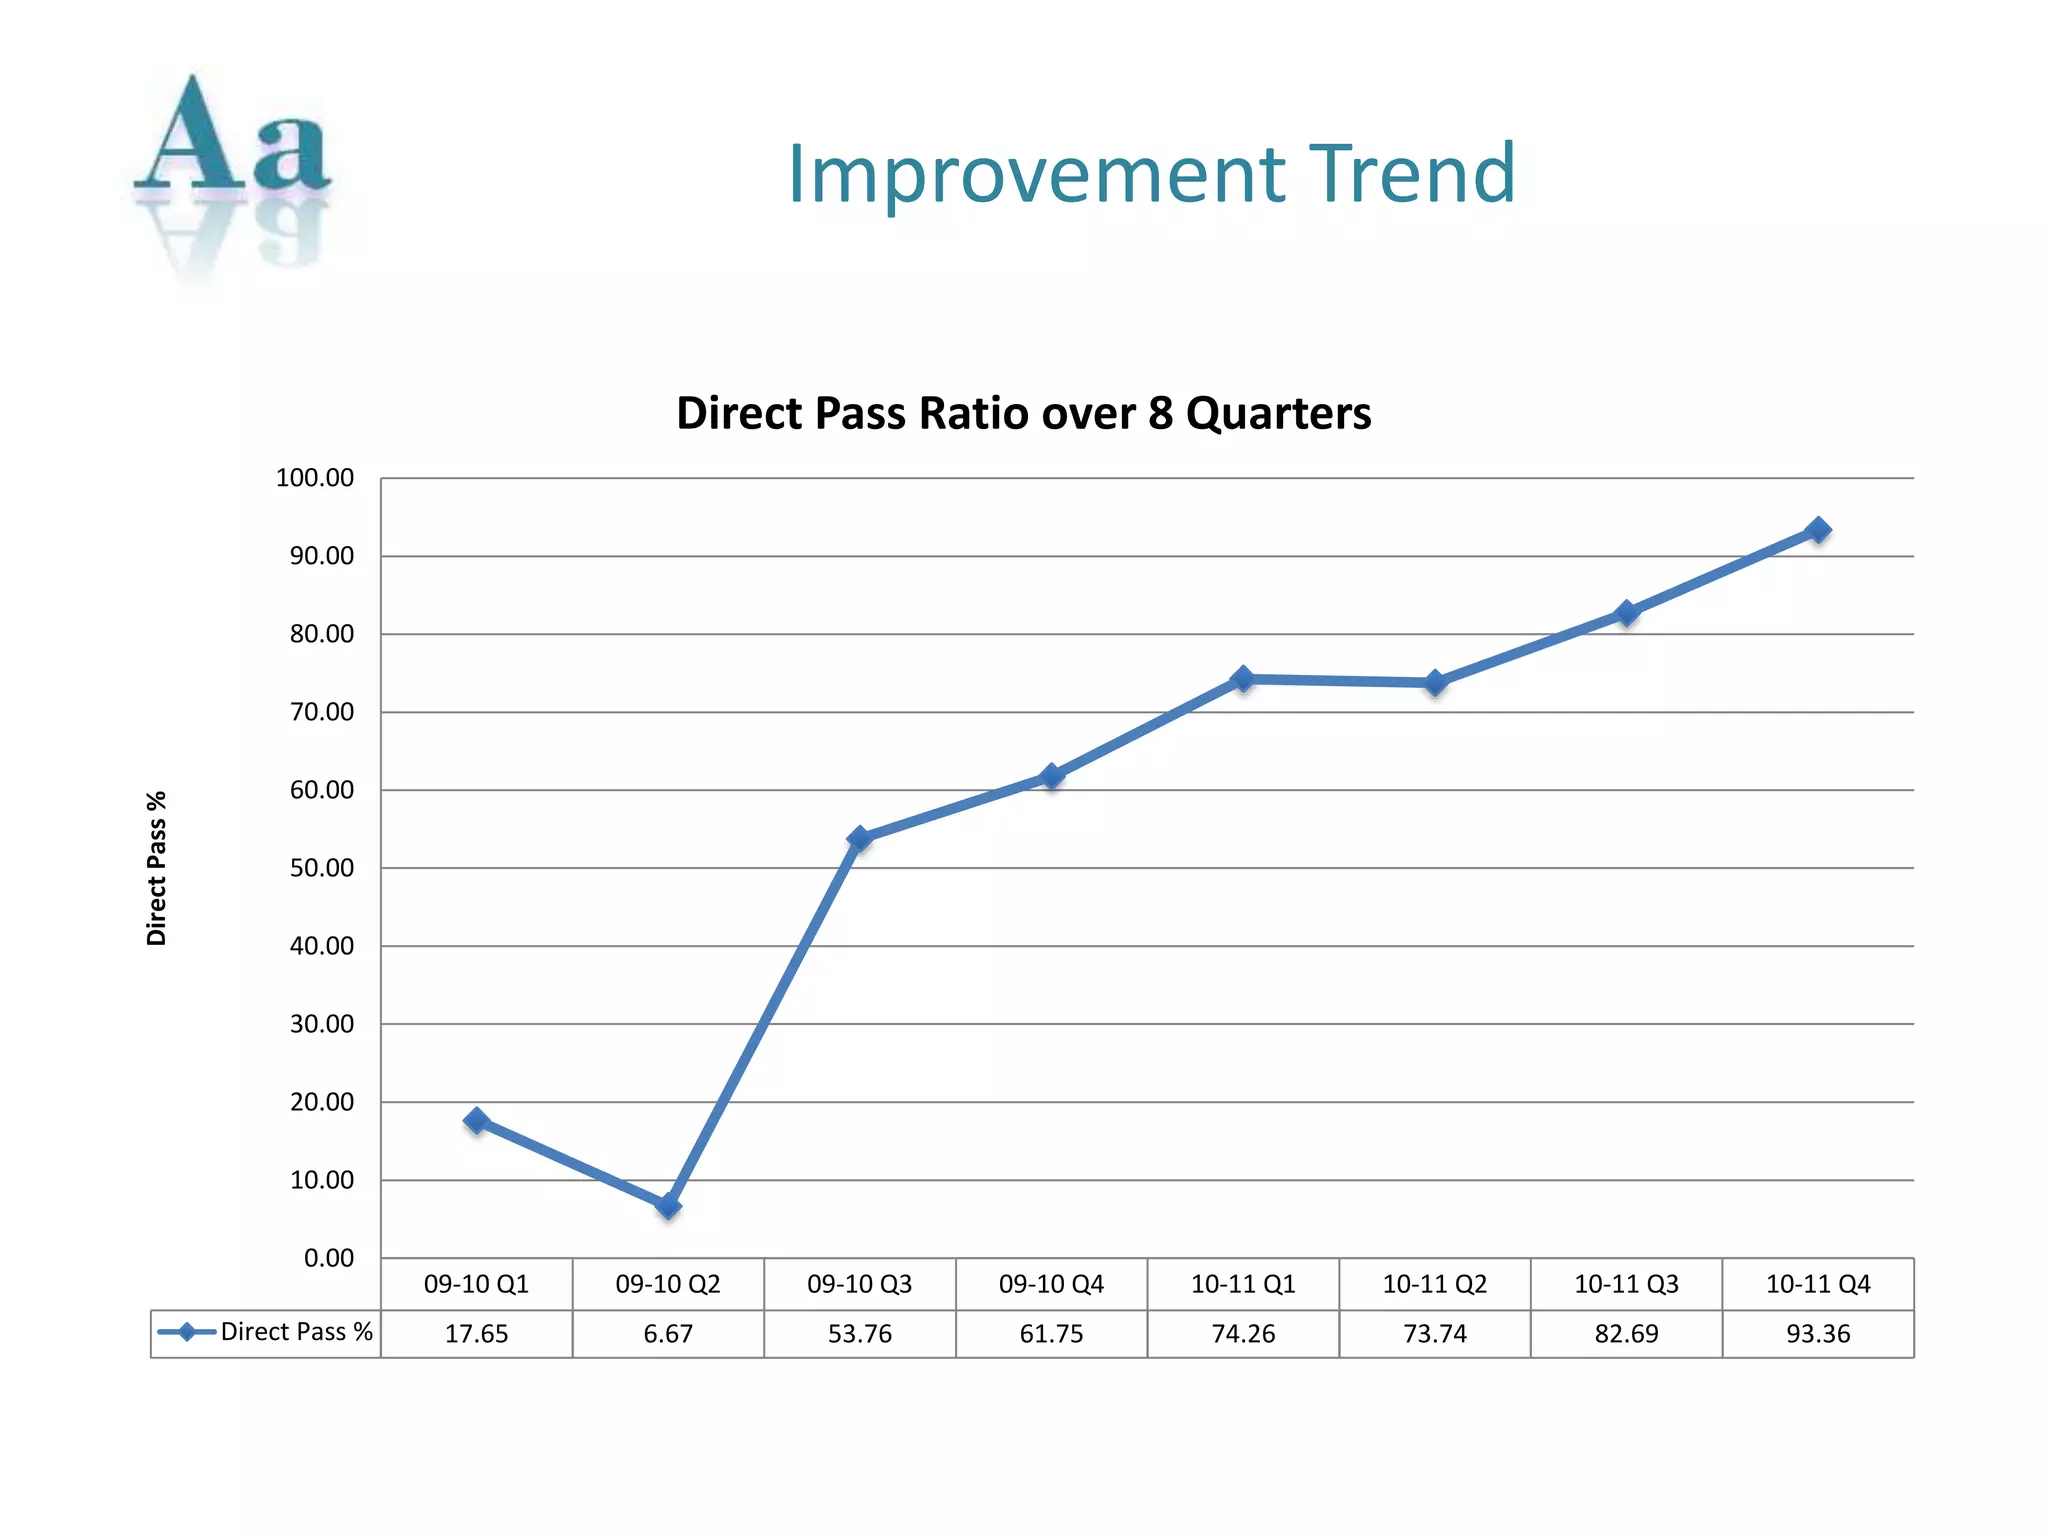
1) The project aimed to improve the direct pass ratio of castings produced by SUPPLIER for CUSTOMER from 0% to acceptable standards over 2 years. 2) Initial analyses found major casting defects and non-conformances due to issues like casting defects, poor mechanical properties, dimensions, and quality control processes. 3) Actions taken included establishing quality systems, control plans, process FMEAs, improving raw material combinations, training, and establishing testing standards. 4) Results showed significant improvement over 8 quarters from 17.65% to 93.36% direct pass ratio, with over 15,000 metric tons of acceptable castings produced after the project.


![OVERVIEW OF THE OIL & GAS EXPLORATION AND [Autosaved]](https://cdn.slidesharecdn.com/ss_thumbnails/f980b2ed-b37b-4c91-b049-14cec3820fe3-150826222206-lva1-app6891-thumbnail.jpg?width=640&height=640&fit=bounds)


