Maximizing Incident Investigation Efficacy in Oil & Gas: Techniques and Tools
1889.pdf
1. Operation and Safety of Dams …………………………...…………………………..Dr. Ammar H. Kamel
1
Reservoir Mass Curve and Storage:
During high flows, water flowing in a river has to be stored so that a uniform supply of water can be
assured, for water resources utilisation like irrigation, water supply, power generation, etc. during periods of
low flows of the river. A mass diagram is a graphical representation of cumulative inflow into the reservoir
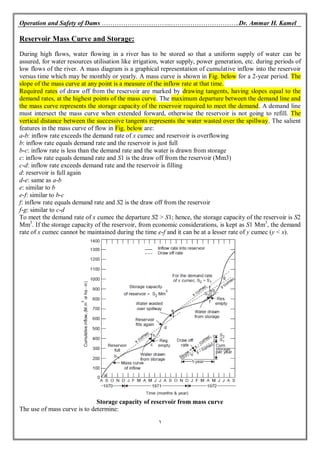
versus time which may be monthly or yearly. A mass curve is shown in Fig. below for a 2-year period. The
slope of the mass curve at any point is a measure of the inflow rate at that time.
Required rates of draw off from the reservoir are marked by drawing tangents, having slopes equal to the
demand rates, at the highest points of the mass curve. The maximum departure between the demand line and
the mass curve represents the storage capacity of the reservoir required to meet the demand. A demand line
must intersect the mass curve when extended forward, otherwise the reservoir is not going to refill. The
vertical distance between the successive tangents represents the water wasted over the spillway. The salient
features in the mass curve of flow in Fig. below are:
a-b: inflow rate exceeds the demand rate of x cumec and reservoir is overflowing
b: inflow rate equals demand rate and the reservoir is just full
b-c: inflow rate is less than the demand rate and the water is drawn from storage
c: inflow rate equals demand rate and S1 is the draw off from the reservoir (Mm3)
c-d: inflow rate exceeds demand rate and the reservoir is filling
d: reservoir is full again
d-e: same as a-b
e: similar to b
e-f: similar to b-c
f: inflow rate equals demand rate and S2 is the draw off from the reservoir
f-g: similar to c-d
To meet the demand rate of x cumec the departure S2 > S1; hence, the storage capacity of the reservoir is S2
Mm3
. If the storage capacity of the reservoir, from economic considerations, is kept as S1 Mm3
, the demand
rate of x cumec cannot be maintained during the time e-f and it can be at a lesser rate of y cumec (y < x).
Storage capacity of reservoir from mass curve
The use of mass curve is to determine:
2. Operation and Safety of Dams …………………………...…………………………..Dr. Ammar H. Kamel
2
(i) The storage capacity of the reservoir required to meet a particular withdrawal rate.
(ii) The possible rate of withdrawal from a reservoir of specified storage capacity.
The observed inflow rates have to be adjusted for the monthly evaporation from the reservoir surface,
precipitation, seepage through the dam, inflow from adjacent basins, required releases for downstream users,
sediment inflow, etc. while calculating the storage capacity of the reservoir.
Conclusions:
A mass curve (or Rippl diagram) is a cumulative of net reservoir inflow, the figure below shows a typical
mass curve.
The slope of the mass curve at any time is a measure of the inflow at that time.
Demand lines drawn tangent to the high points of the mass curve represent rates of withdrawal
from reservoir.
Maximum departure between the demand line and the mass curve represent the reservoir capacity
required to satisfy the demand.
The vertical distance between successive tangents represents water wasted over the spillway.
Typical mass curve
Typical mass curve