This document summarizes experiments and designs conducted as part of a water resources engineering lab. It includes:
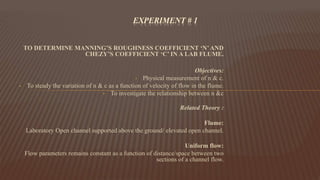
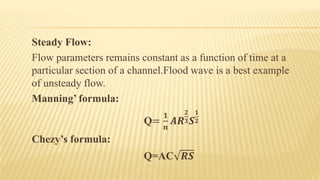
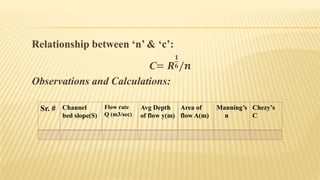
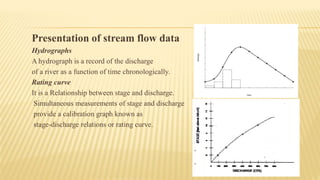
1. An experiment to determine Manning's roughness coefficient and Chezy's coefficient in a lab flume.
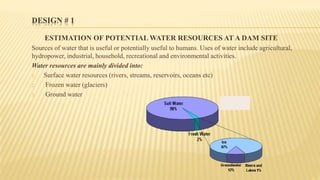
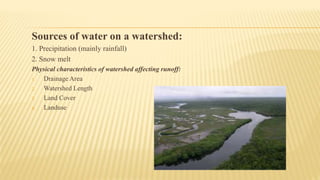
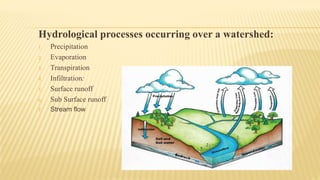
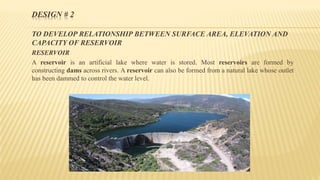
2. A design to estimate potential water resources at a dam site by analyzing sources of water in a watershed and hydrological processes.
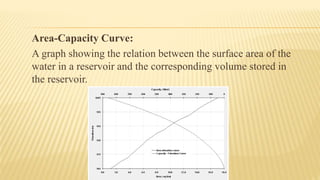
3. A design developing the relationship between surface area, elevation and capacity of a reservoir using area-capacity curves.
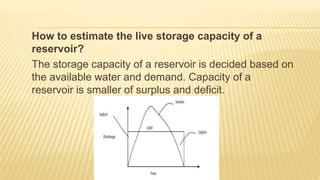
4. A design estimating the live storage capacity of a reservoir for different operational scenarios by calculating surplus and deficit volumes.
2. CONTENT:
1. EXPERIMENT #1 (Roughness coefficient)
2. DESIGN # 1(ESTIMATION OF POTENTIAL WATER AT A
DAM SITE)
3. DESIGN #2 (RELATIONSHIP B/w SURFACE AREA,
ELEVATION AND CAPACITY OF RESERVOIR)
4. DESIGN # 3(ESTIMATE THE LIVE STORAGE CAPACITY OF
A RESERVOIR )
3. TO DETERMINE MANNING’S ROUGHNESS COEFFICIENT ‘N’AND
CHEZY’S COEFFICIENT ‘C’ IN A LAB FLUME.
Objectives:
• Physical measurement of n & c.
• To steady the variation of n & c as a function of velocity of flow in the flume.
• To investigate the relationship between n &c
Related Theory :
Flume:
Laboratory Open channel supported above the ground/ elevated open channel.
Uniform flow:
Flow parameters remains constant as a function of distance/space between two
sections of a channel flow.
EXPERIMENT # 1
4. Steady Flow:
Flow parameters remains constant as a function of time at a
particular section of a channel.Flood wave is a best example
of unsteady flow.
Manning’ formula:
Q=
𝟏
𝒏
𝑨𝑹
𝟐
𝟑𝑺
𝟏
𝟐
Chezy’s formula:
Q=AC 𝑹𝑺
5. Relationship between ‘n’ & ‘c’:
C= 𝑹
𝟏
𝟔/𝒏
Observations and Calculations:
Sr. # Channel
bed slope(S)
Flow rate
Q (m3/sec)
Avg Depth
of flow y(m)
Area of
flow A(m)
Manning’s
n
Chezy’s
C
6. DESIGN # 1
ESTIMATION OF POTENTIAL WATER RESOURCES AT A DAM SITE
Sources of water that is useful or potentially useful to humans. Uses of water include agricultural,
hydropower, industrial, household, recreational and environmental activities.
Water resources are mainly divided into:
1. Surface water resources (rivers, streams, reservoirs, oceans etc)
2. Frozen water (glaciers)
3. Ground water
7. Sources of water on a watershed:
1. Precipitation (mainly rainfall)
2. Snow melt
Physical characteristics of watershed affecting runoff:
1. Drainage Area
2. Watershed Length
3. Land Cover
4. Landuse
8. Hydrological processes occurring over a watershed:
1. Precipitation
2. Evaporation
3. Transpiration
4. Infiltration:
5. Surface runoff
6. Sub Surface runoff
7. Stream flow
9. Presentation of stream flow data
Hydrographs
A hydrograph is a record of the discharge
of a river as a function of time chronologically.
Rating curve
It is a Relationship between stage and discharge.
Simultaneous measurements of stage and discharge
provide a calibration graph known as
stage-discharge relations or rating curve.
10. DESIGN # 2
TO DEVELOP RELATIONSHIP BETWEEN SURFACE AREA, ELEVATION AND
CAPACITY OF RESERVOIR
RESERVOIR
A reservoir is an artificial lake where water is stored. Most reservoirs are formed by
constructing dams across rivers. A reservoir can also be formed from a natural lake whose outlet
has been dammed to control the water level.
11. Types of Reservoirs
1. Storage Reservoirs
2. Flood Control Reservoirs
3. Distribution Reservoirs
4. Multipurpose Reservoirs
12. Area-Capacity Curve:
A graph showing the relation between the surface area of the
water in a reservoir and the corresponding volume stored in
the reservoir.
13. DESIGN # 3
TO ESTIMATE THE LIVE STORAGE CAPACITY OF A RESERVOIR FOR
VARIOUS OPERATIONAL SCENARIOS
Reservoir
It is an area impounded by water due to the storage of part of catchment runoff by
constructing a barrier/dam across a river/stream.
Level & storages of reservoir
Full reservoir level (FRL)
The full reservoir level (FRL) is the highest water level to which the water surface will
rise during normal operating conditions.
14. Maximum water level (MWL)
The maximum water level is the maximum level to which the water surface will rise
when the design flood passes over the spillway.
Minimum pool level
The minimum pool level is the lowest level up to which the water is withdrawn from the
reservoir under ordinary conditions
Dead storage
The volume of water held below the minimum pool level is called the dead storage.
15. Live/useful storage
The volume of water stored between the full reservoir level (FRL) and the minimum
pool level is called the useful storage.
Flood/Surcharge storage
It is storage contained between maximum reservoir level and full reservoir levels. It
varies with spillway capacity of dam for given design flood.
Bank storage
It is developed in the voids of soil cover in the reservoir area and becomes available as
seepage of water when water levels drops down. It increases the reservoir capacity.
16. How to estimate the live storage capacity of a
reservoir?
The storage capacity of a reservoir is decided based on
the available water and demand. Capacity of a
reservoir is smaller of surplus and deficit.
17. Explanation
For example if deficit is 30 MCM & surplus is 60 MCM. According to definition we will
keep capacity as 30 MCM. Reasons are that we need just 30 MCM extra. If we keep
reservoir capacity equal to 60 MCM then the extra 30 MCM are useless, and it will
cause sedimentation, and construction cost will increased. And if there is a reverse case
i.e. deficit is 60 MCM and surplus is 30 MCM. Then obviously we will decide capacity
of reservoir as 30 MCM. Reason for this decision is that although we need 60 MCM, but
we have not enough water available to store. The maximum water available is 30 MCM,
so designing a reservoir at more than this capacity is of no use.