Nsf online lecture 5 customer relationships
•Download as PPTX, PDF•
12 likes•15,028 views

The document discusses customer relationships and how to get, keep, and grow customers. It provides examples of different customer archetypes and how their roles, budgets, motivations, and influences impact getting their business. It also discusses paid and free demand creation activities, as well as calculating customer acquisition cost and lifetime value to understand the balancing act between acquiring and retaining customers. Physical products are compared to web/mobile products in terms of different customer relationship challenges and opportunities.

Recommended
More Related Content
What's hot
What's hot (20)
Viewers also liked
Similar to Nsf online lecture 5 customer relationships
Similar to Nsf online lecture 5 customer relationships (20)
More from Stanford University
More from Stanford University (20)
Recently uploaded
Recently uploaded (20)
Nsf online lecture 5 customer relationships
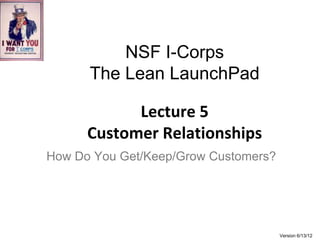
- 1. NSF I-Corps The Lean LaunchPad Lecture 5 Customer Relationships How Do You Get/Keep/Grow Customers? Version 6/13/12
- 2. Customer Relationships How do you Get, Keep and Grow Customers?
- 3. © 2012 Steve Blank
- 4. Customer Relationships Physical & Web Mobile Are Different © 2012 Steve Blank
- 5. Customer Relationships Physical Products – Get Customers © 2012 Steve Blank
- 6. Customer Archetypes Drive Get/Keep/Grow Lab Manager: Brian • What’s their role? – How this person is evaluated / promoted / compensated? • Who are they? – Buyer’s name – Position / title / age / sex • How do they buy? – Discretionary budget (name of budget and amount) • What matters to them? – What motivates them? • Who influences them? – What do they read/who do they listen to?
- 7. Paid Demand Creation Activities “Paid” Media Demand Creation • Public Relations • Advertising • Trade Shows • Webinars • Email marketing • On-line SEM • Biz Dev
- 8. Free Demand Creation Activities “Earned” Media Demand Creation • Publications in journals • Conference speeches/papers • Educational seminars • Public relations • Blogging / Sharable content • Social Media • Communities
- 9. Customer Relationships Physical Products – Get Customers © 2012 Steve Blank
- 10. Customer Relationships Physical Products – Get Customers CAC = Customer Acquisition Cost © 2012 Steve Blank
- 11. Customer Acquisition Cost versus Sales Complexity No Touch Light Touch High Touch Field Sales Freemium Field Sales Self-Service Inside Sales Inside Sales with SE’s Rough Estimates of Cost of Customer Acquisition (CAC) $0- $50 – $1,000 - $3,000 - $25,000 – $75,000 – $10 $200 $2,000 $8,000 $75,000 $200,000 Source: David Skok Matrix Partners
- 12. Customer Relationships Physical Products – Keep Customers © 2012 Steve Blank
- 13. Customer Relationships Physical Products – Keep Customers Attrition/Churn © 2012 Steve Blank
- 14. Customer Relationships Physical Products – Grow Customers © 2012 Steve Blank
- 15. Customer Relationships Physical Products – Get/Keep/Grow LTV = Customer Lifetime Value © 2012 Steve Blank
- 16. Customer Relationships Web/Mobile Products– Get Customers © 2012 Steve Blank
- 17. Web/Mobile Products– Get Customers CPM = cost per thousand hits © 2012 Steve Blank
- 18. Web/Mobile Products– Get Customers CPA = Cost per Action © 2012 Steve Blank
- 19. SaaSProducts– Get Customers Organic Traffic, SEM, Other Paid Sources Registered Visitors Raw Leads Qualified Leads Inside Sales Closed Deal © 2012 Steve Blank
- 20. Web/Mobile Products– Keep Customers
- 21. Our Example Marketing Funnel Quick Marketing Calculation 50% amount of traffic that is organic versus paid $1.50 cost per paid visitor (Google AdWords, etc.) $ 0.75 Cost per visitor (both paid and unpaid) 3% visitors convert to raw leads 20% number of raw leads that turn into qualified leads 1 qualified lead 5 raw leads required 167 visitors required $125 Cost of visitors (also = Cost per qualified lead) Source: David Skok Matrix Partners
- 22. Our Example Marketing Funnel Quick Marketing Calculation 50% amount of traffic that is organic versus paid $1.50 cost per paid visitor (Google AdWords, etc.) $ 0.75 Cost per visitor (both paid and unpaid) 3% visitors convert to raw leads 20% number of raw leads that turn into qualified leads 1 qualified lead 5 raw leads required 167 Visitors required $125Cost per qualified lead Source: David Skok Matrix Partners
- 23. Our Example Marketing Funnel Cost per Qualified Lead $125 Leads to closed deal 10 Marketing Costs per closed deal $1,250 Source: David Skok Matrix Partners
- 24. We Can Compute CAC and LTV Excludes people costs Lead Gen costs per deal $ 1,250 (Cost per qualified lead x no of leads required per closed deal) Selling costs per deal $ 1,620 Excludes cost of sales management Excludes people costs in marketing, and Total CAC $ 2,870 sales management. (CAC= Cost to Acquire a Customer) Calculated by dividing average monthly Total LTV $ 16,000 gross profit per customer (ARPU x Gross Margin ) by the churn rate This excludes people costs in marketing, and sales management costs Source: David Skok Matrix Partners
- 25. Balancing CAC/LTV in a SaaS model LTV >3x CAC Months to recover CAC <12 months Required for Capital Efficiency Source: David Skok Matrix Partners
- 26. What Investors are Looking For A well balanced business model Monetization (LTV) Cost to Acquire a Customer (CAC) Source: David Skok Matrix Partners
- 27. The Balancing Act • Viral effects • Inbound Marketing • Free or Freemium • Open Source • Free Trials • Touchless conversion • Inside Sales • Channels • Strategic partnerships Cost to Acquire a Customer Monetization (CAC) (LifeTime Value LTV) • Scalable Pricing • Cross Sell/Upsell • Product line expansion • Lead Gen for 3rd parties Source: David Skok Matrix Partners
- 28. The Balancing Act • Viral effects • Inbound Marketing • High Churn Rates • Free or Freemium • Open Source • Low customer • Free Trials satisfaction • Touchless conversion • Inside Sales • Channels • Strategic partnerships Cost to Acquire a Customer Monetization (CAC) (LifeTime Value LTV) • Field Sales • Scalable Pricing • Cross Sell/Upsell • Outbound • Product line expansion Marketing • Lead Gen for 3rd parties Source: David Skok Matrix Partners
- 29. Customer Relationships Web/Mobile Products– Keep Customers © 2012 Steve Blank
- 30. How Churn affects LTV • Average customer lifetime in months = 1 / Monthly Churn Source: David Skok Matrix Partners
- 31. How Churn affects Lifetime Months Lifetime vs Churn Rate 120 100 100 80 60 50 40 20 20 0 Monthly Churn 1% 2% 5% Source: David Skok Matrix Partners
- 32. How Churn affects LTV Lifetime Value Monthly Churn Source: David Skok Matrix Partners
- 33. Impact of lowering Churn Cumulative Net Profit Net Profit $7,000,000 $1,200,000 $6,000,000 $1,000,000 $5,000,000 $4,000,000 $800,000 $3,000,000 $600,000 $2,000,000 $400,000 $1,000,000 $200,000 $- Month 1 Month 3 Month 5 Month 7 Month 9 Month 11 Month 13 Month 15 Month 17 Month 19 Month 21 Month 23 Month 25 Month 27 Month 29 Month 31 Month 33 Month 35 $(1,000,000) $- $(2,000,000) $(200,000) $(3,000,000) $(400,000) $(4,000,000) Churn 1.25% Churn 2.5% Churn 1.25% Churn 2.5% • Impact of lowering the churn rate is felt more heavily in the later years, as expected • It has a significant impact on the long term profitability of the business Source: David Skok Matrix Partners
- 34. Churn • 1% to 2.5% churn per month is acceptable • Higher than that, you are filling a leaky bucket – Need to understand why you have low customer satisfaction and address the problem Source: David Skok Matrix Partners
- 35. Customer Relationships Web/Mobile Products– Grow Customers © 2012 Steve Blank
- 36. Customer Relationships Web/Mobile Products Get/Keep/Grow © 2012 Steve Blank
- 37. Ag Robot Customer Relationships Example
- 38. Demand generation plan and budget • Word of mouth generation – 2 systems for “Demo day events” – 2 systems for customer demos – 4 x 30K each = $120,000 • World Ag Expo Booth – 1 x 40x40 corner booth with demo – Hold press event breakfast – $ 15 K (booth, banners, hotels) • Magazine campaign – 3 ads in 2 magazines – Goal – get 2 articles on us – 2 x $ 10K + Ad agency = 30K • Total $165 K “You prove that it works and everything else is easy. Distribution is not that complicated in farming.” – Wyatt Duncan, Integrated Crop Pest Control
- 39. Medical Device Customer Relationships Example
- 48. Housing App Customer Relationship Example
- 49. • We ran a Facebook ad to test actual willingness2 to pay for this service 49
- 50. • To test willingness to pay we used three 2 identical ads with three different landing pages 50
- 51. • To test willingness to pay we used three 2 identical ads with three different landing pages Ad Sign-ups Clicks Ad spend Free 0 23 $25 $1/household 0 25 $25 $1/user 0 24 $25 • Unfortunately, test results only proved users did not trust our site for payments • Facebook traffic on this campaign was on our page for 4 seconds on average • Roommate campaign had a 1:37 site time average • Outstanding question: can we win trust in other ways and then engage users to pay rent through us? 51
- 52. • Customer archetype: Sara How she searches Wants to be efficient (will use a broker if doing a search on her own is too painful) Asks friends for recommendations What Matters to Sara Wants to live in a fun place that is safe Doesn’t want to overpay Doesn’t have much time to hunt for a place Live with someone she trusts (moving to DC) Influences Where friends go out/live Work location 52
- 53. Online Dating Customer Relationships Example
- 54. What We Did: Landing Page + Web App
- 55. What We Found: High referral traffic 4 day progress report Overall Signup progress 1258 31 filled 5- 136 min survey 10.8%
- 56. What we did: Targeted women, all couples Demand generation test Hypothesis: Women-in-relationships are likelier to click through, irrespective of distance status Tested for $30 Facebook click through & conversion from FB impressions Ad-1 Ad-3 Ad-2 Ad-4
- 57. What we found: women click more ...................................but not clear who will pay! Couples will pay subscription if they find more Subscription model test 1 sharing during free trial valuable LDRs 1 Takeaway: “More 6 sharing” without Paid convenience will have to be free. SLRs 4 Good if free Women likelier to click through irrespective of Demand generation test II distance status Click LOCATION Impressions Through Men Women Women-in-rel rates 87140
- 58. What we found: Clicks, no web app usage Demand generation test Funnel: “Couples” campaign $ 29.7 this week 304,286 0.01 c impressions 122 uniques 0.35 c/new 85 new 24.6% conversion 30 sign-up 0.99 c clicks but one used web app
- 59. Online Sales Customer Relationships Example
- 60. Year 1 Web funnel Year 5 100 000 hits Referenced to our web site 300 000 hits 50% 70% Fill out savings calculator 20% 30% Send request to sales 30% 30% Reconnection with viable customer 80% 80% Visit to site 10% 20% Close sale Total Total Revenue 1.44 million Revenue 18.14 million
- 61. Mobile App Customer Relationships Example
- 62. Success Depends on Virality> Churn Ratio of early stage viralityrate to churn rate = 2.00x
- 63. Success Depends on Virality>Churn Ratio of early stage viralityrate to churn rate = 1.50x
- 64. Success Depends on Virality>Churn Ratio of early stage viralityrate to churn rate = 1.0x
- 65. Demand creation via website 1 2 3 “Not a landing page” Doesn’t show the No Indonesian version product
- 66. Demand creation via website - results Clicks CTR 100 74 2.00% 1.56% 68 1.25% 50 22 1.00% 0.59% 0 0.00% 1 2 3 1 2 3 People need to use the product CPC for us to maximize Conversions per click learning 1.5 1.34 6.00% 4.05% 1 0.62 4.00% 2.94% 0.54 0.5 2.00% 0.00% 0 0.00% 1 2 3 1 2 3
- 67. Software Reference Tool Customer Relationships Example
- 68. AdWords Testing
- 69. AB Testing Results 0% conversion 42% conversion 75% conversion 32% conversion • Original Peaya website has 66% conversion rate • Conversion defined as people clicking the download button on the landing page • Experiment still underway; too few data points for drawing conclusions
- 70. Google &Facebook campaigns • Keywords: free endnote, reference manager, pdf manager, Itunes for digital content, I tunes, manage pdf, organize paper, paper manager, citation manager, paper citation, cite pdfs • 24 impressions, 2 clicks on googleadwords • Clicks on free endnote and organize paper • No Facebook response • 1 Post on ResearchGate drew 7 visitors
- 71. We’re “a little” viral 12% of sign-ups from referrals 14 of 117 new registrations came from referrals by 3 people from Jan 1 to Feb 1. Referral bonus promoted in tutorial
- 72. Collaboration doesn’t “pop”…. yet “Rate & Discuss” is least interesting tutorial screen so far However: 1) we can test different messages (ie “collaborate”) 2) experiment is slightly biased in ordering, we need further testing
- 74. Search Keywords Lesson Learned: Very little search traffic -> a “missionary” sales effort
- 75. Highly Competitive Keywords Lesson Learned: AdWords (paid SEM) is not going to be an efficient channel with these keywords
- 76. Medical Device Customer Relationships Example
- 77. ChannelIncentives VP All Institutions Out-patient care/ Per Service High Value home setting Revenue Model Therapies Hospitals Private Dosing flexibility Hospitals, specialty clinics Efficient patient Pain Clinics management In-patient care/ Per Diem hospitalization Pharmacoeconomics Revenue Model HMO, ACO, Non- profit, University Hospitals
- 78. Demand Creation Patients/Advocacy Groups Conferences / Trade magazines / PR Societies conferences $20k/event * 6 events $20k/event * 4 events Research Journal One on one Meetings $150k/year travel Adoption Publications (Free) Budget ~ $300 k/year